MAAP #131: Power of Free High-resolution Satellite Imagery from Norway Agreement

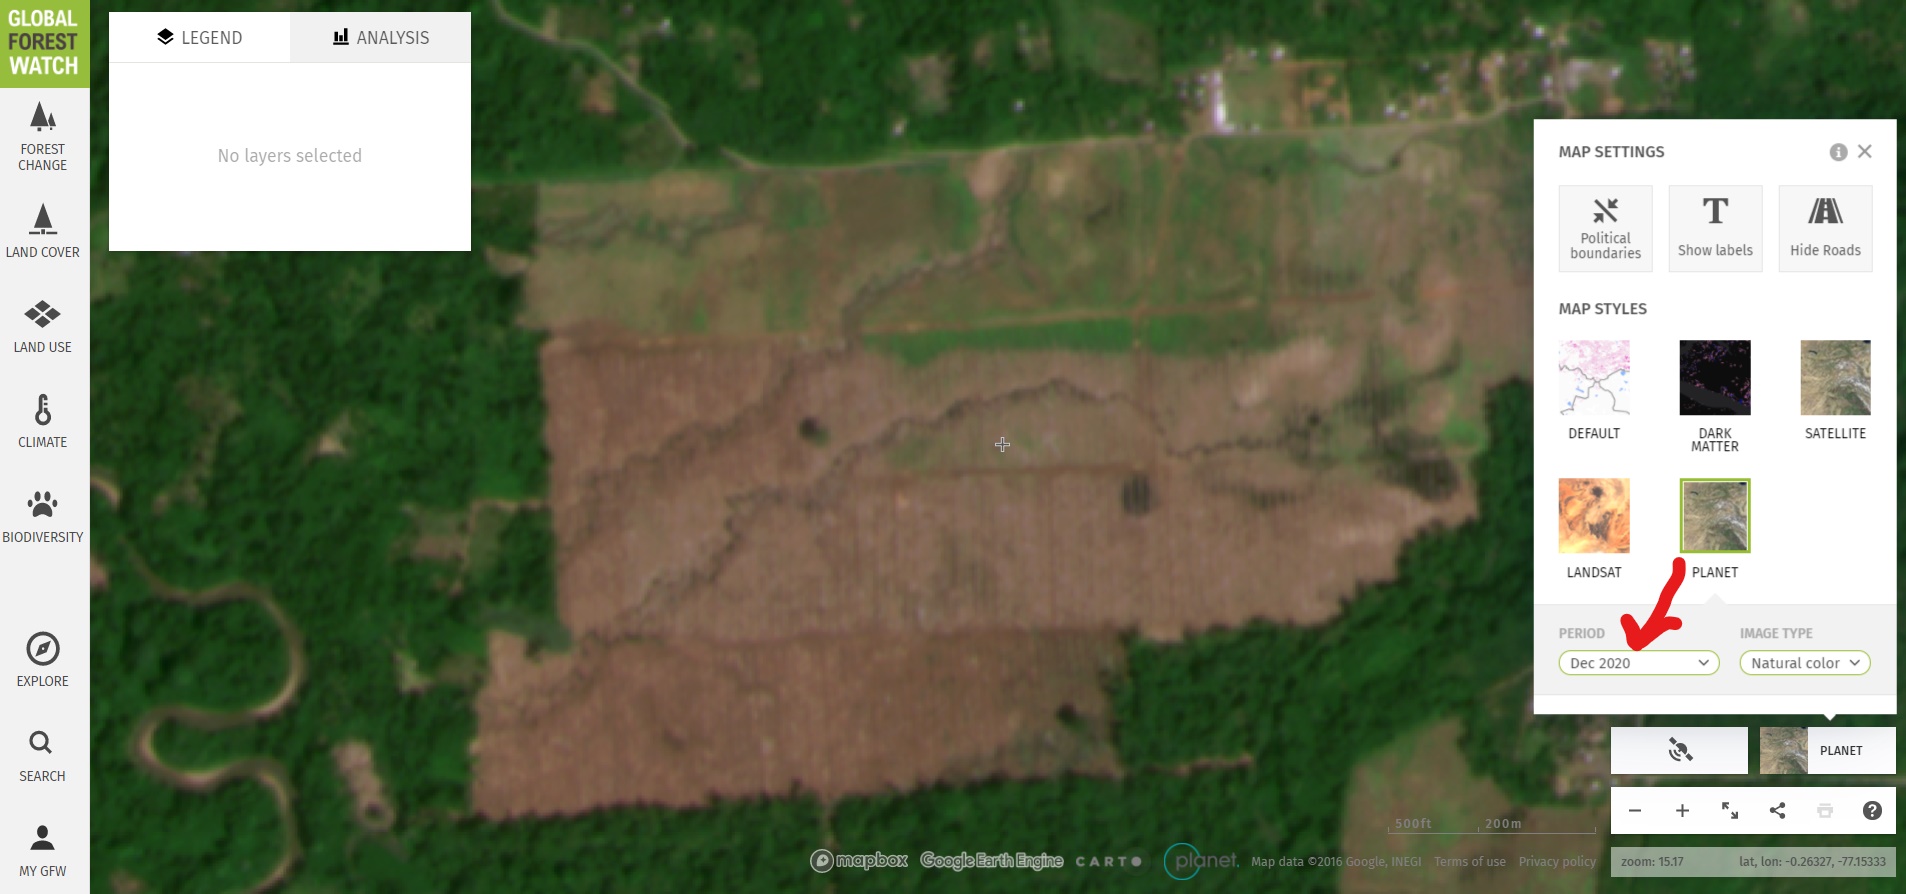
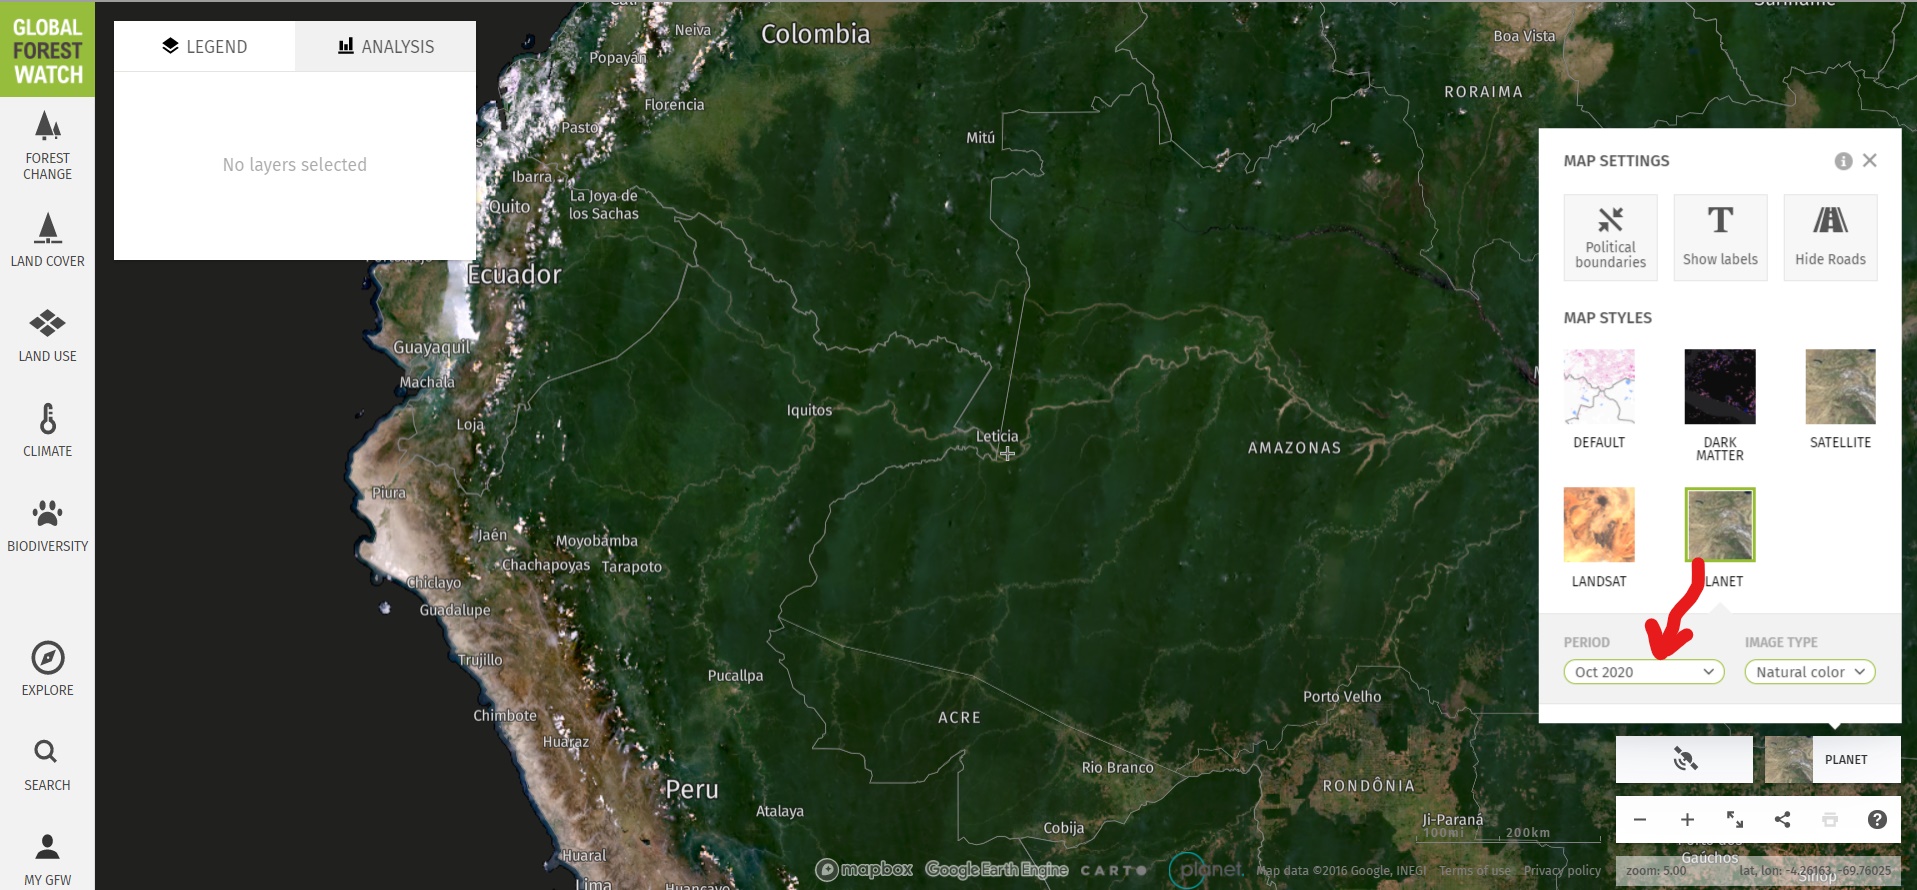
Image 1. Monthly Planet basemap for October 2020 across the Amazon, as seen on Global Forest Watch.

This report demonstrates the powerful application of freely available, high-resolution satellite imagery recently made possible thanks to an agreement between the Government of Norway and several satellite companies.*

This unprecedented agreement will bring commercial satellite technology, previously out of reach to many, to all working in tropical forest conservation around the world.

Here we show how MAAP (an initiative of Amazon Conservation) will use this information to enhance our real-time monitoring program and quickly share timely findings to partners in the field.

Specifically, we highlight the importance of the monthly basemaps (4.7-meter Planet imagery) available under the Norway agreement.* For example, Image 1 shows the stunning, nearly cloud-free October 2020 basemap across the Amazon.

l
Moreover, we show the power of this imagery visualized on Global Forest Watch, where it can be combined with early warning forest loss alerts.
p
Below, we highlight three examples where we combined this data to quickly detect and confirm deforestation in the Colombian, Ecuadorian, and Peruvian Amazon, respectively.

Colombian Amazon

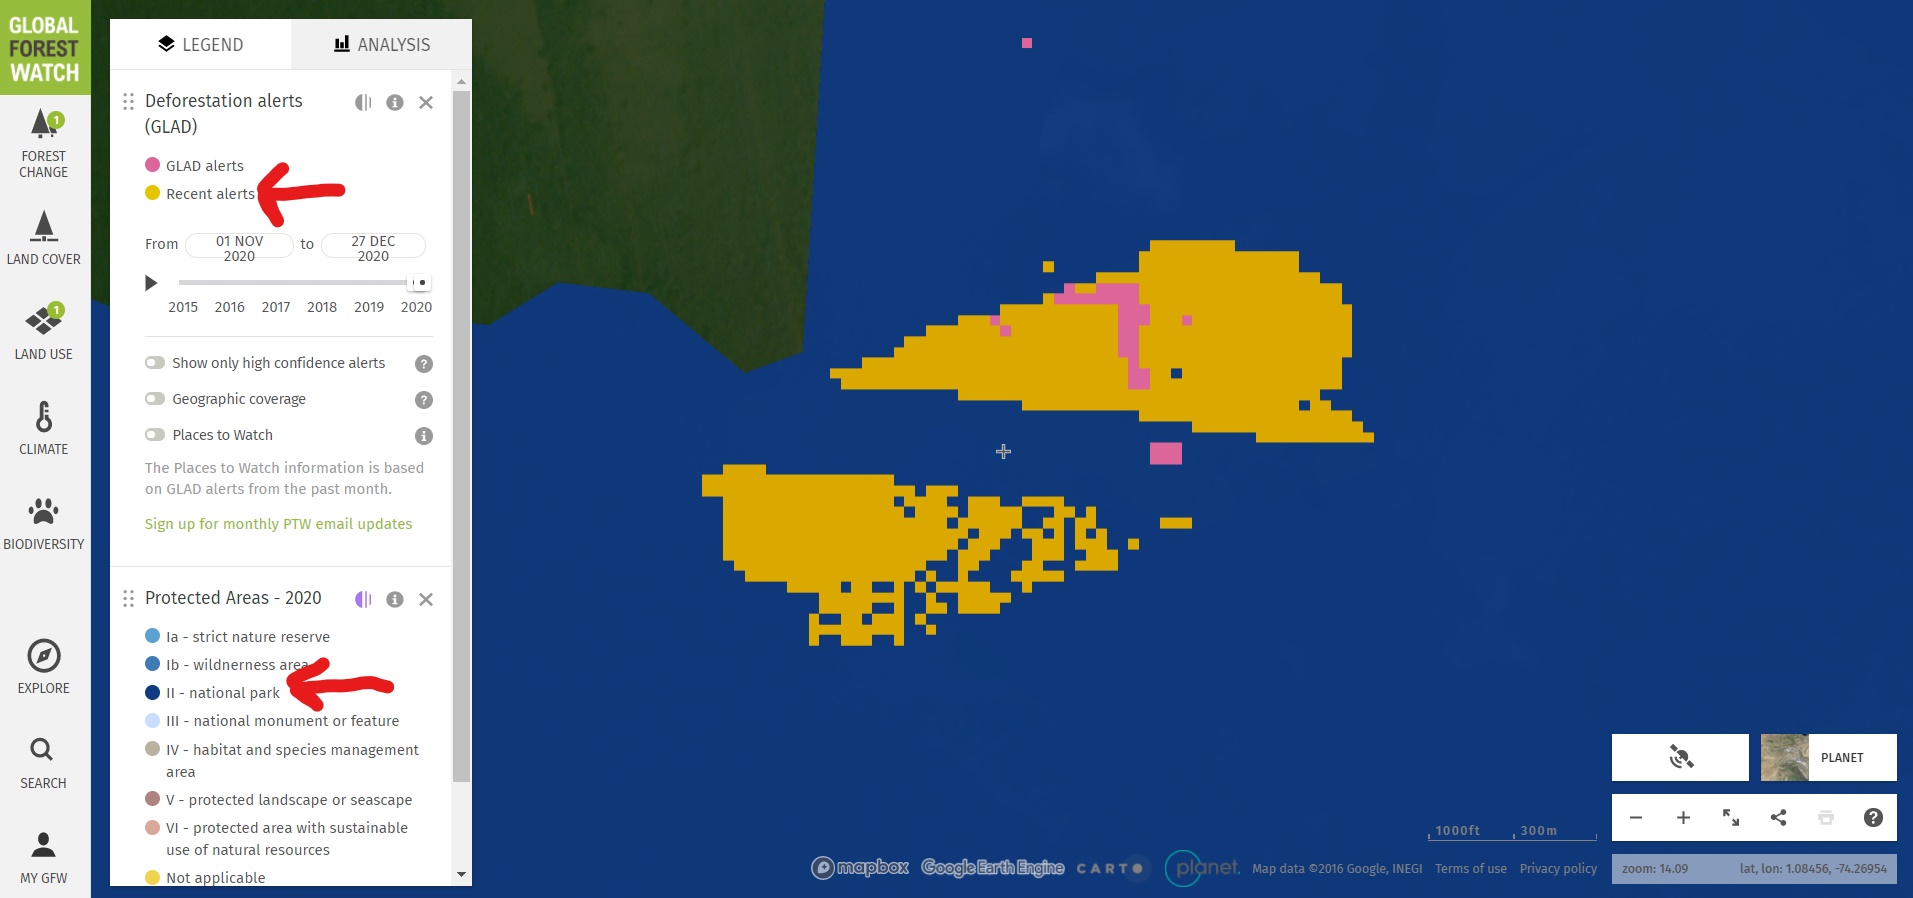
First, we detected recent forest loss alerts (known as GLAD alerts), in the northwestern sector of Chiribiquete National Park. Image 2 is a screen shot of our monitoring search in Global Forest Watch (link here).

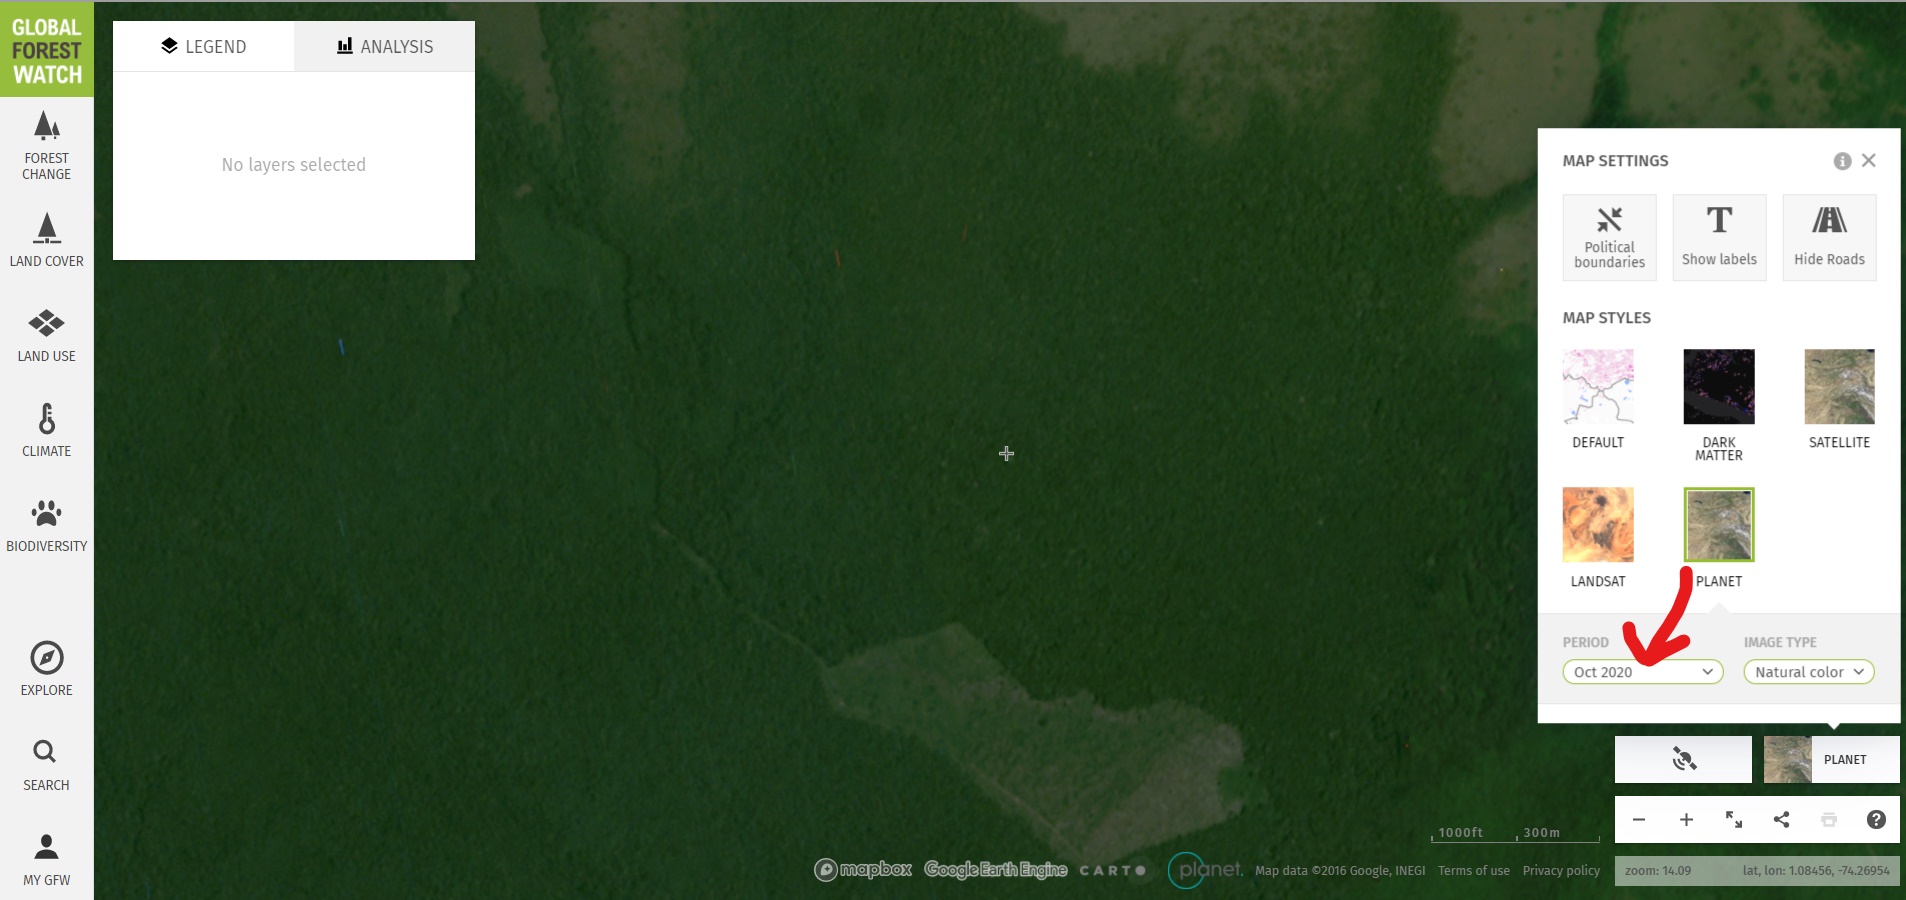
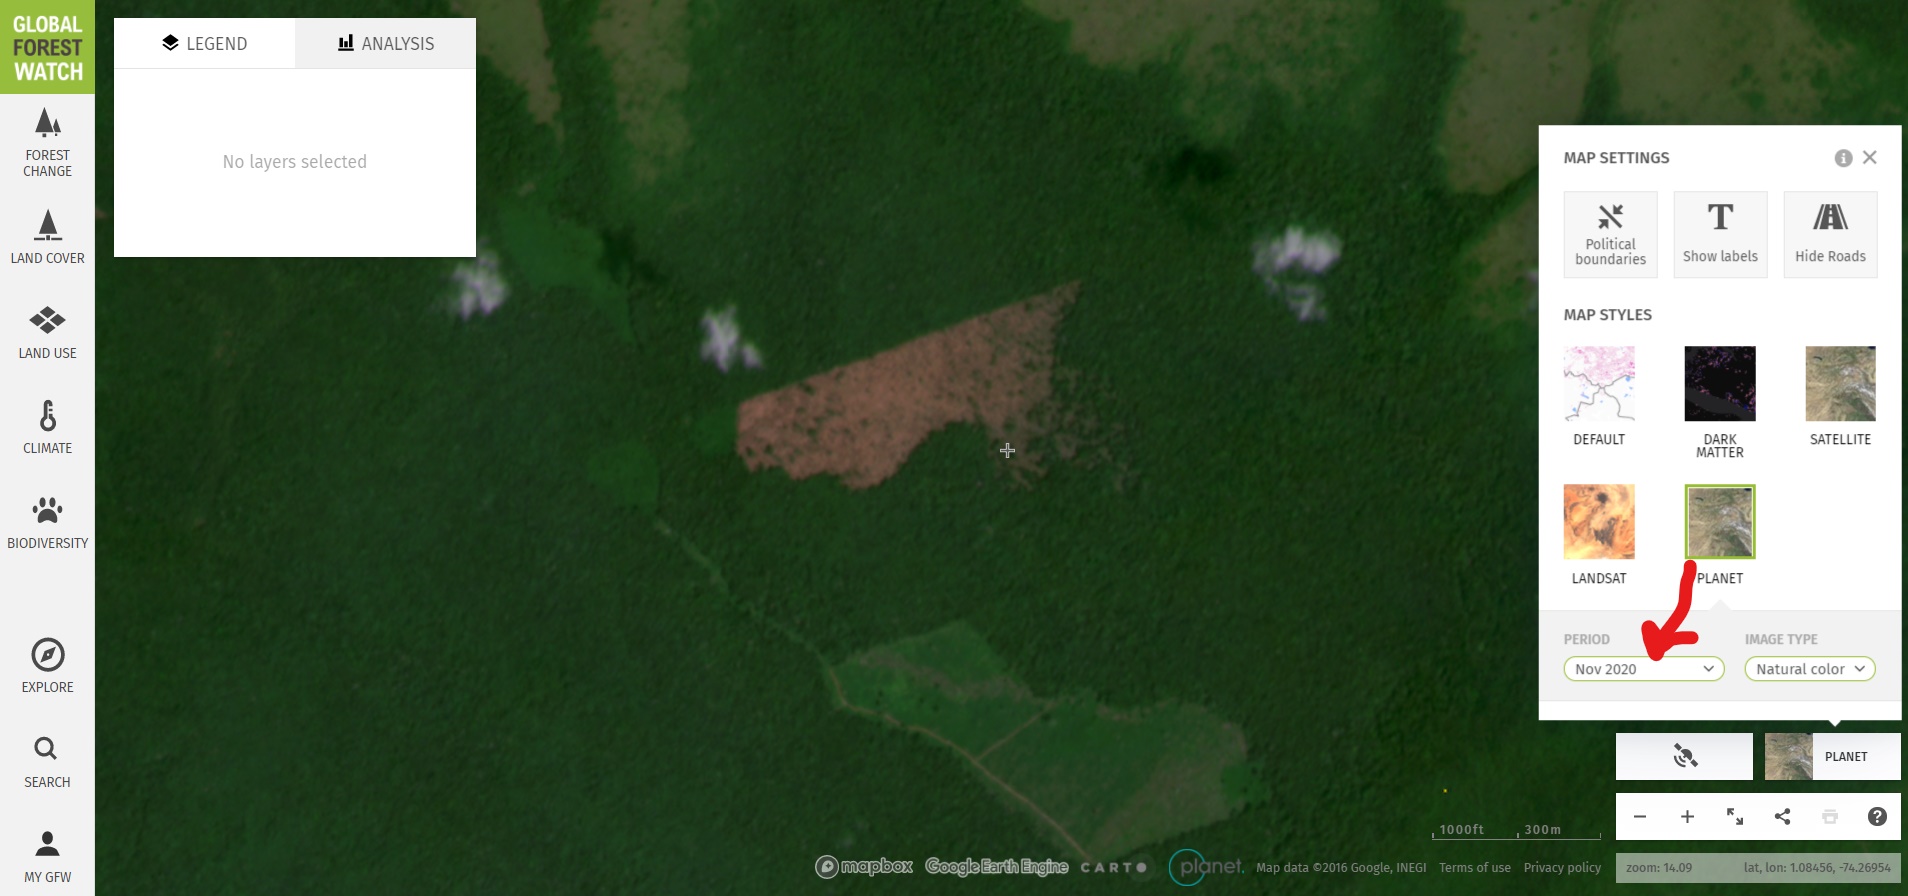
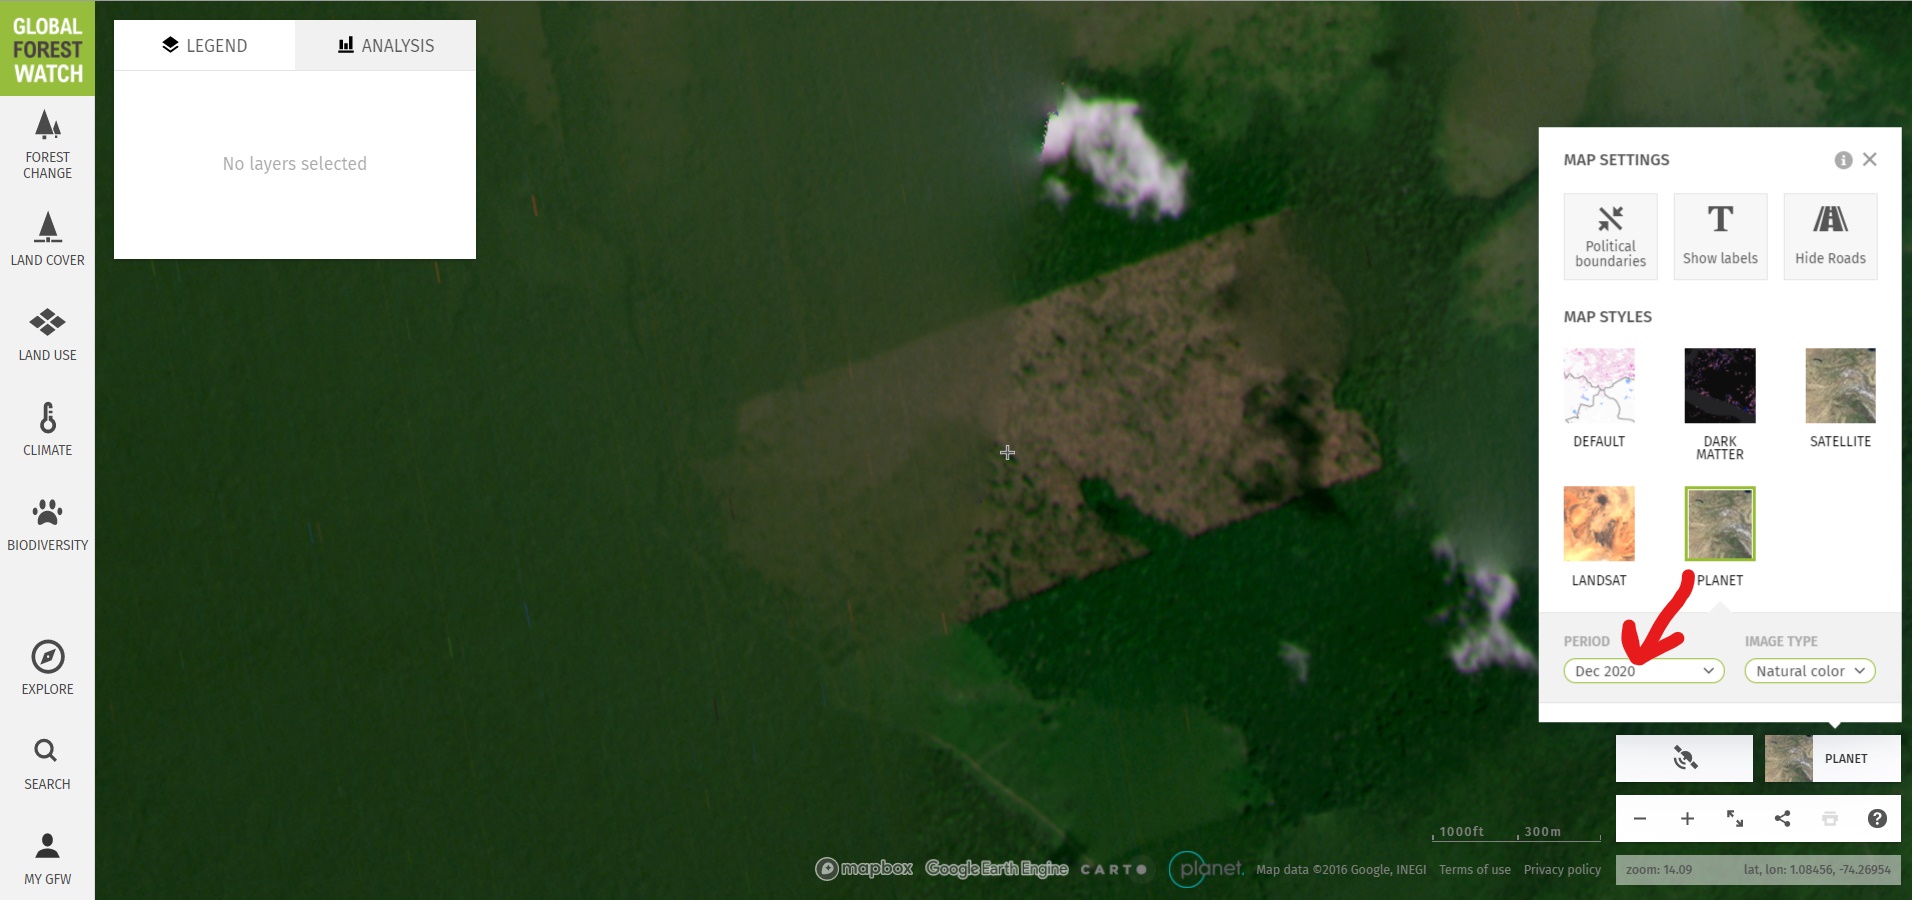
Second, we investigated the alerts with the freely available monthly Planet basemaps. Images 3-5 show the basemaps from October to December 2020. These images confirm that the area was covered in intact (likely primary) Amazon rainforest in October, and then experienced a major deforestation event (225 hectares) in November and December. Similar deforestation in the area appears to be conversion to cattle pasture. Note the crosshairs (+) represent the same point in all four images.

Image 2. Forest loss alerts in Chiribiquete National Park
Image 3. Monthly Planet basemap for October 2020 in Chiribiquete National Park.
Image 4. Monthly Planet basemap for November 2020 in Chiribiquete National Park.
Image 5. Monthly Planet basemap for December 2020 in Chiribiquete National Park.

Peruvian Amazon

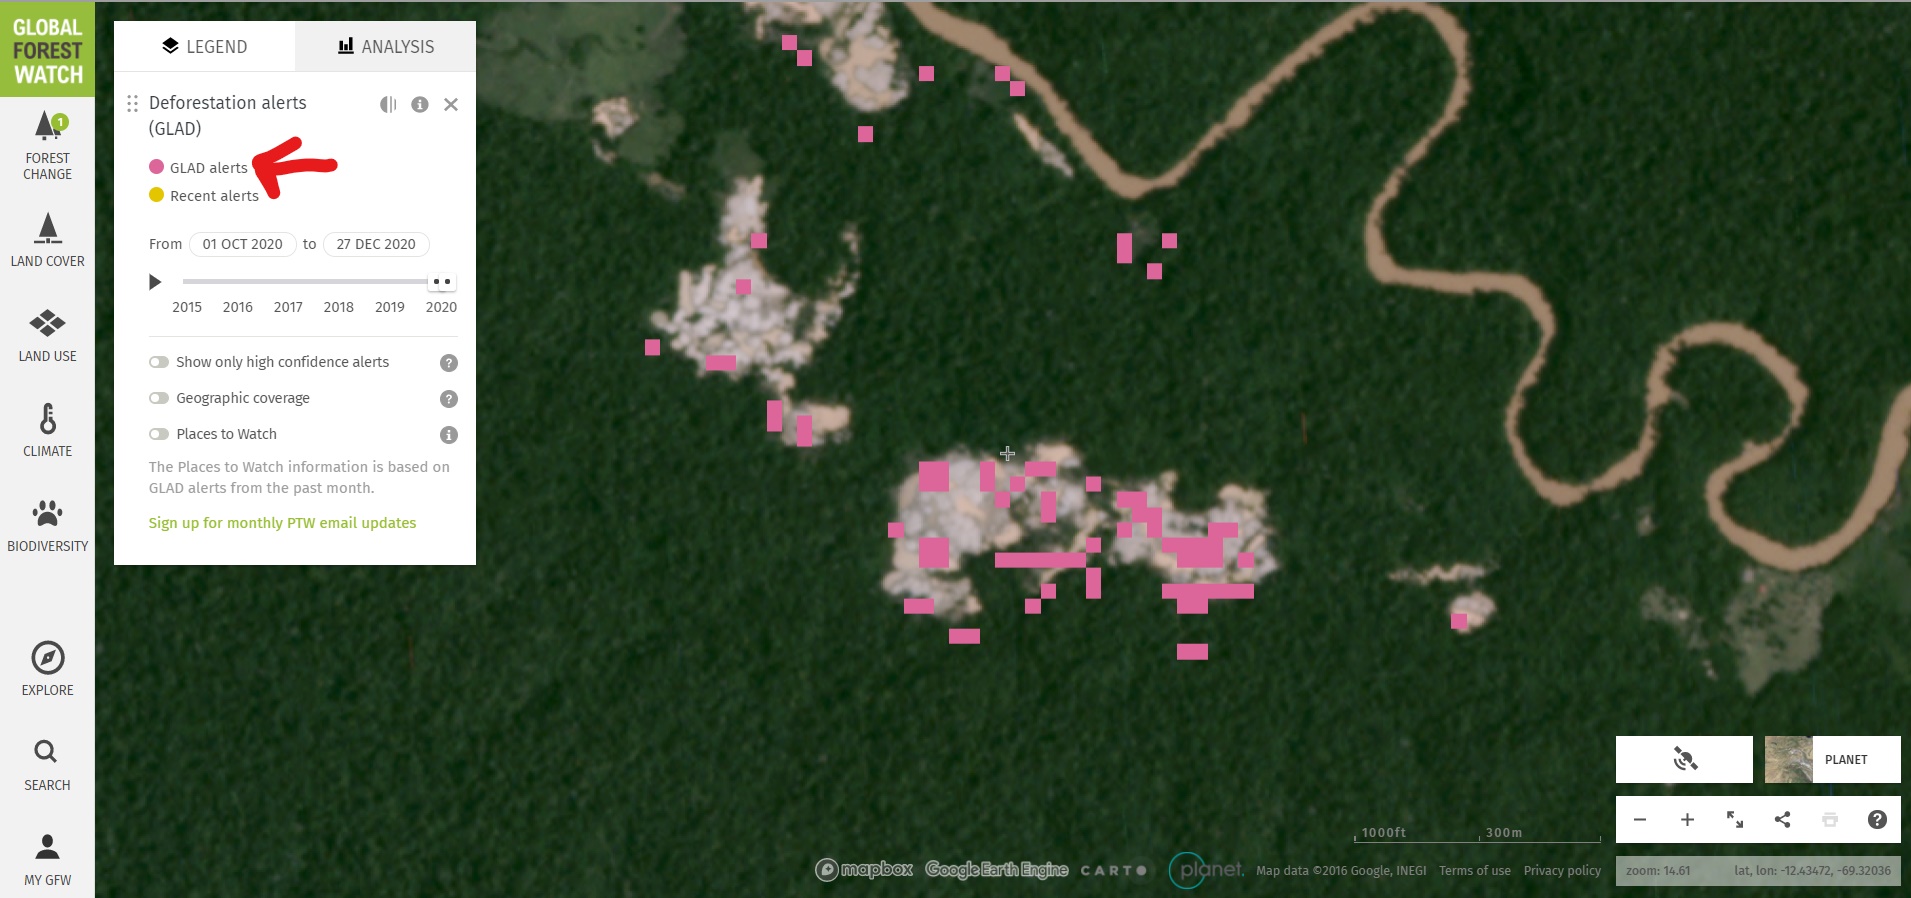
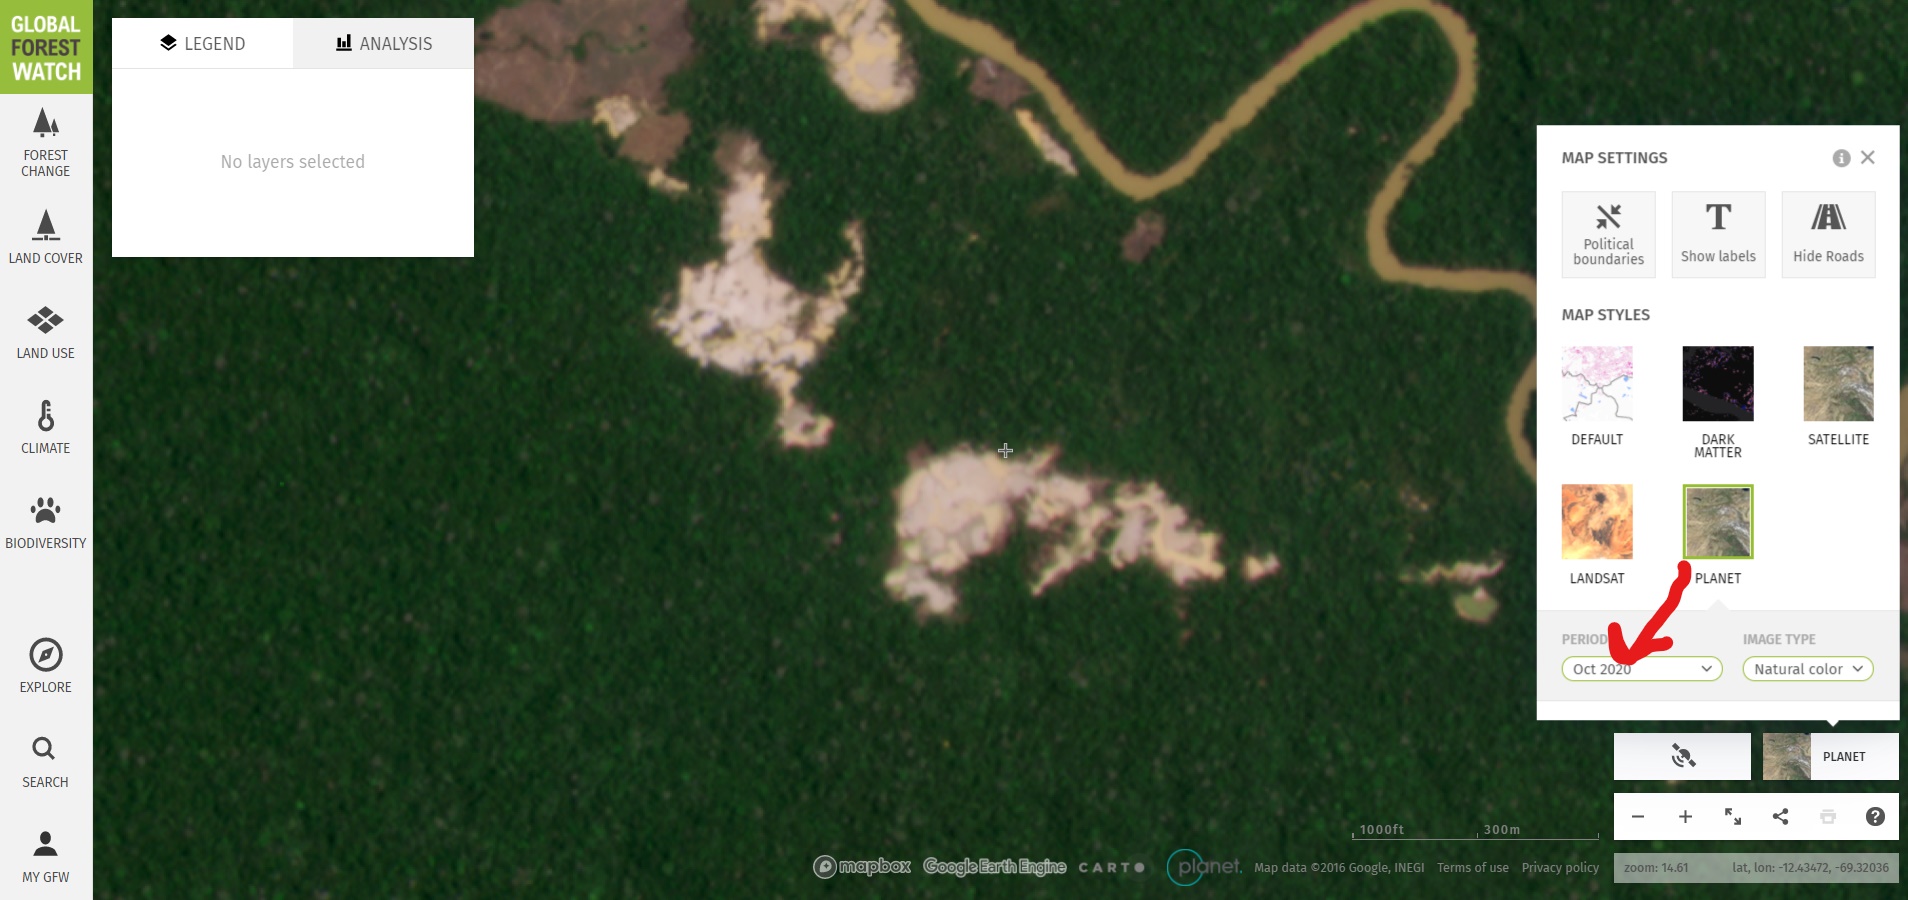
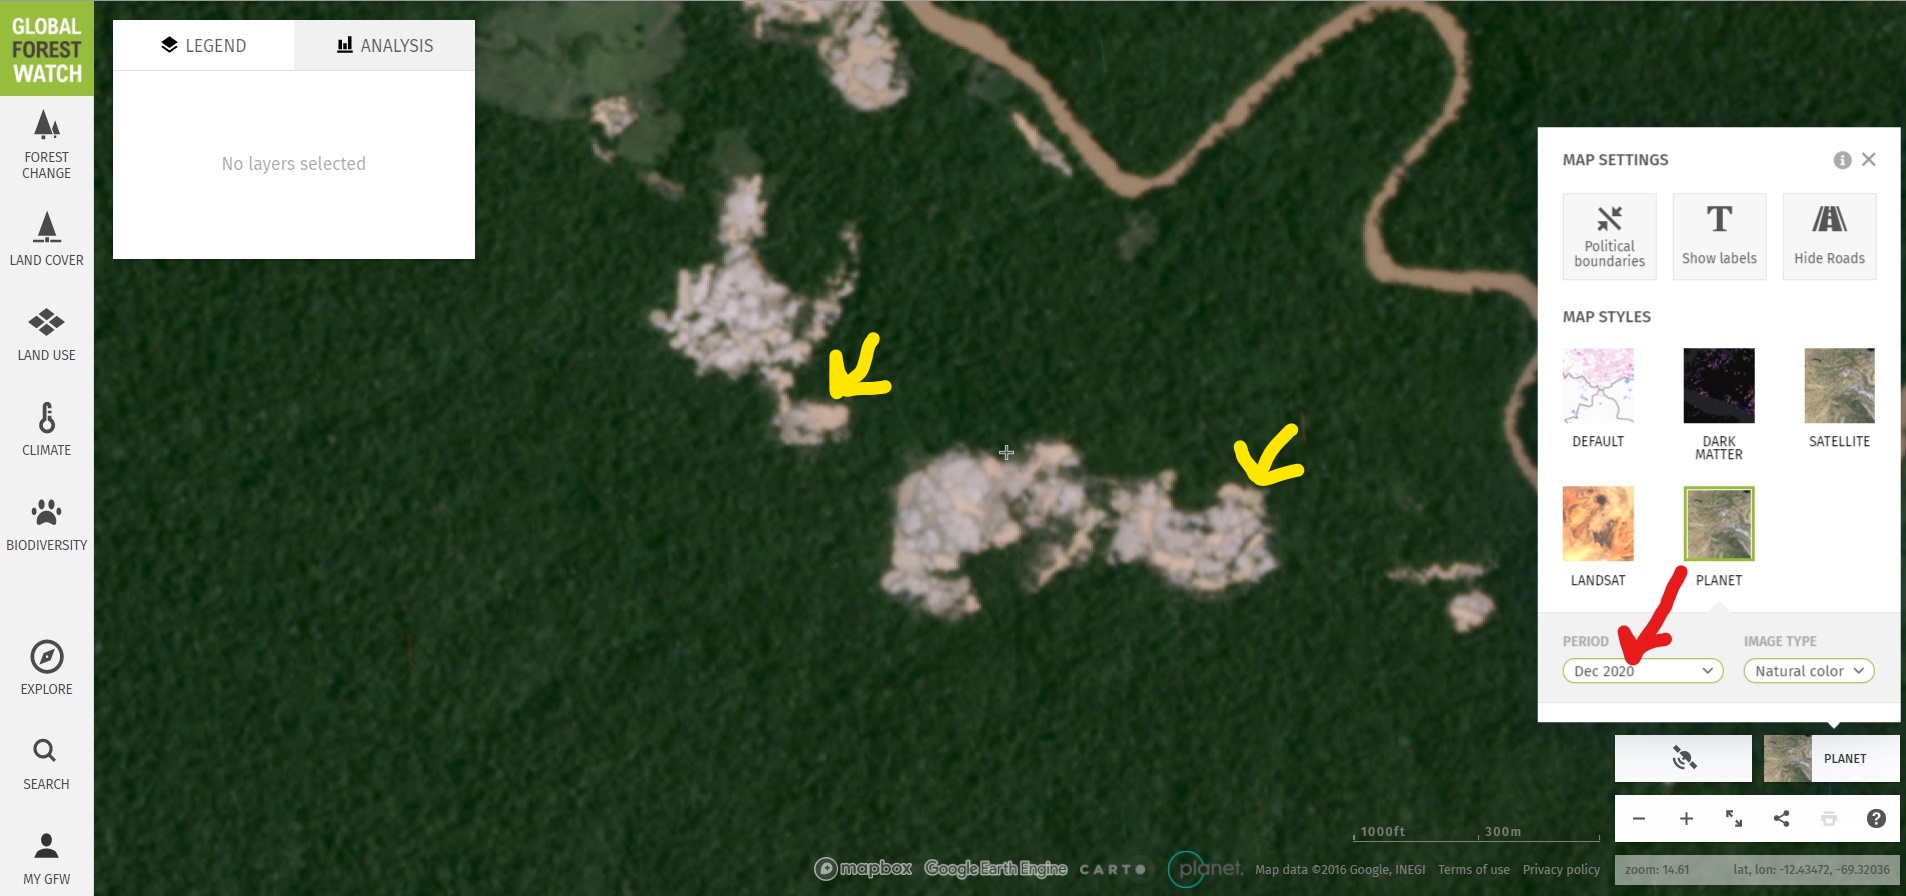
Similarly, we detected recent forest loss alerts in an illegal gold mining area in the southern Peruvian Amazon known as Pariamanu (Image 6). Images 7 & 8 show the monthly basemaps confirming the expansion of illegal mining deforestation between October and December (see yellow arrows). Global Forest Watch link here.

Image 6. Forest loss alerts in illegal gold mining zone (Pariamanu).
Image 7. Monthly Planet basemap for October 2020 in Pariamanu.
Image 8. Monthly Planet basemap for October 2020 in Pariamanu.

Ecuadorian Amazon

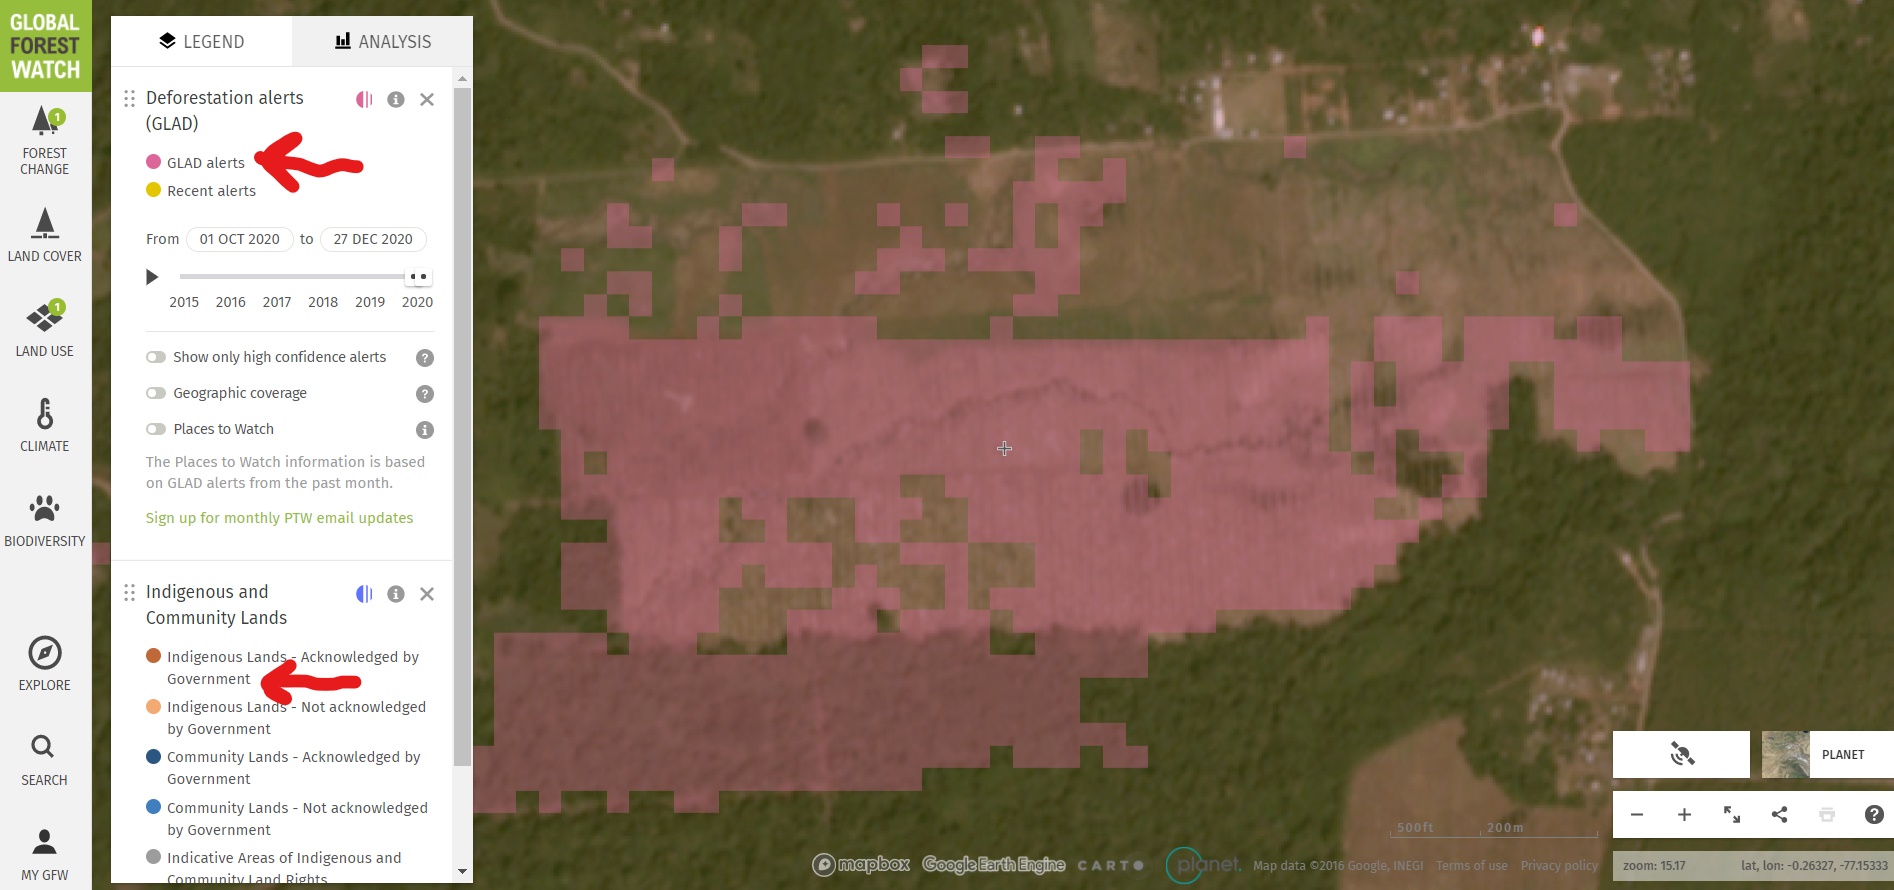
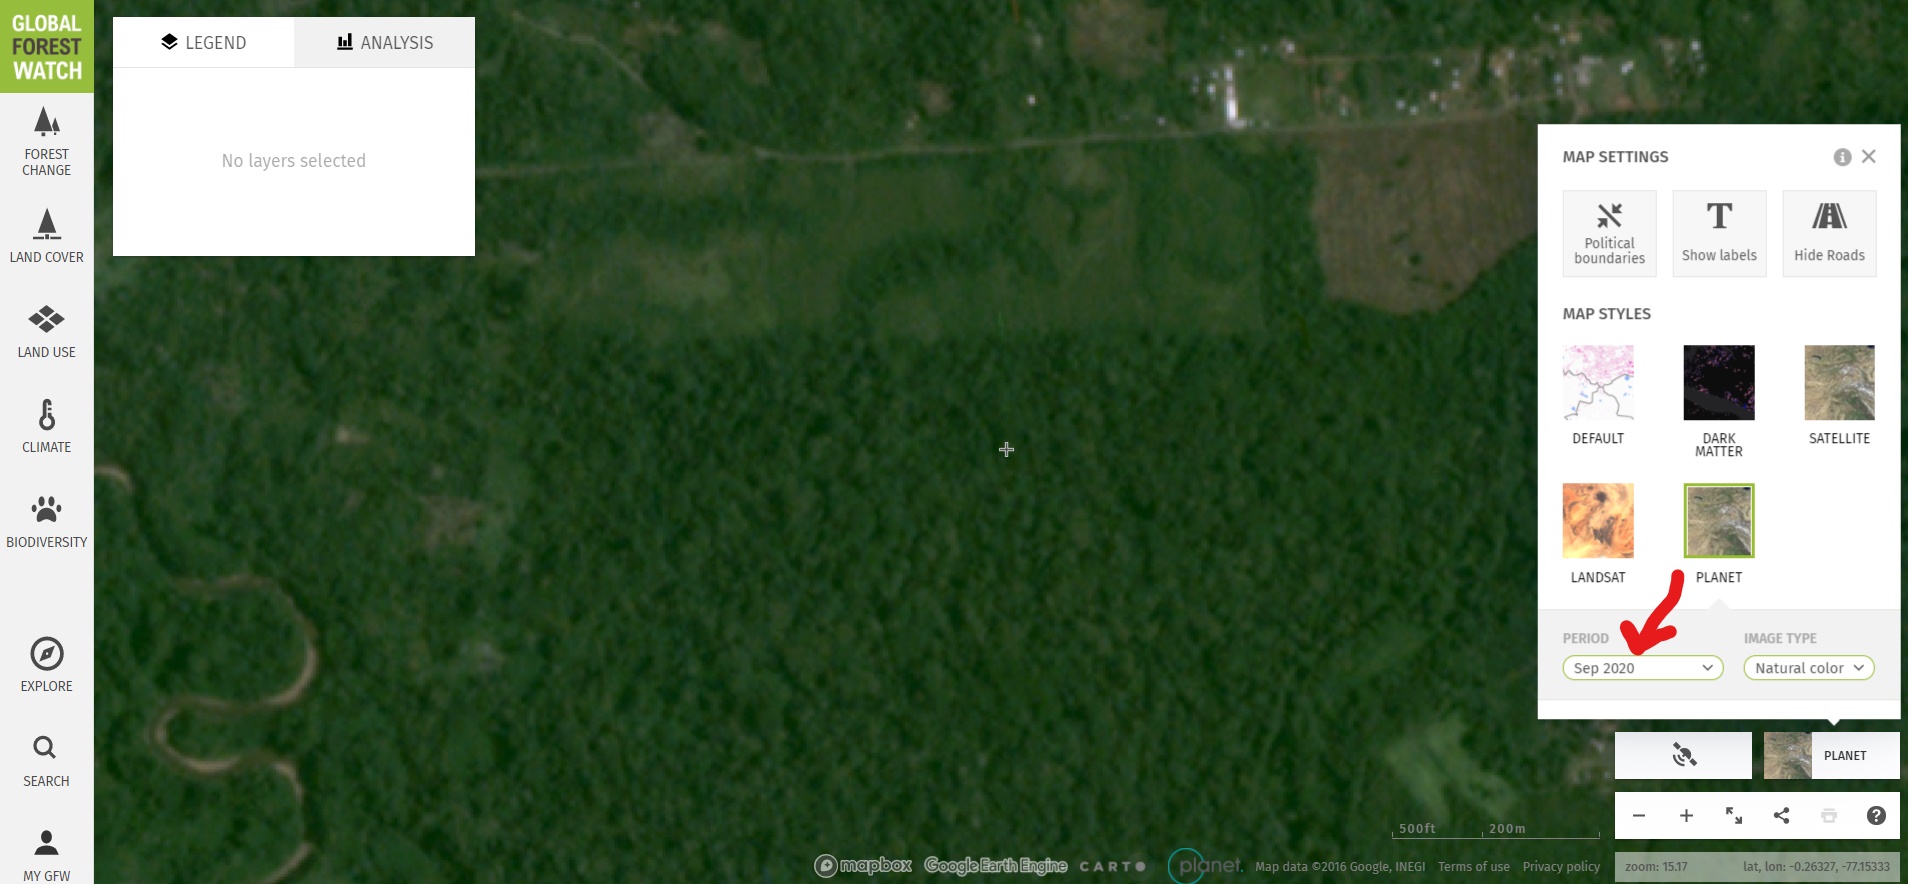
Finally, we detected recent forest loss alerts of 100 hectares in an indigenous territory (Kichwa) surrounding an oil palm plantation in the Ecuadorian Amazon (Image 9). Images 10 & 11 show the monthly basemaps confirming large-scale deforestation between September and December, likely for the expansion of the plantation. Note the crosshairs (+) represents the same point in all three images. Global Forest Watch link here.
Image 9. Forest loss alerts in the Ecuadorian Amazon.
Image 10. Monthly Planet basemap for September 2020 in Ecuadorian Amazon.
Image 11. Monthly Planet basemap for December 2020 in Ecuadorian Amazon.

Summary

In summary, we show a major advance for free and real-time deforestation monitoring thanks to an agreement between the Government of Norway and satellite companies.* A key aspect of this agreement is making publically available (such as on Global Forest Watch) monthly basemaps created by the innovative satellite company Planet. Thus, users can now freely visualize recent forest loss alerts and then investigate them with high-resolution monthly basemaps on On Global Forest Watch. MAAP illustrated this process with three examples in the Colombian, Peruvian, Ecuadorian Amazon, respectively.

*Notes 

In September 2020, Norway’s Ministry of Climate and Environment entered into a contract with Kongsberg Satellite Services (KSAT) and its partners Planet and Airbus, to provide universal access to high-resolution satellite monitoring of the tropics in order to support efforts to stop the destruction of the world’s rainforests. This effort is led by Norway’s International Climate and Forest Initiative (NICFI). The basemaps are mosaics of the best cloud-free pixels each month. In addition to viewing the monthly basemaps on Global Forest Watch, users can sign up with Planet directly at this link: https://www.planet.com/nicfi/

Acknowledgements

We thank M. Cohen (ACA), M. Weisse (WRI/GFW), E. Ortiz (AAF) and G. Palacios for their helpful comments on this report.

This work was supported by NORAD (Norwegian Agency for Development Cooperation).

Citation

Finer M, Mamani N (2020) Power of Freely Available, High-resolution Satellite Imagery from Norway Agreement. MAAP: 131.

MAAP #130: Illegal Gold Mining Down 78% in Peruvian Amazon, But Still Threatens Key Areas

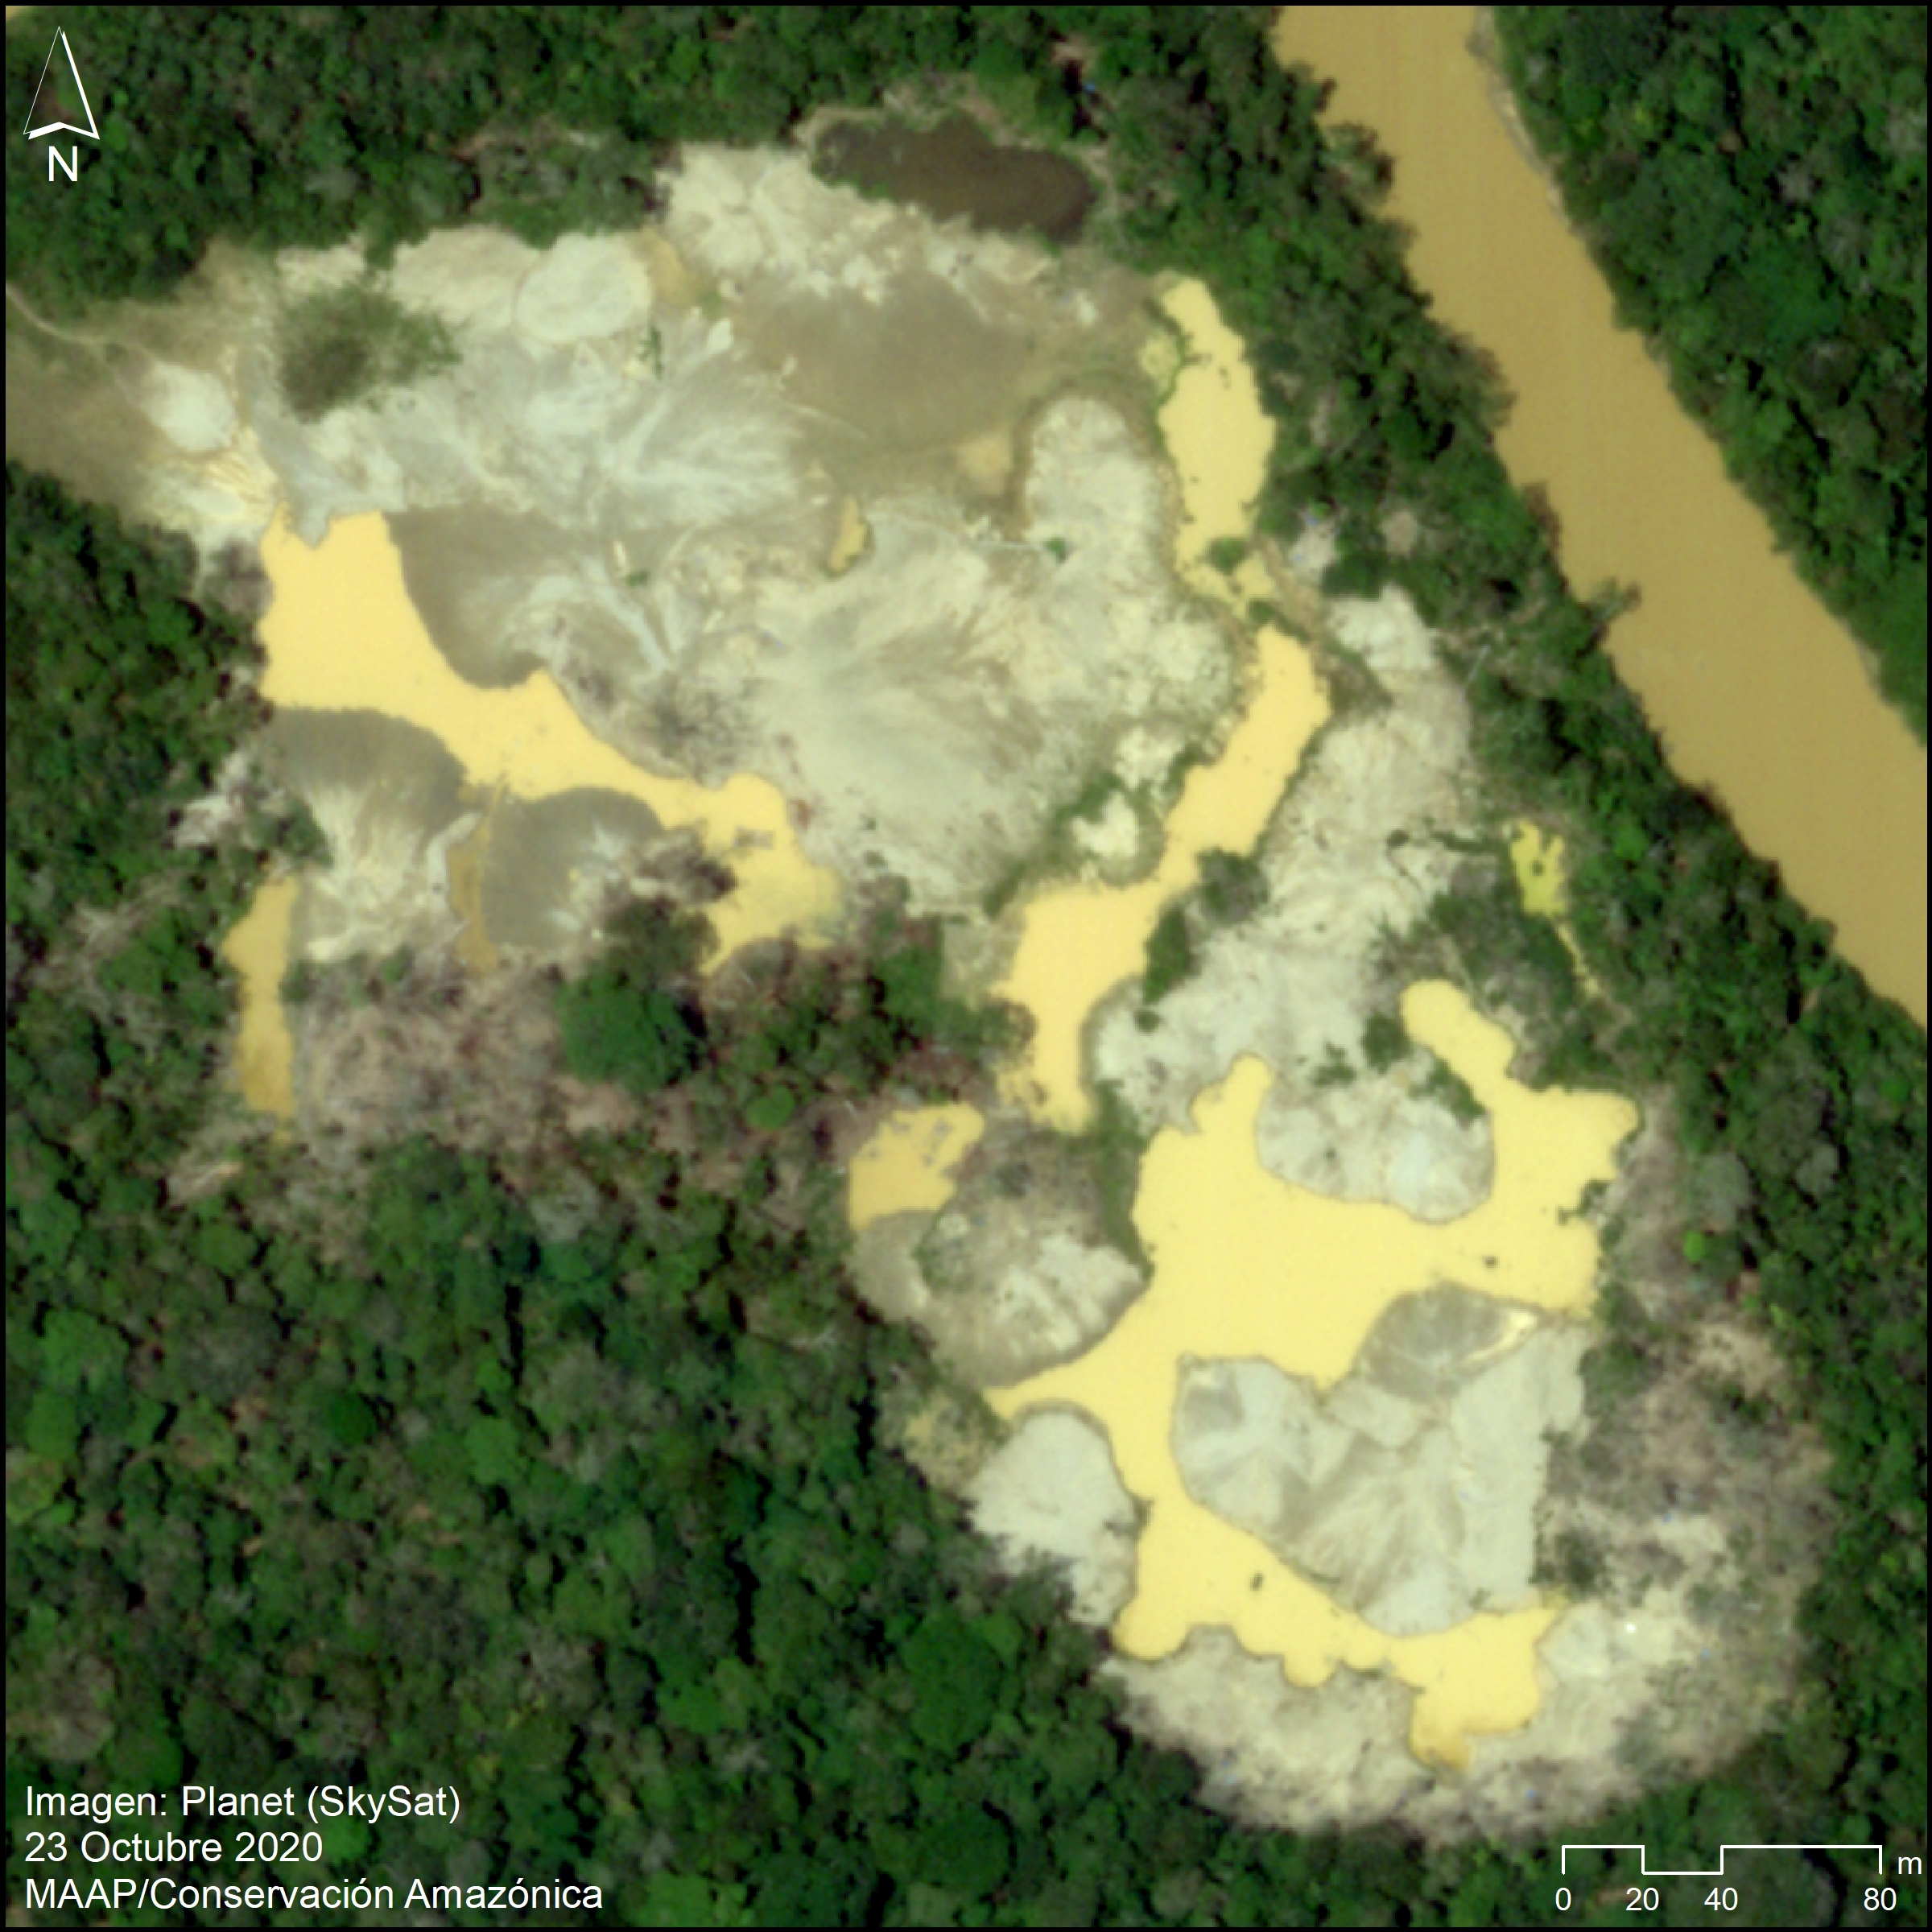
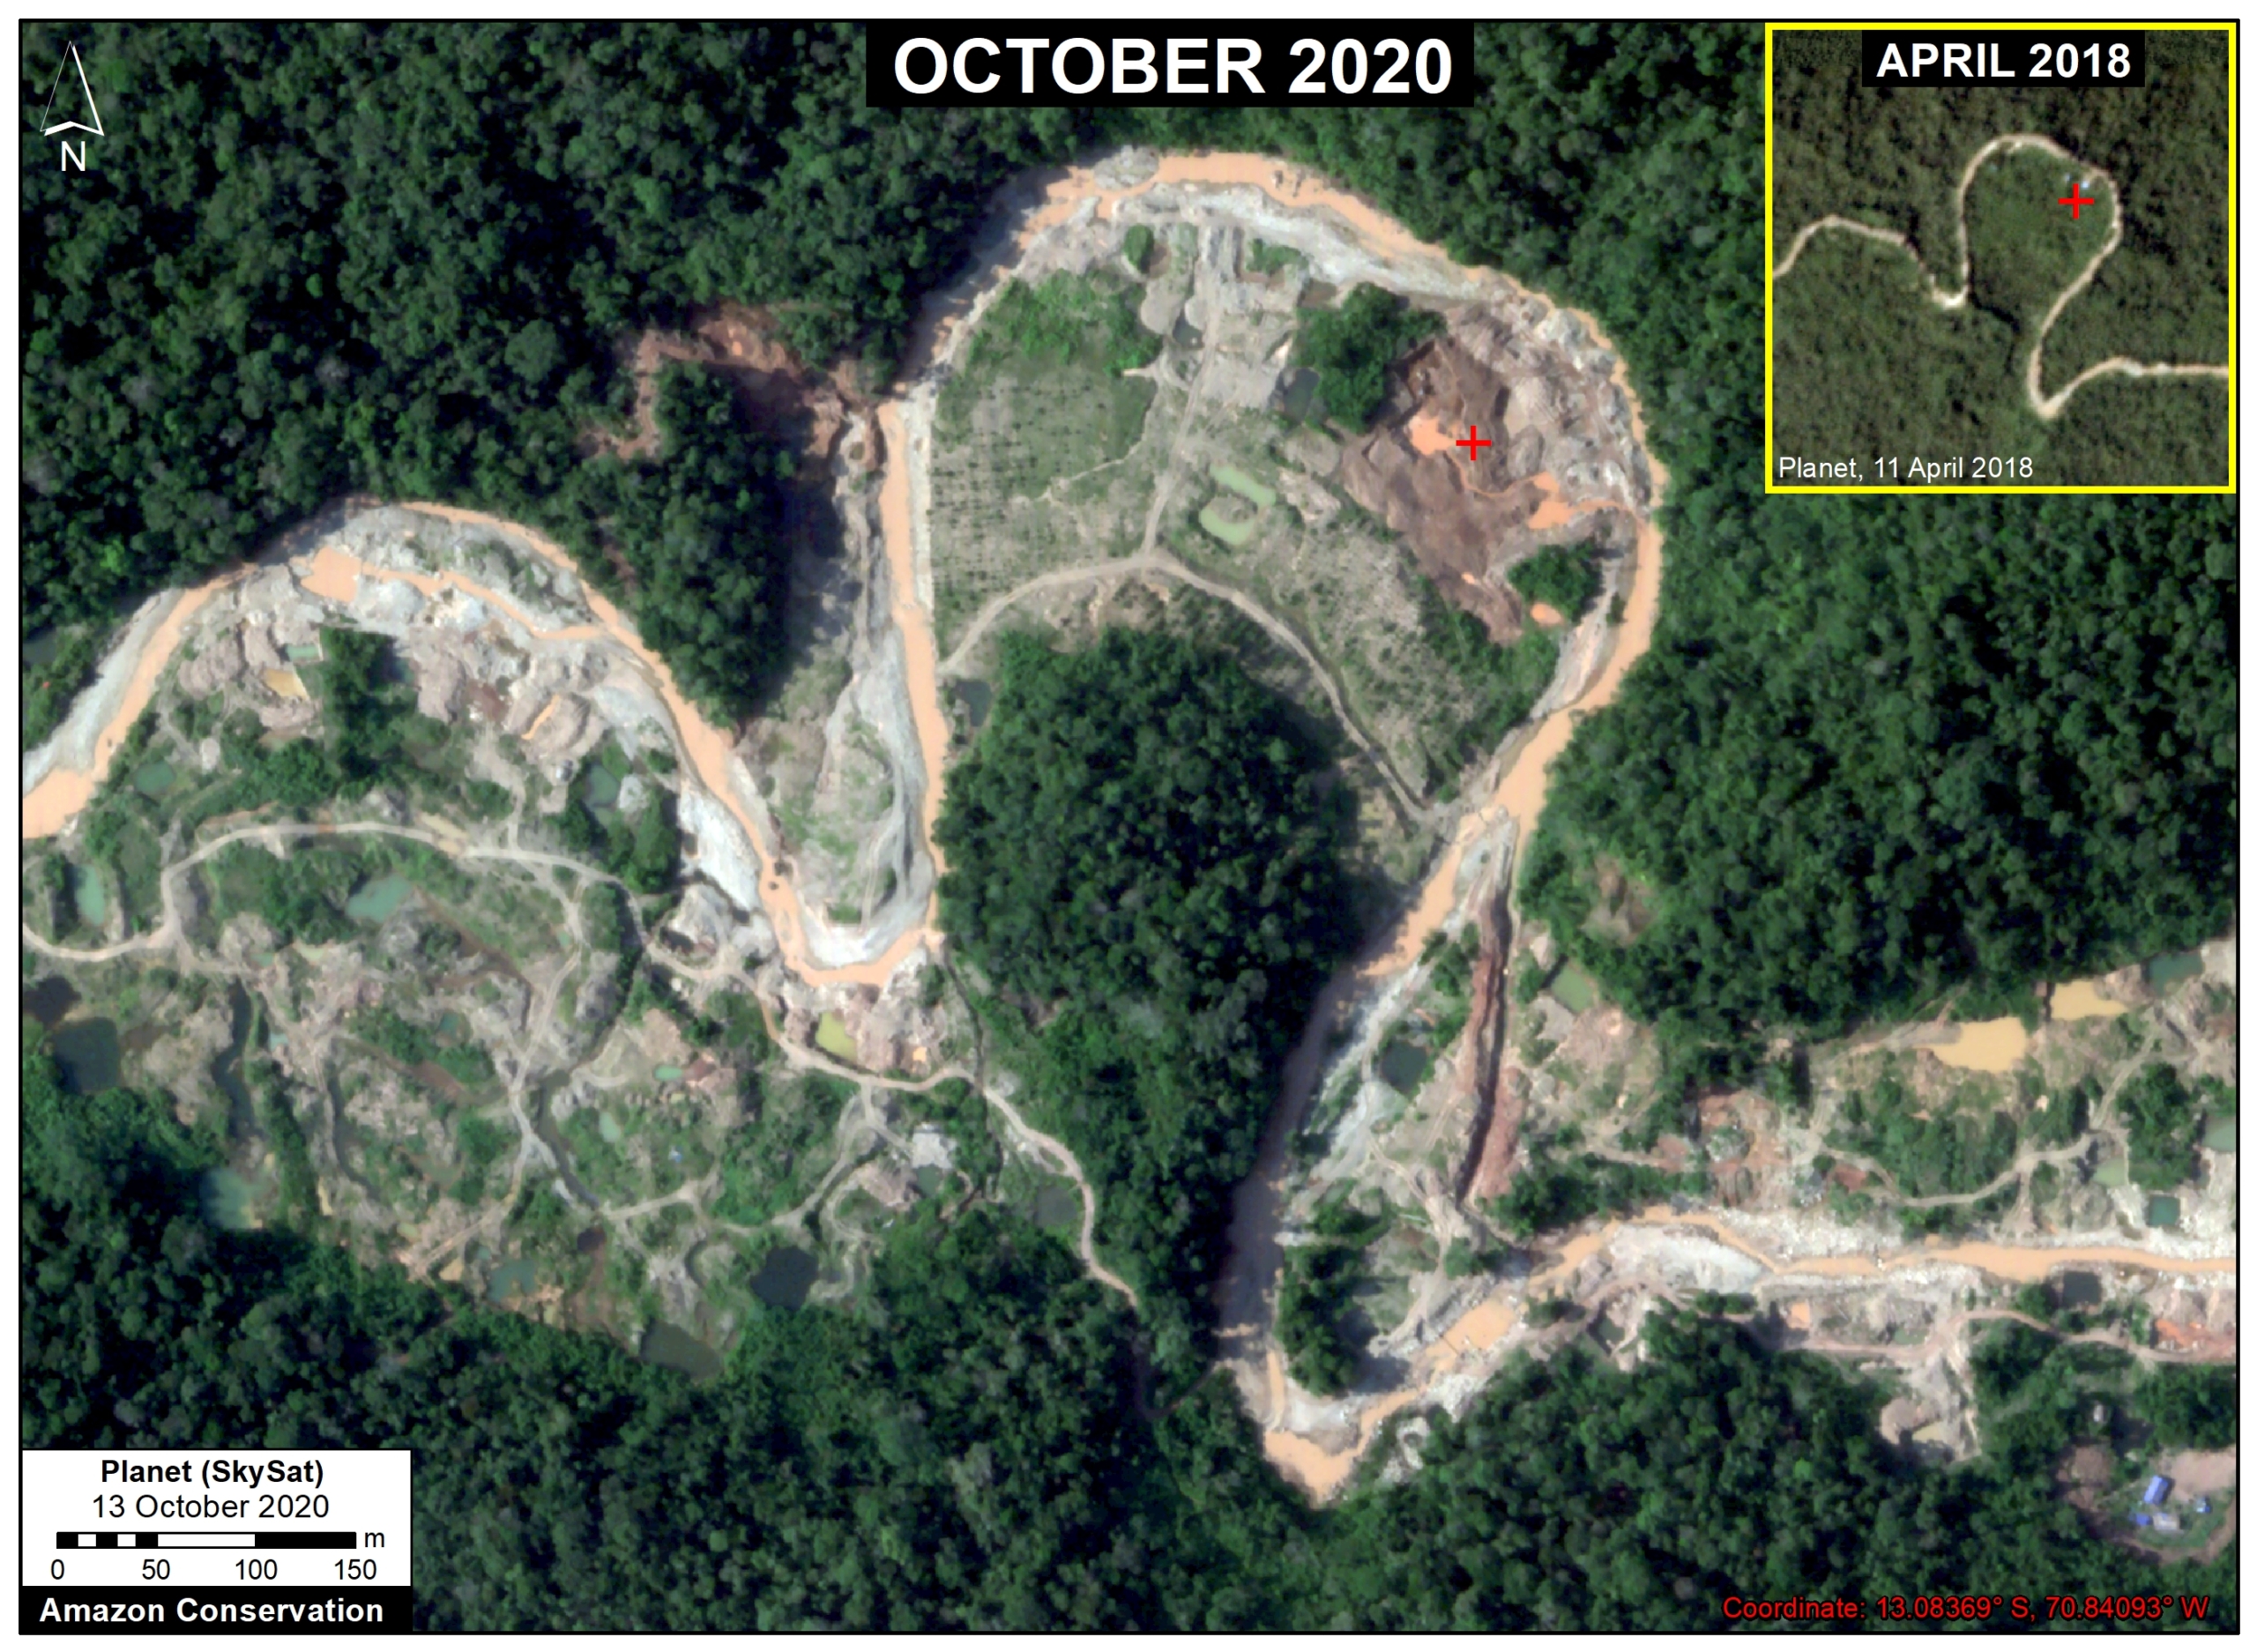
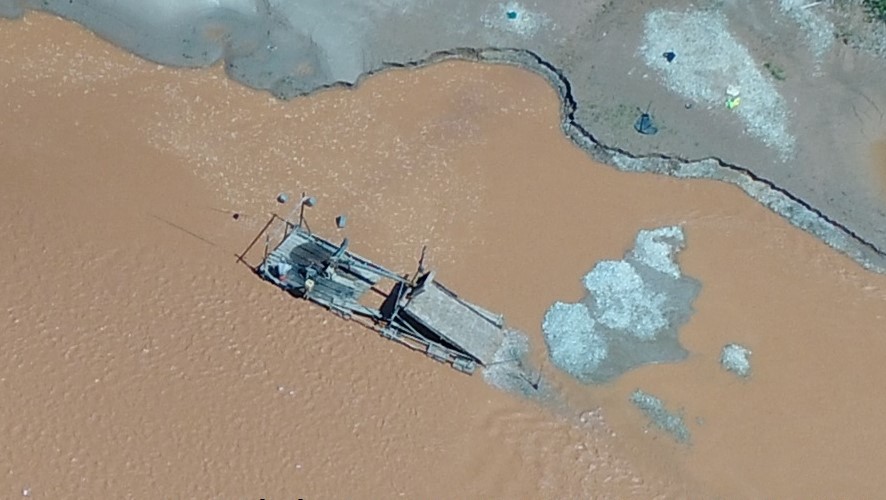
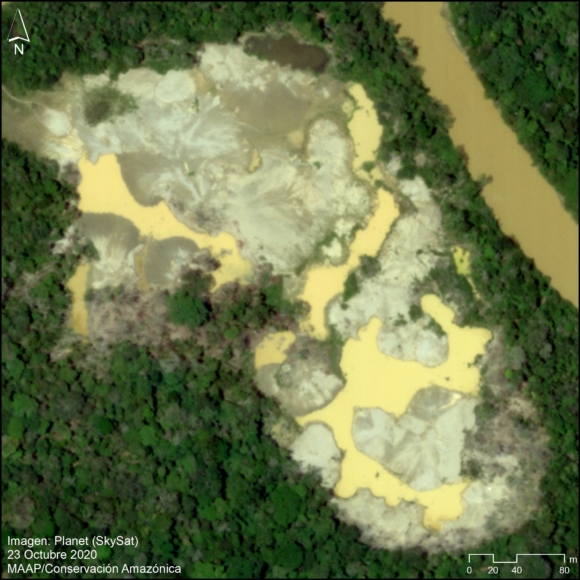
Image 1. Very high resolution image of recent gold mining deforestation along the Pariamanu River. Data: Planet (Skysat).

As part of USAID’s Prevent Project (dedicated to combating environmental crimes in the Amazon), we conducted an updated analysis of illegal gold mining deforestation in the southern Peruvian Amazon.

In early 2019, the Peruvian government launched Operation Mercury, an unprecedented crackdown on the rampant illegal gold mining in the region.

The Operation initially targeted an area known as La Pampa, the epicenter of the illegal mining. In 2020, it expanded to surrounding critical areas.

In this report, we compare rates of gold mining deforestation before vs after Operation Mercury at six key sites (see Base Map and Methodology below).

We report four major results:

1) Gold mining deforestation decreased 90% in La Pampa (the most critical mining area) following Operation Mercury.

2) Gold mining deforestation increased in three key areas –Apaylon, Pariamanu, and Chaspa – indicating that some miners expelled from La Pampa moved to surrounding areas. The Peruvian government, however, has recently carried out major interventions in all three of these areas.

3) Overall, gold mining deforestation decreased 78% across all six sites following Operation Mercury.

4) Illegal mining does persist, however. We documented 1,115 hectares of gold mining deforestation across all six sites since Operation Mercury (but, compared to 6,490 hectares before the Operation).

Below, we provide a more detailed breakdown of the major results across all six sites. We also present a series of very high resolution satellite images (Skysat) of the recent gold mining deforestation.

Base Map – 6 Major Illegal Gold Mining Sites

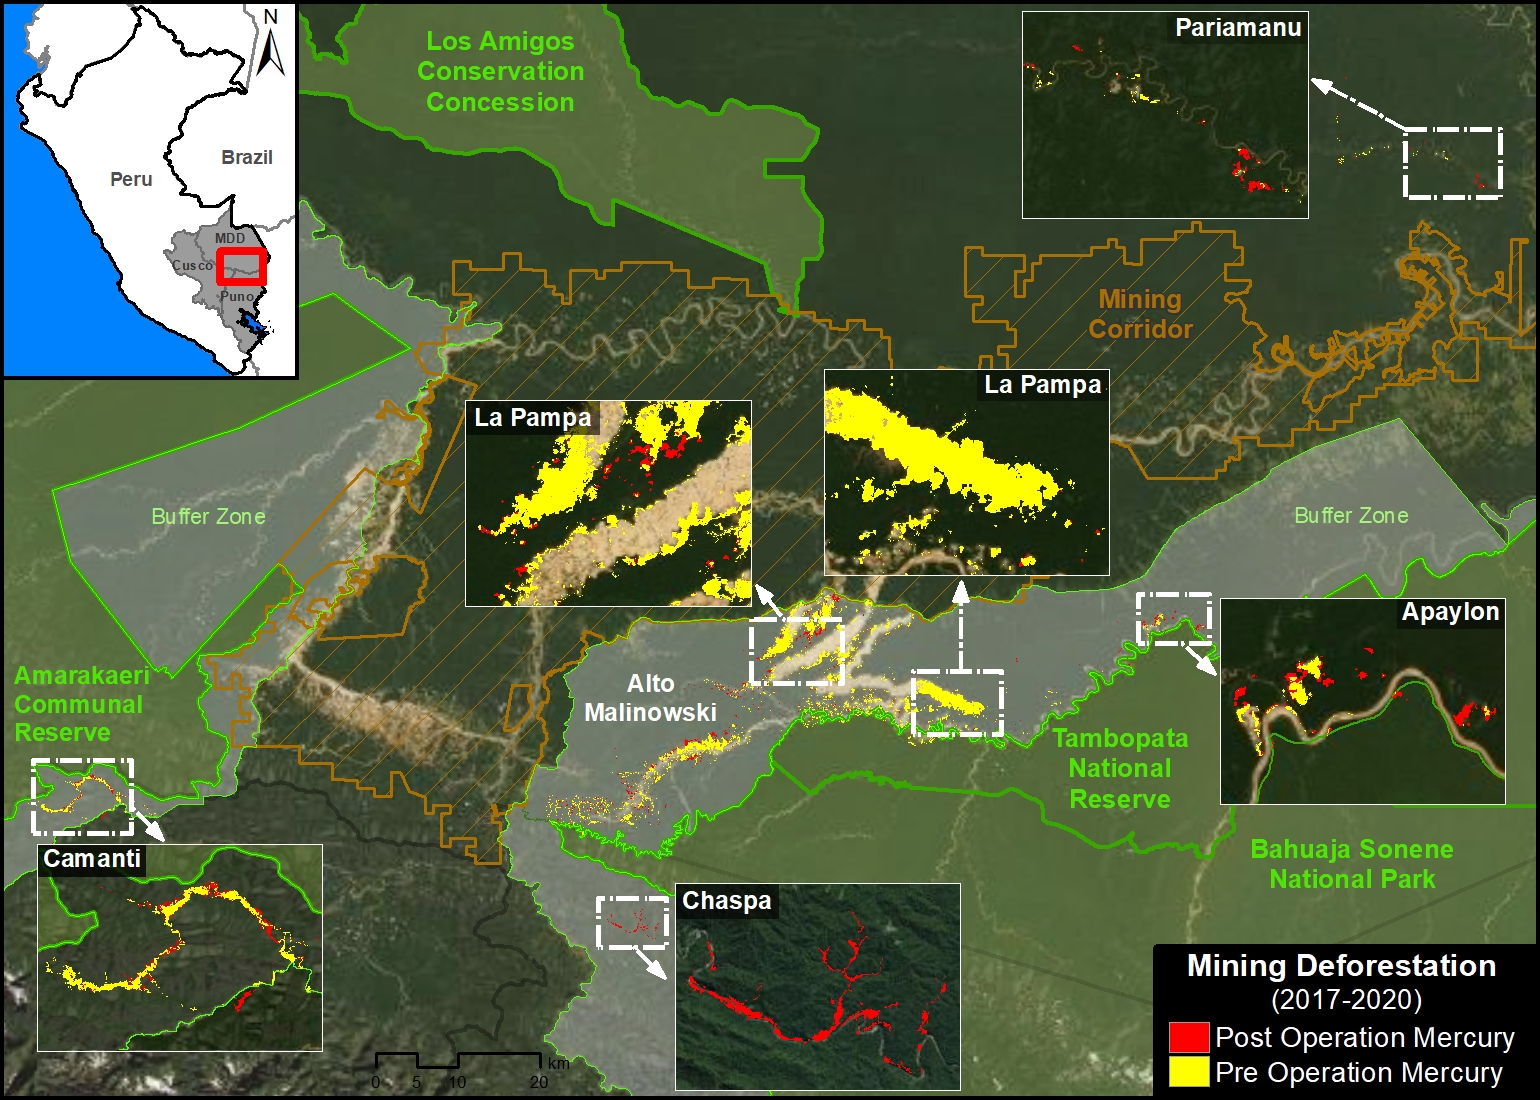
The Base Map illustrates the results across the six major gold mining fronts in the southern Peruvian Amazon. Red indicates gold mining deforestation post Operation Mercury (March 2019 – October 2020), while yellow indicates the pre Operation baseline (January 2017 – February 2019).
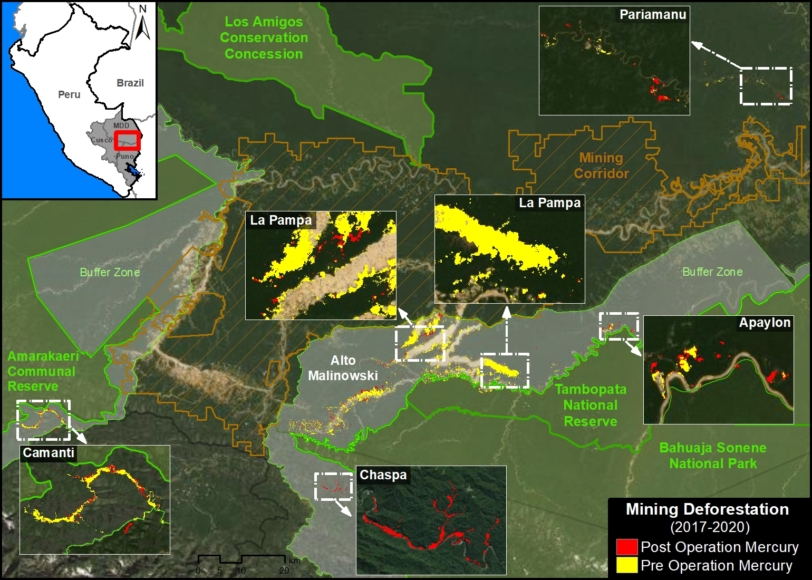
Base Map. Major gold mining fronts in the southern Peruvian Amazon before (yellow) and after (red) Operation Mercury. Data: MAAP.

In La Pampa, we documented the dramatic loss of 4,450 hectares within the buffer zone of Tambopata National Reserve (Madre de Dios region) prior to Operation Mercury. Following the Operation, we confirmed the loss of 300 hectares. Note the main mining front in the core of the buffer zone has essentially been stopped, with most recent activity further north near the Interoceanic Highway.

In neighboring Alto Malinowski, located in the buffer zone of Bahuaja Sonene National Park (Madre de Dios region), we documented the loss of 1,558 hectares prior to Operation Mercury. Following the Operation, we confirmed the loss of 419 hectares.

In Camanti, located in the buffer zone of Amarakaeri Commuanl Reserve, we documented the loss of 336 hectares prior to Operation Mercury. Following the Operation, we confirmed the loss of 105 hectares.

In Pariamanu, located in the primary forests along the Pariamanu River (Madre de Dios region), we documented the loss of 72 hectares prior to Operation Mercury. Following the Operation, we confirmed the loss of 98 hectares. In response, the government conducted a major intervention in August 2020.

In Apaylon, located in the buffer zone Tambopata National Reserve (Madre de Dios region), we documented the loss of 73 hectares prior to Operation Mercury. Following the Operation, we confirmed the loss of 78 hectares. In response, the government has conducted a series of interventions in the area during 2020.

Chaspa, located in the buffer zone of Bahuaja Sonene National Park (Puno region), represents a unique case of a new gold mining front that appeared following Operation Mercury. Starting in September 2019, we documented the deforestation of 113 hectares impacting the Chaspa River watershed. In response, the government conducted a major intervention in October 2020.

Gold Mining Deforestation Trends

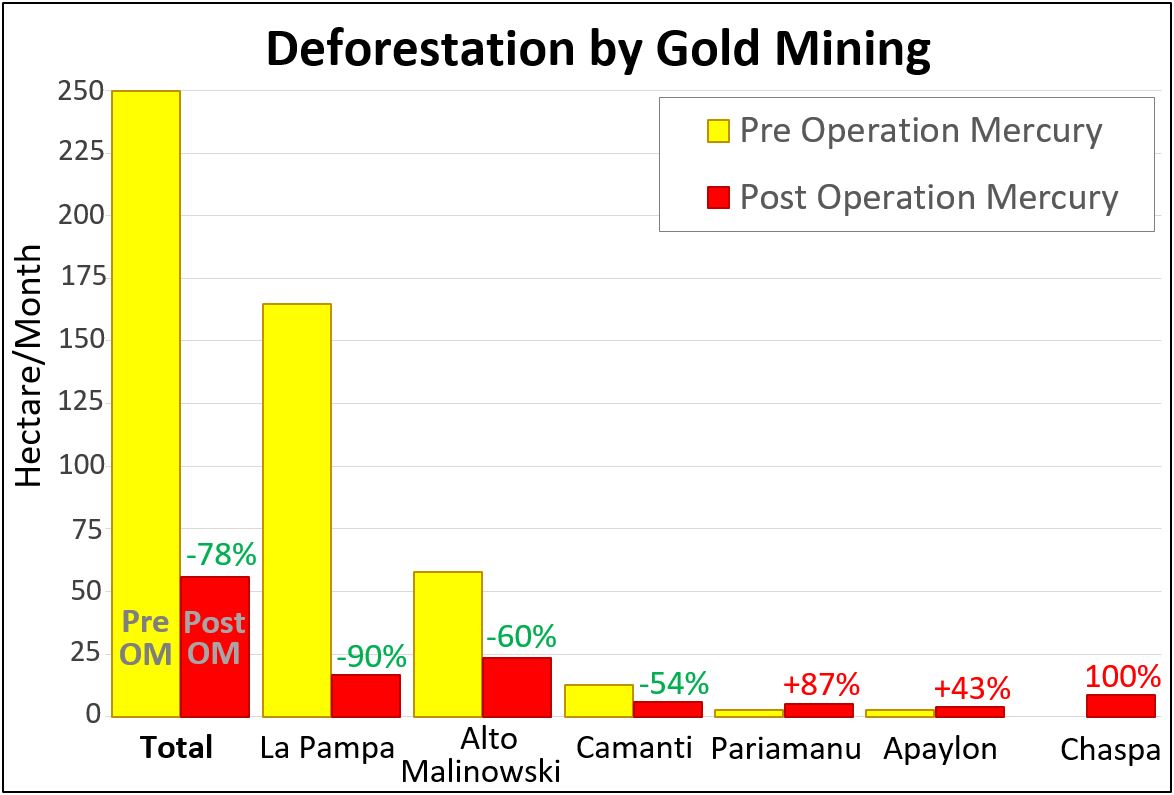
The following chart illustrates that gold mining deforestation fronts decreased following Operation Mercury in the three largest fronts (La Pampa, Alto Malinowski, and Camanti), and increased in three smaller areas (Pariamanu, Apaylon, and Chaspa). Thus, overall gold mining deforestation decreased 78% across all six major sites following Operation Mercury.
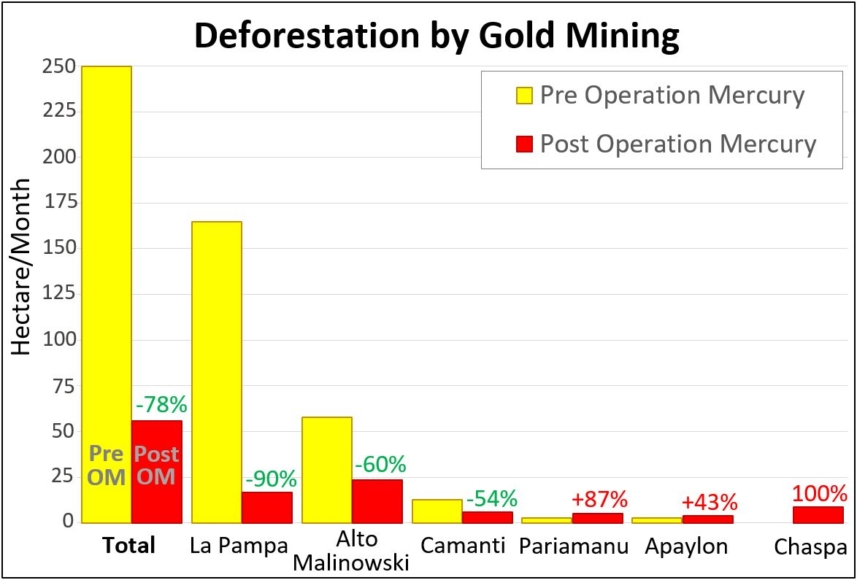
Table 1. Rates of gold mining deforestation before (orange) and after (red) Operation Mercury. Data: MAAP.

In La Pampa, the gold mining deforestation averaged 165 hectares per month prior to Operation Mercury. Following the Operation, the deforestation dropped to 17 hectares per month, an overall 90% decrease.

In Alto Malinowski, the gold mining deforestation dropped from 58 hectares per month to 23 hectares per month following Operation Mercury, an overall 60% decrease.

In Camanti, the gold mining deforestation dropped from 12.5 hectares per month to 6 hectares per month following Operation Mercury, an overall 54% decrease.

In Pariamanu, the gold mining deforestation increased from 2.8 hectares per month to 5 hectares per month following Operation Mercury, an overall 87% increase.

In Apaylon, the gold mining deforestation increased from 2.8 hectares per month to 4 hectares per month following Operation Mercury, an overall 43% increase.

Chaspa, located in the buffer zone of Bahuaja Sonene National Park, represents the unique case of a new gold mining front that appeared following Operation Mercury (8.5 hectares per month).

Very High Resolution Satellite Imagery (Skysat)

We recently tasked very high resolution satellite imagery (Skysat, 0.5 meter) for the major illegal gold mining areas. Below, we present a series showing some of the highlights from these images. Note that insets (in the upper corner of each image) show the same area before the mining activity (see red points as a reference).

Pariamanu

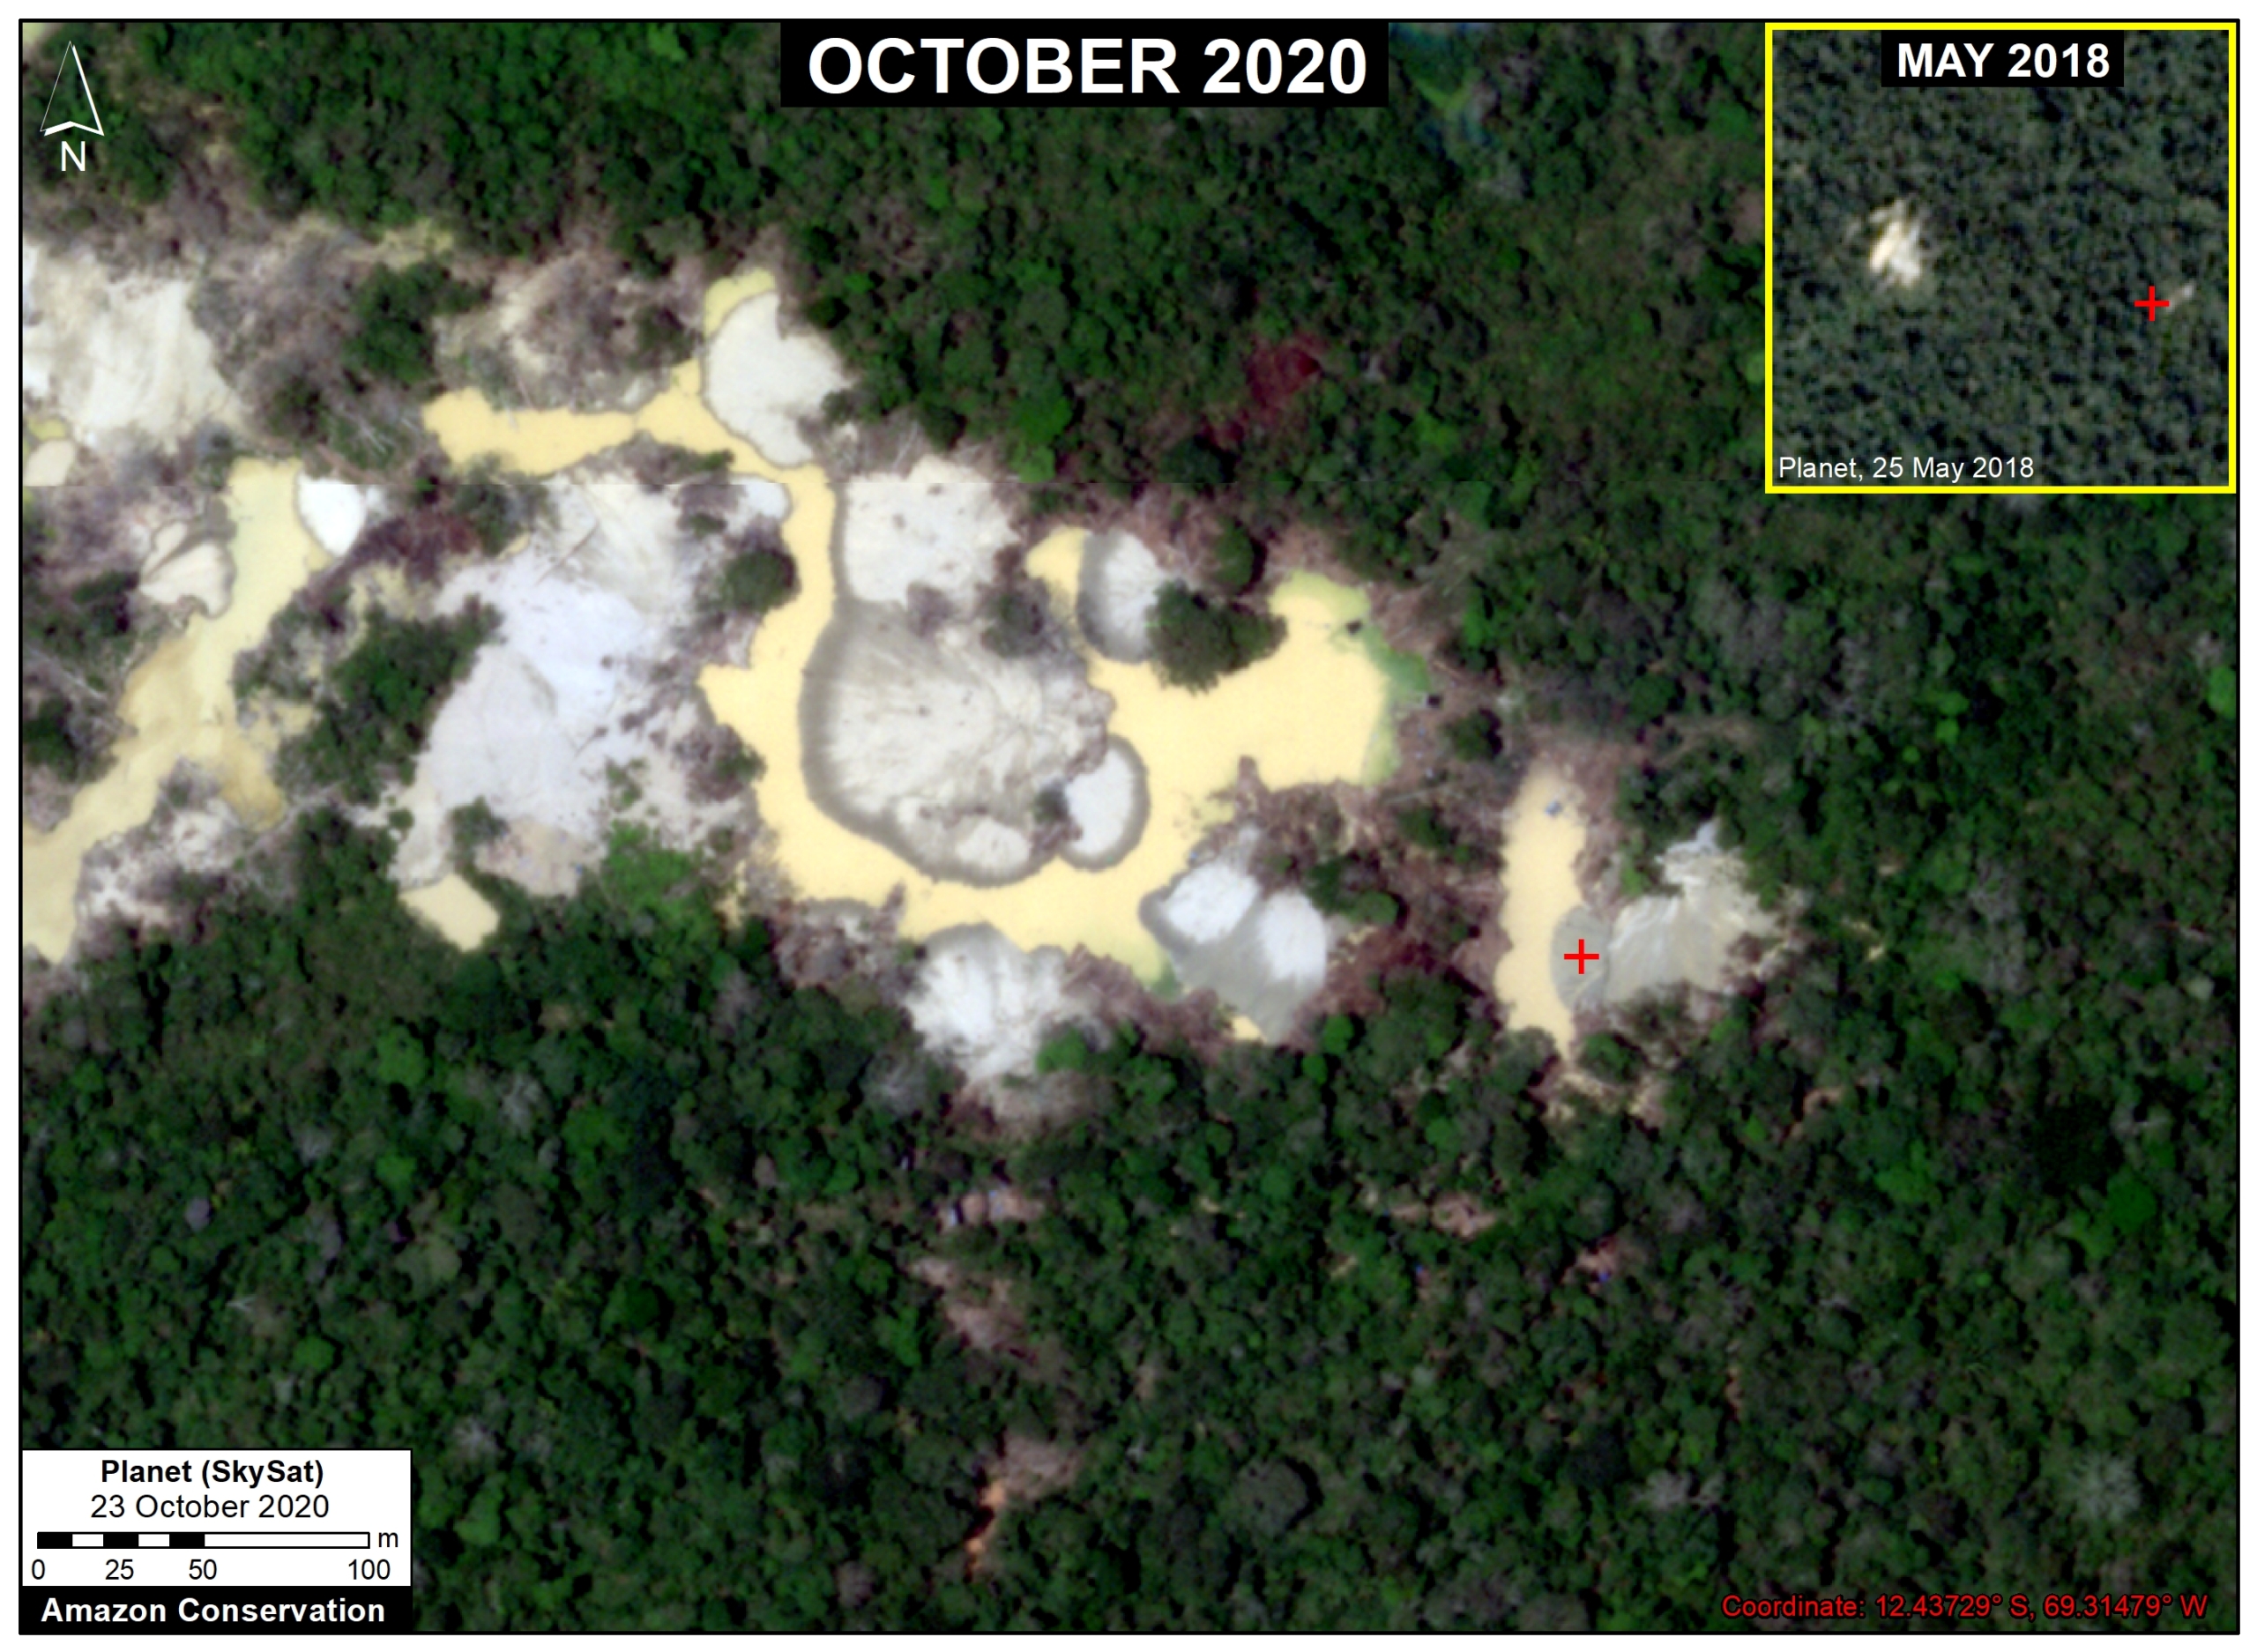
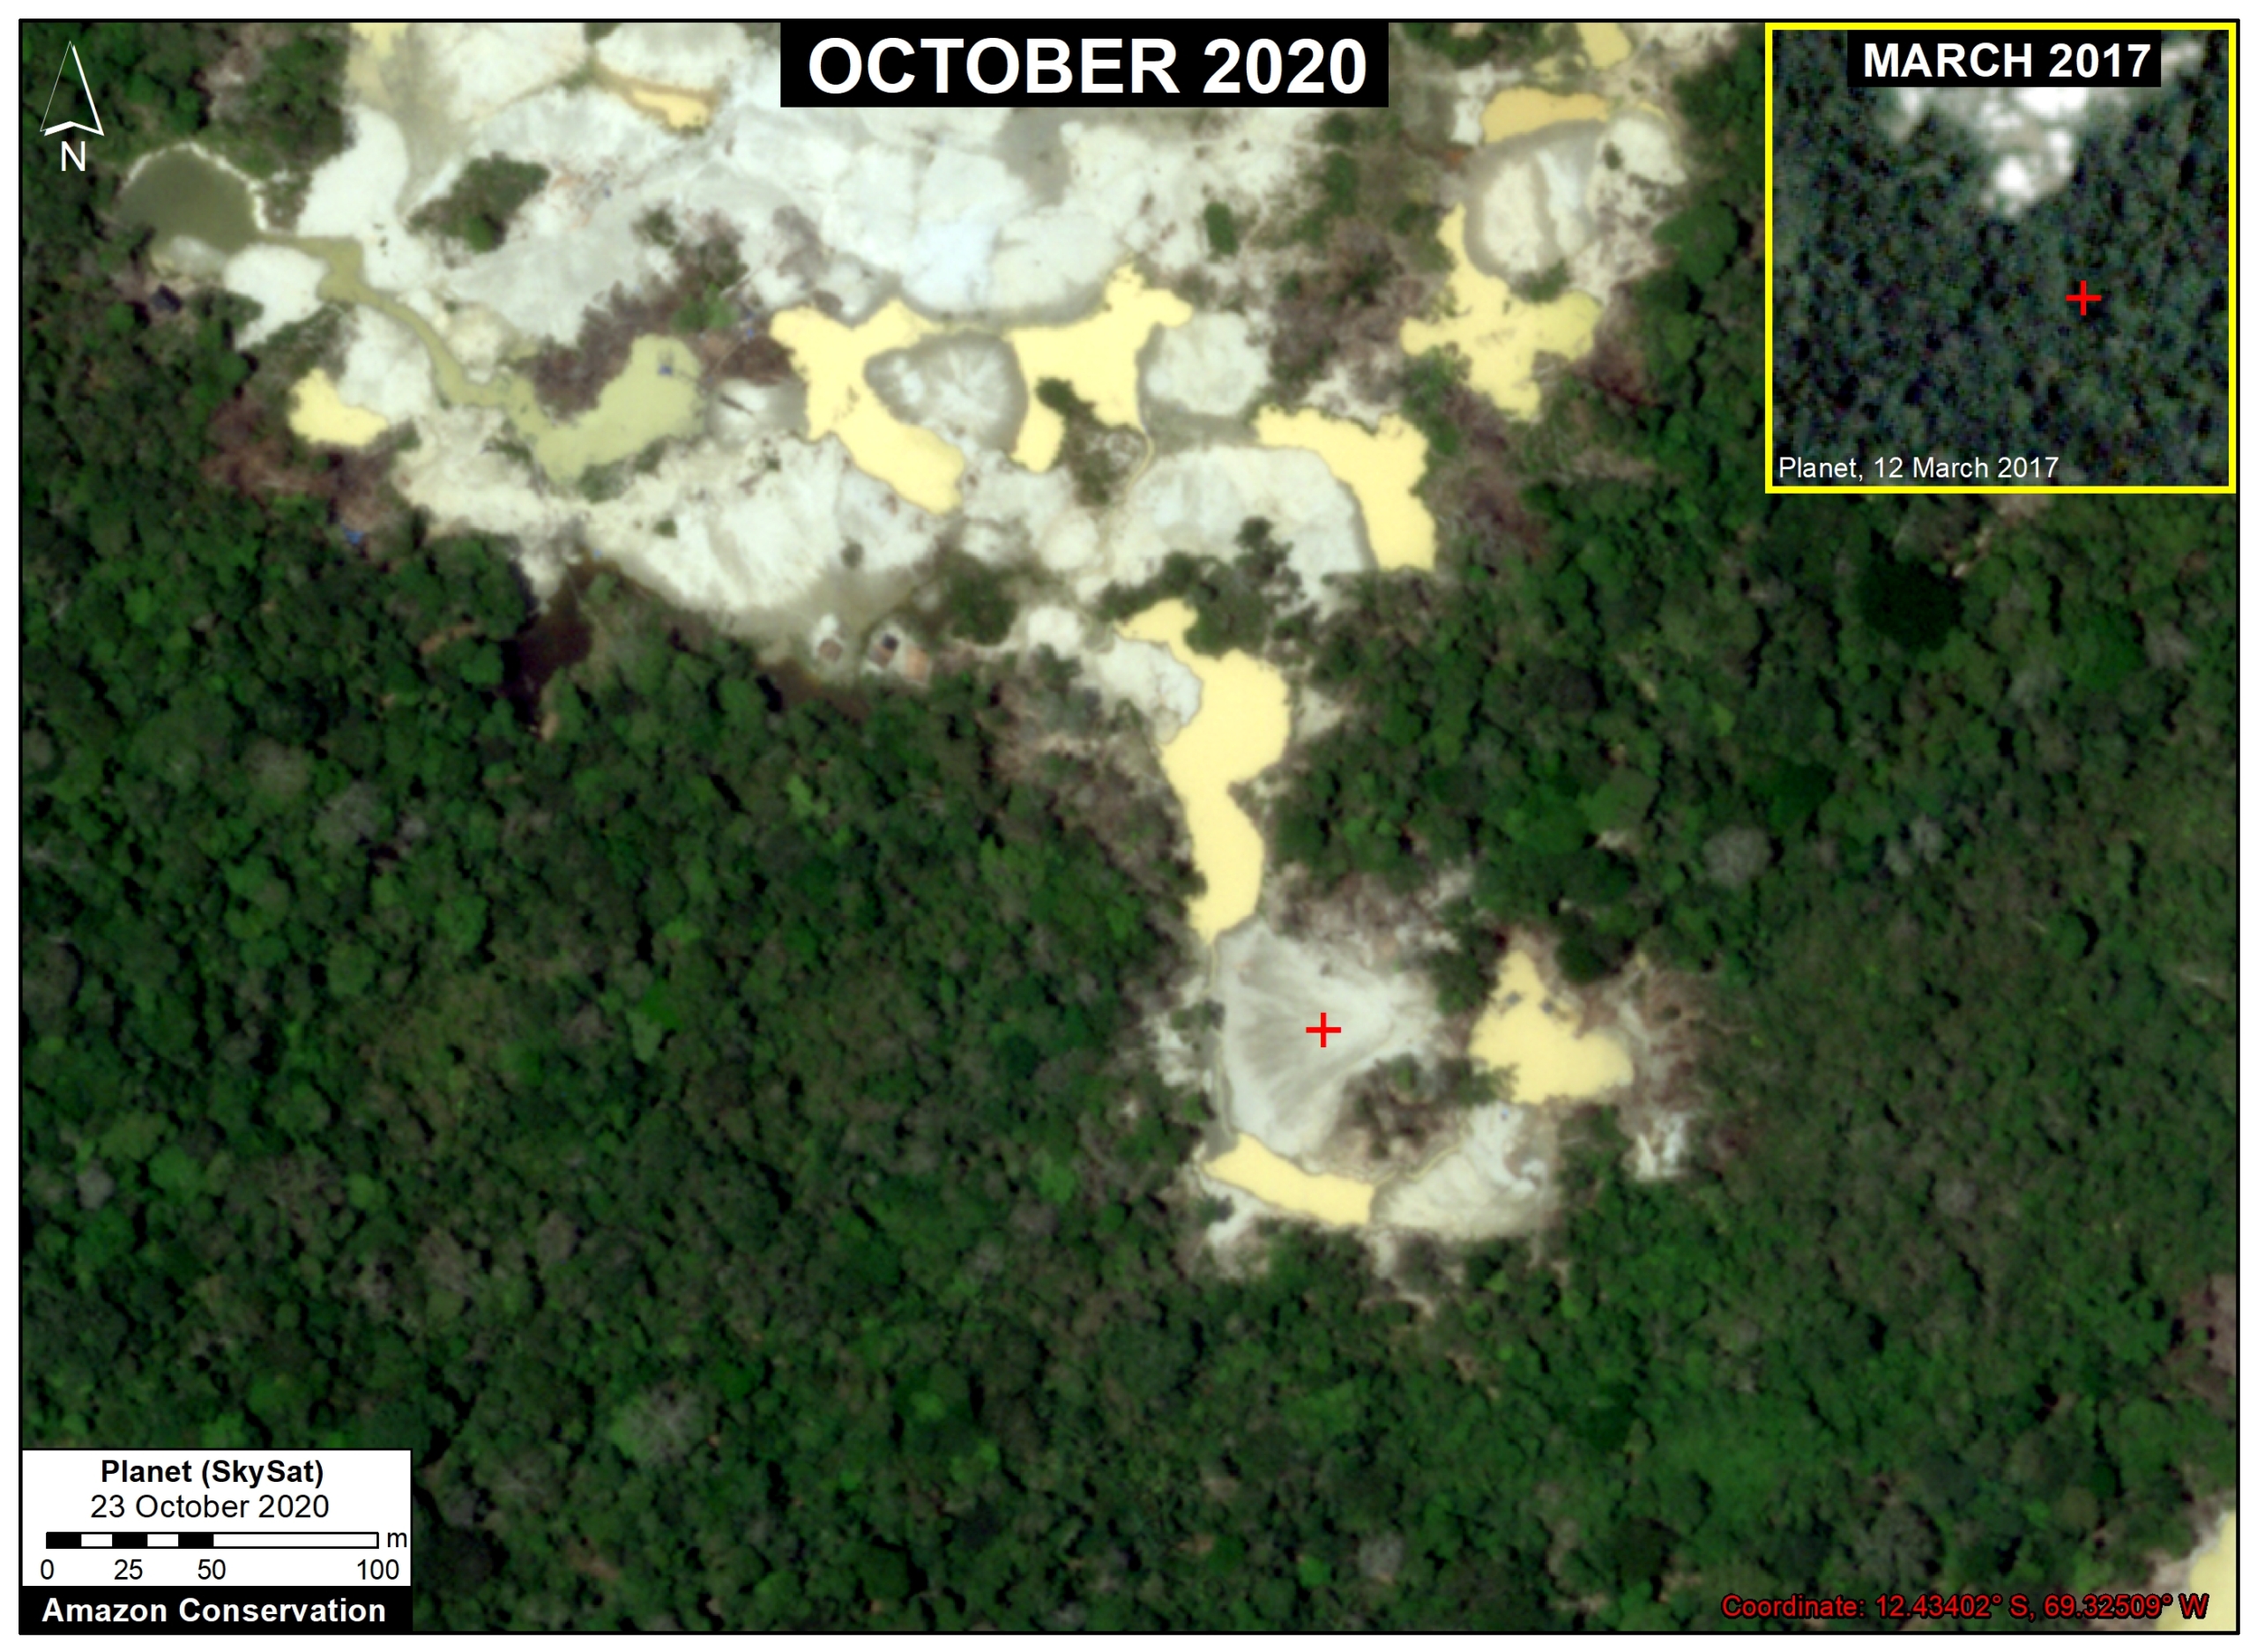
The following two images show the expansion of new gold mining areas into the primary rainforests near the Pariamanu River (Madre de Dios region).
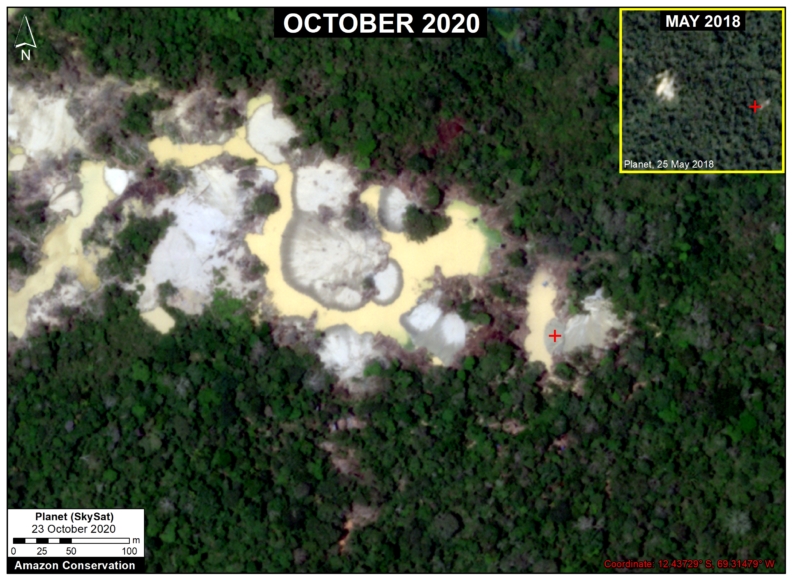
Image 2. Expansion of new gold mining areas into the primary rainforests near the Pariamanu River (Madre de Dios region). Data: Planet.
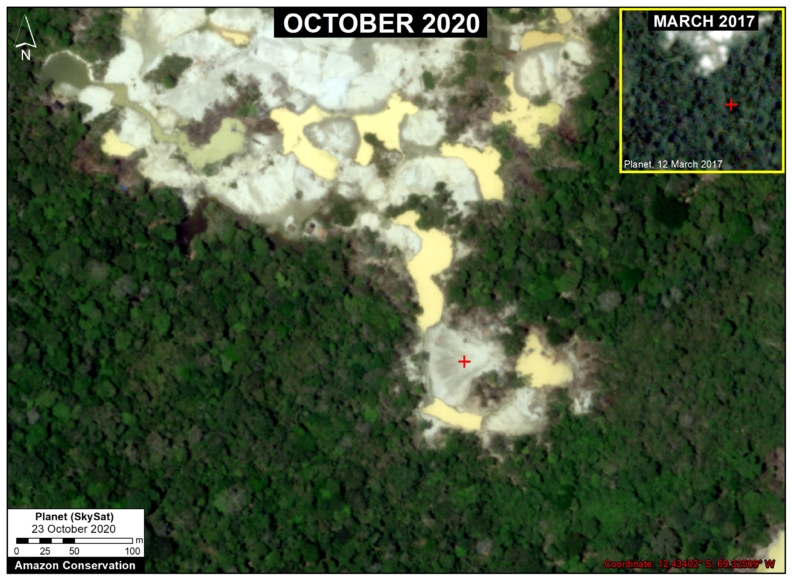
Image 3. Expansion of new gold mining areas into the primary rainforests near the Pariamanu River (Madre de Dios region). Data: Planet.

La Pampa

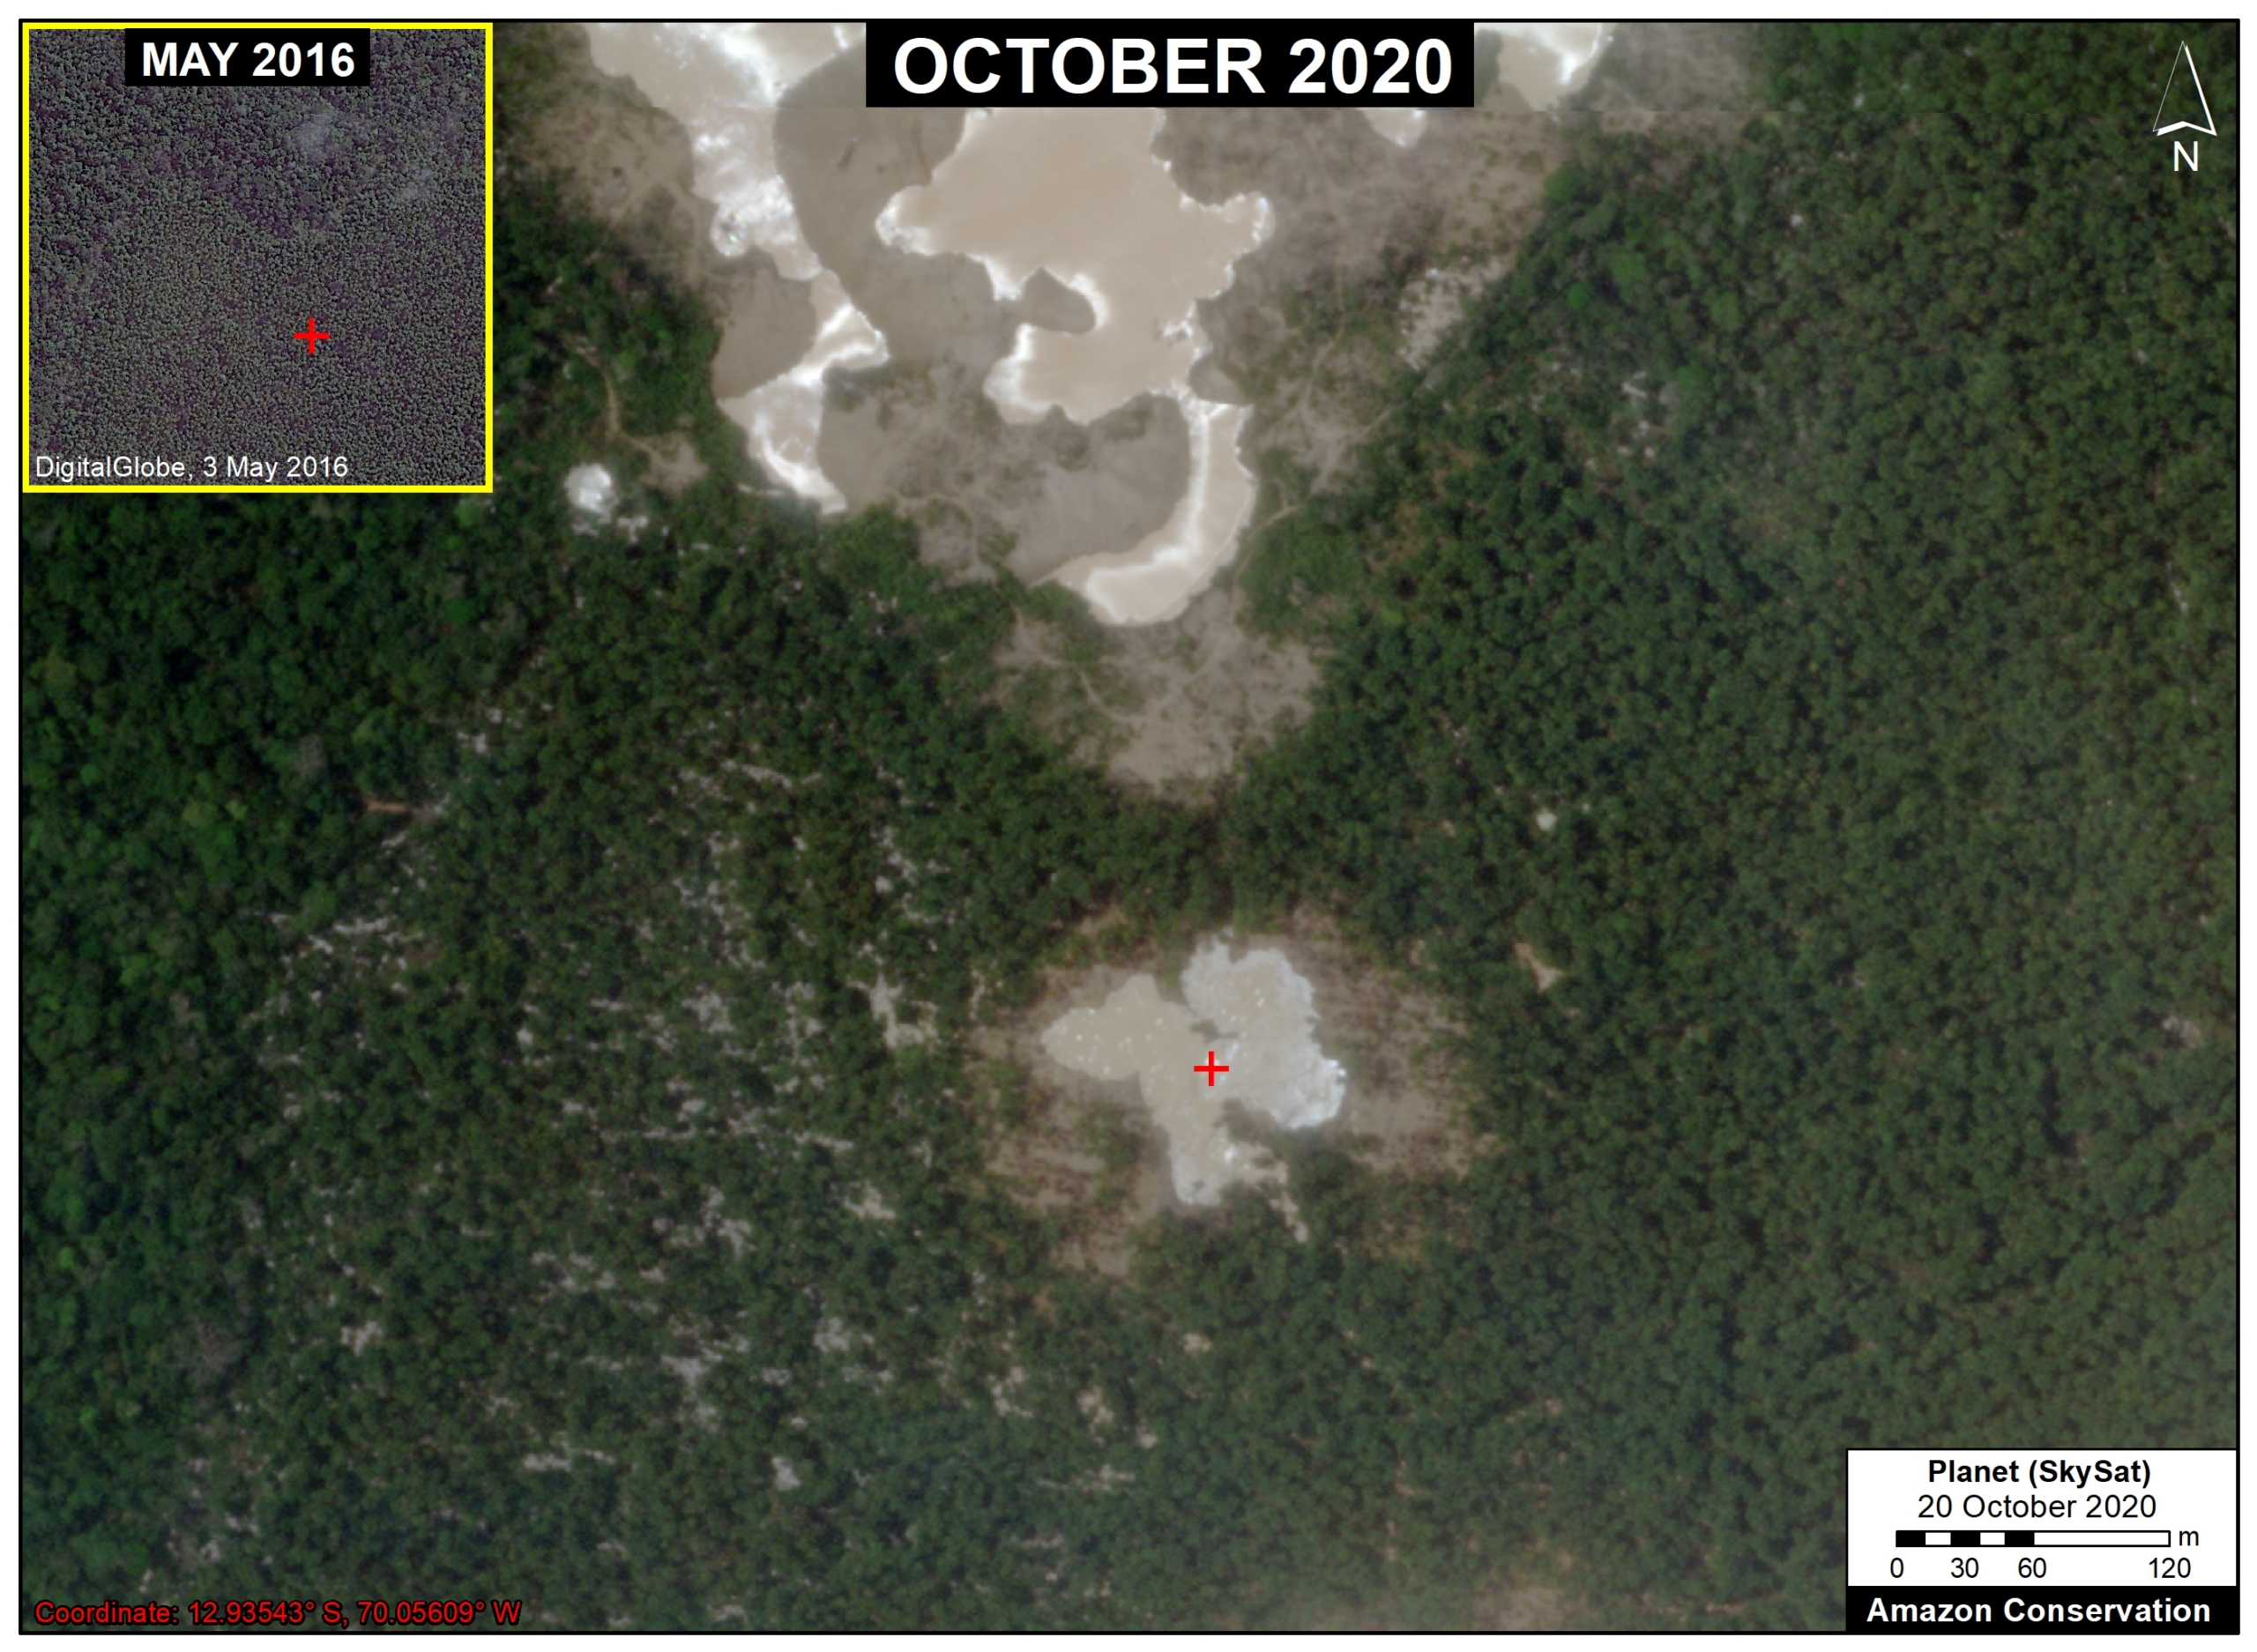
The following image shows the expansion of a new gold mining area in the northern part of La Pampa.
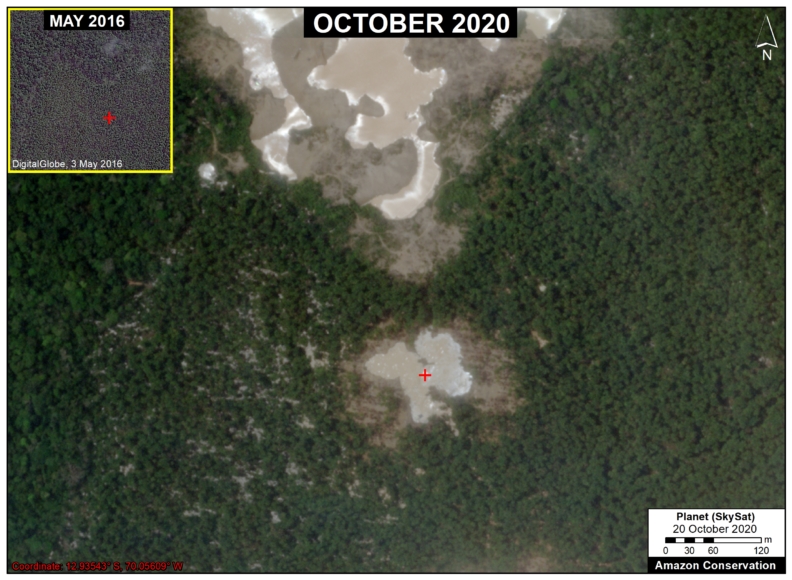
Image 4. Expansion of a new mining area in the northern part of La Pampa (Madre de Dios region). Data: Planet, Maxar.

Chaspa

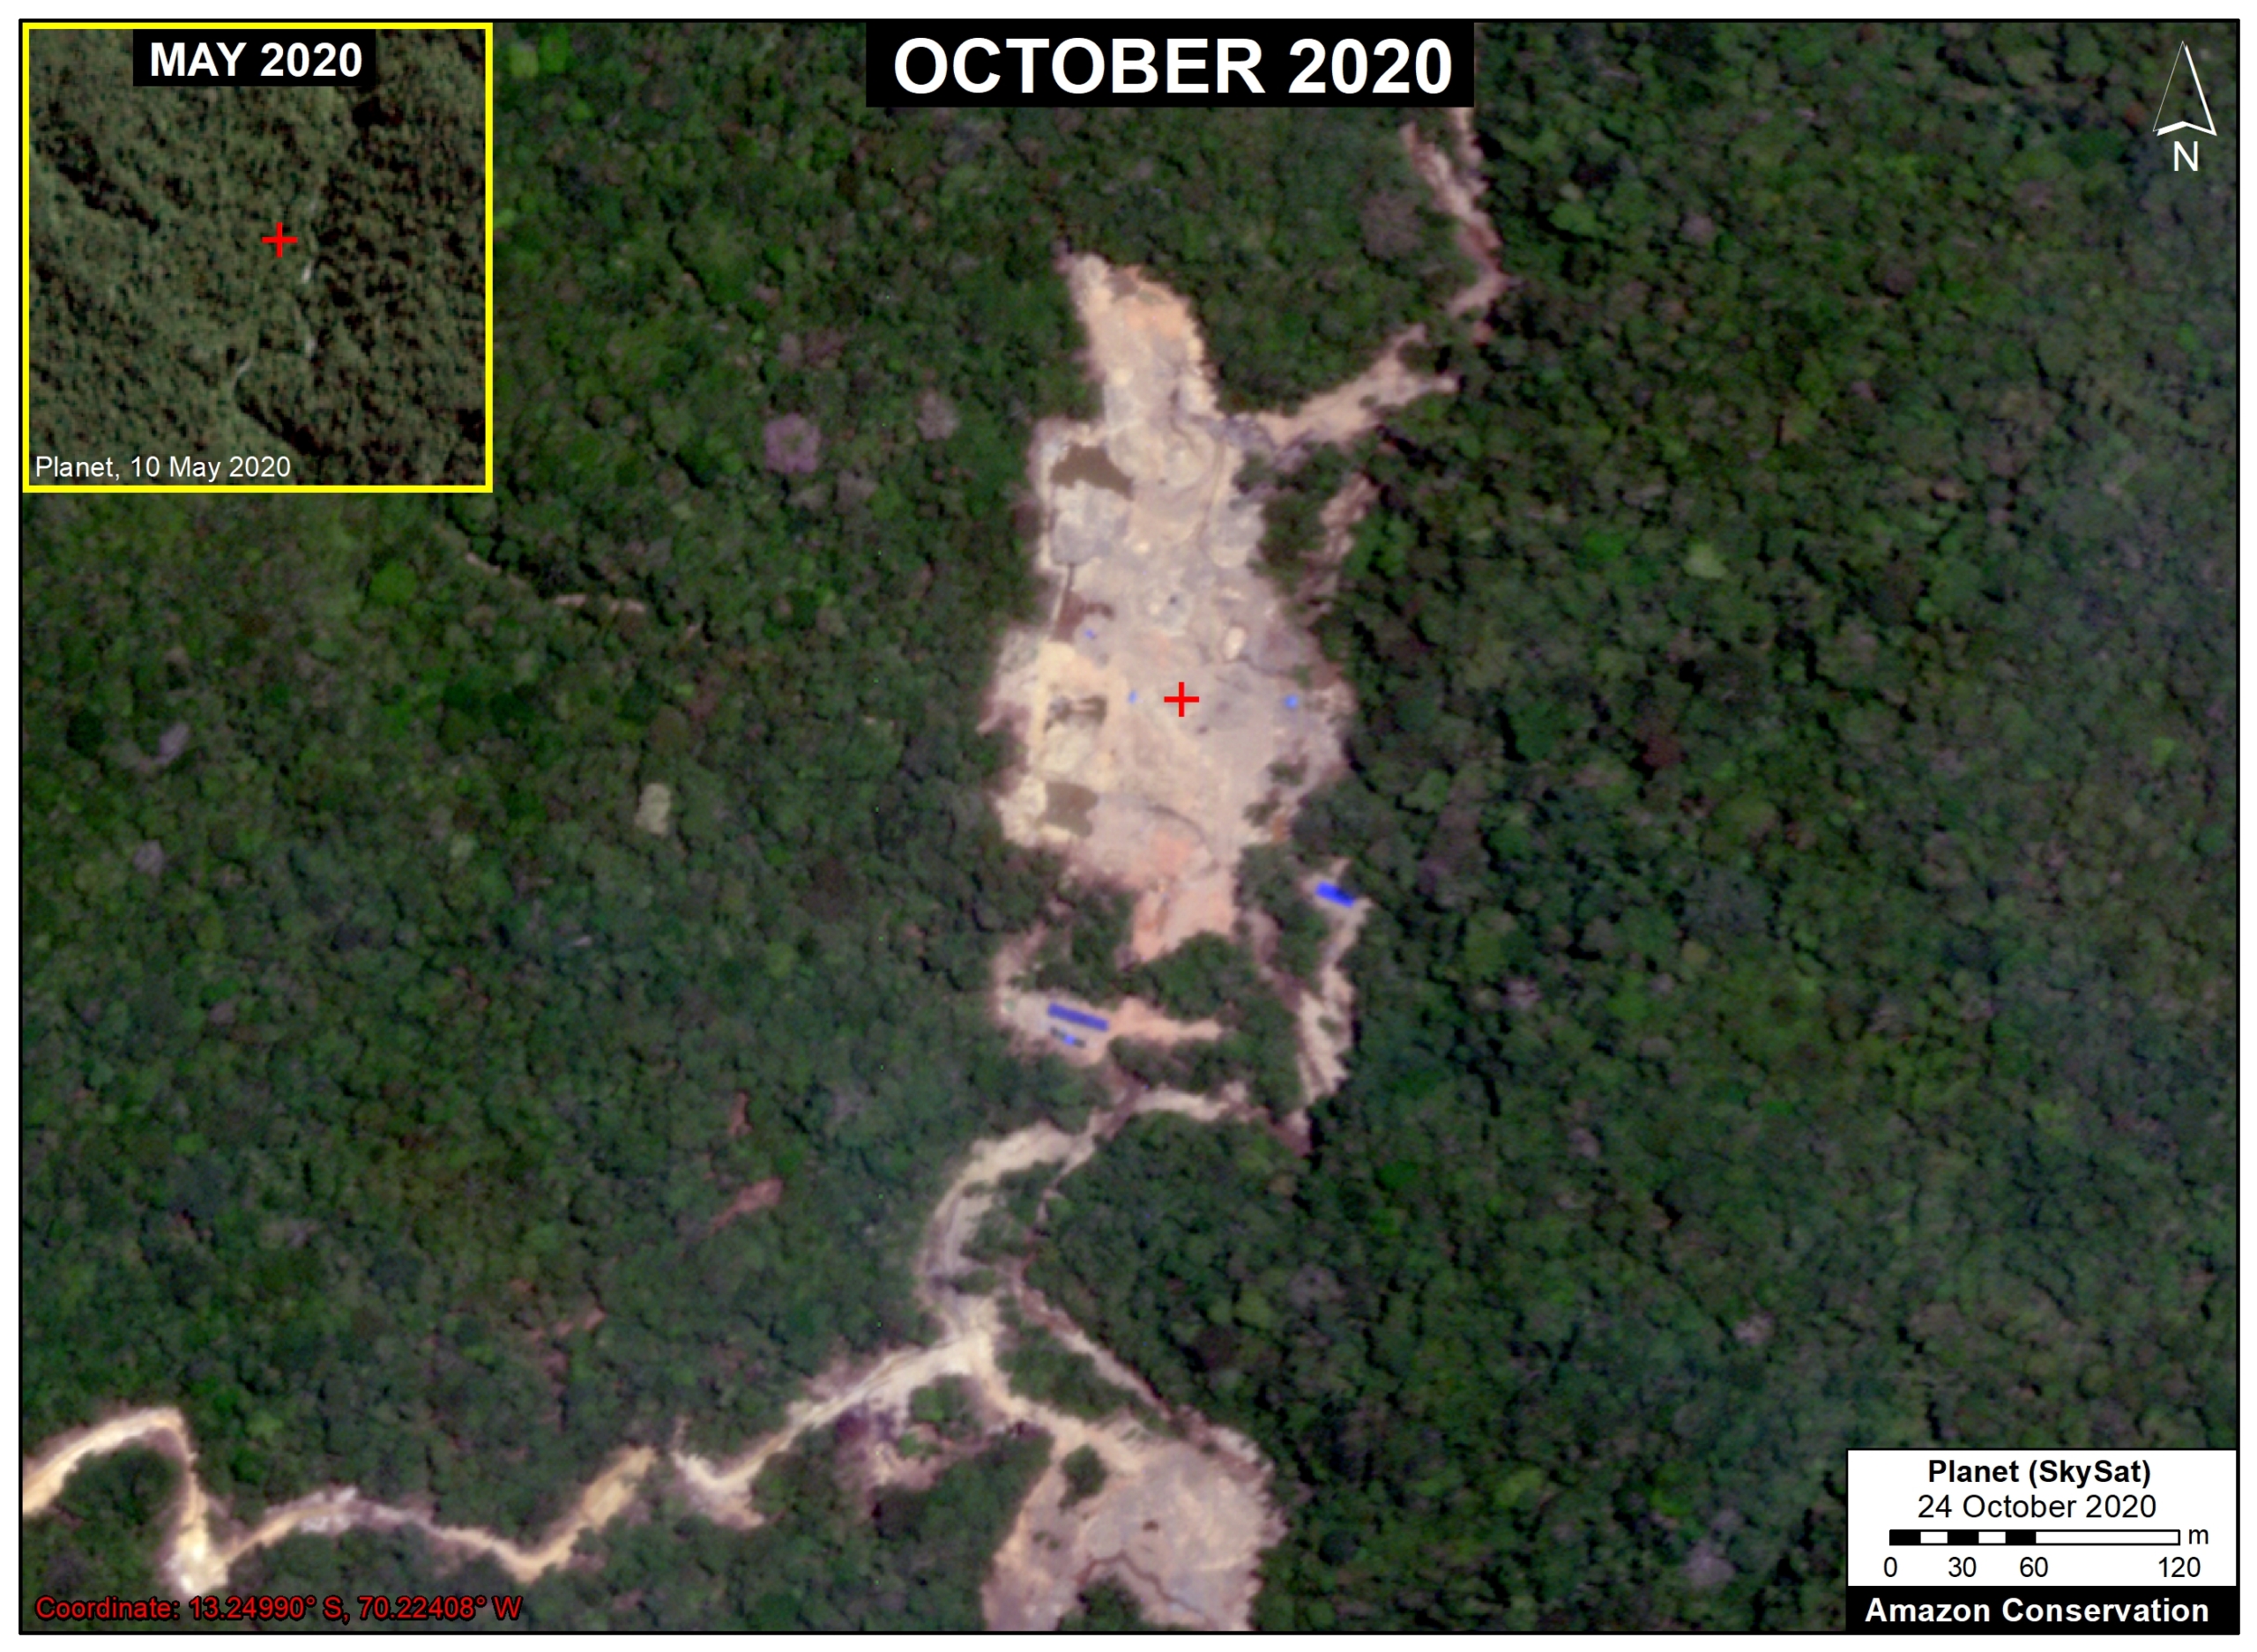
The following image shows the sudden appearance of a new gold mining front along the Chaspa River (Puno region).
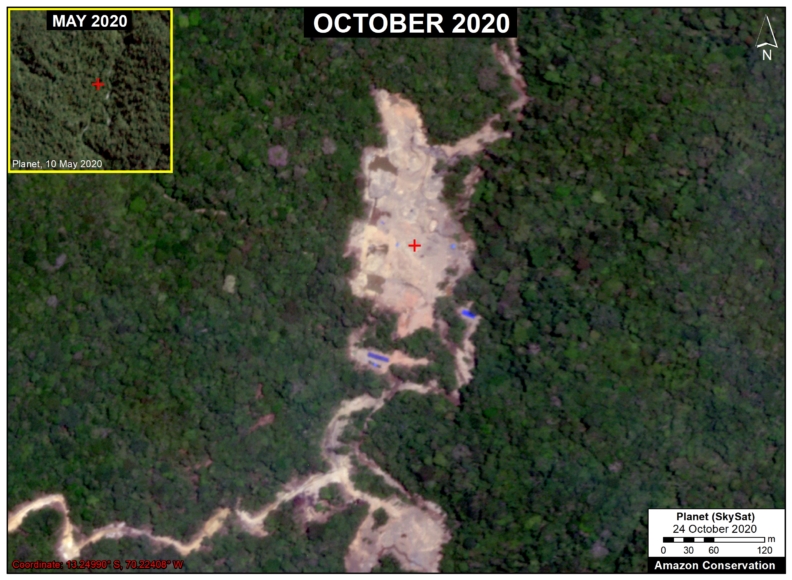
Image 5. New gold mining front along the Chaspa River (Puno region). Data: Planet (Skysat).

Camanti

The following image shows the recent expansion of gold mining deforestation in the buffer zone of Amarakaeri Communal Reserve (Cusco region).
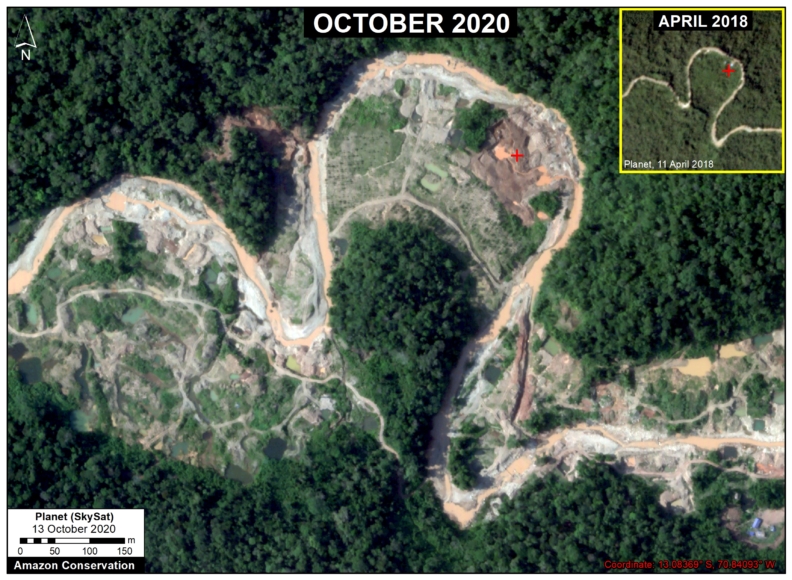
Image 6. Recent expansion of gold mining deforestation in the buffer zone of Amarakaeri Communal Reserve (Cusco region). Data: Planet (Skysat).

Methodology

We analyzed high-resolution imagery (3 meters) from the satellite company Planet obtained from their interface Planet Explorer. Based on this imagery, we digitized gold mining deforestation across six major sites: La Pampa, Alto Malinowski, Camanti, Pariamanu, Apaylon, and Chaspa. These were identified as the major active illegal gold mining deforestation fronts based on analysis of automated forest loss alerts generated by University of Maryland (GLAD alerts) and the Peruvian government (Geobosques) and additional land use layers. The area referred to as the “mining corridor” is not included in the analysis because the issue of legality is more complex.

Across these six sites, we identified, digitized, and analyzed all visible gold mining deforestation between January 2017 and the present (October 2020). We defined before Operation Mercury as data from January 2017 to February 2019, and after Operation Mercury as data from March 2019 to the present. Given that the former was 26 months and the latter 20 months, during the analysis the data was standardized as gold mining deforestation per month.

The data is updated through October 2020.

Acknowledgments

We thank A. Felix (DAI), S. Novoa (ACCA), and G. Palacios for their helpful comments on this report.

This report was conducted with technical assistance from USAID, via the Prevent project. Prevent is an initiative that is working with the Government of Peru, civil society, and the private sector to prevent and combat environmental crimes in Loreto, Ucayali and Madre de Dios, in order to conserve the Peruvian Amazon.

This publication is made possible with the support of the American people through USAID. Its content is the sole responsibility of the authors and does not necessarily reflect the views of USAID or the US government.

Citation

Finer M, Mamani N (2020) Illegal Gold Mining Down 79% in Peruvian Amazon, But Still Threatens Key Areas. MAAP: 130.
MAAP #129: Amazon Fires 2020 – Recap of Another Intense Fire Year

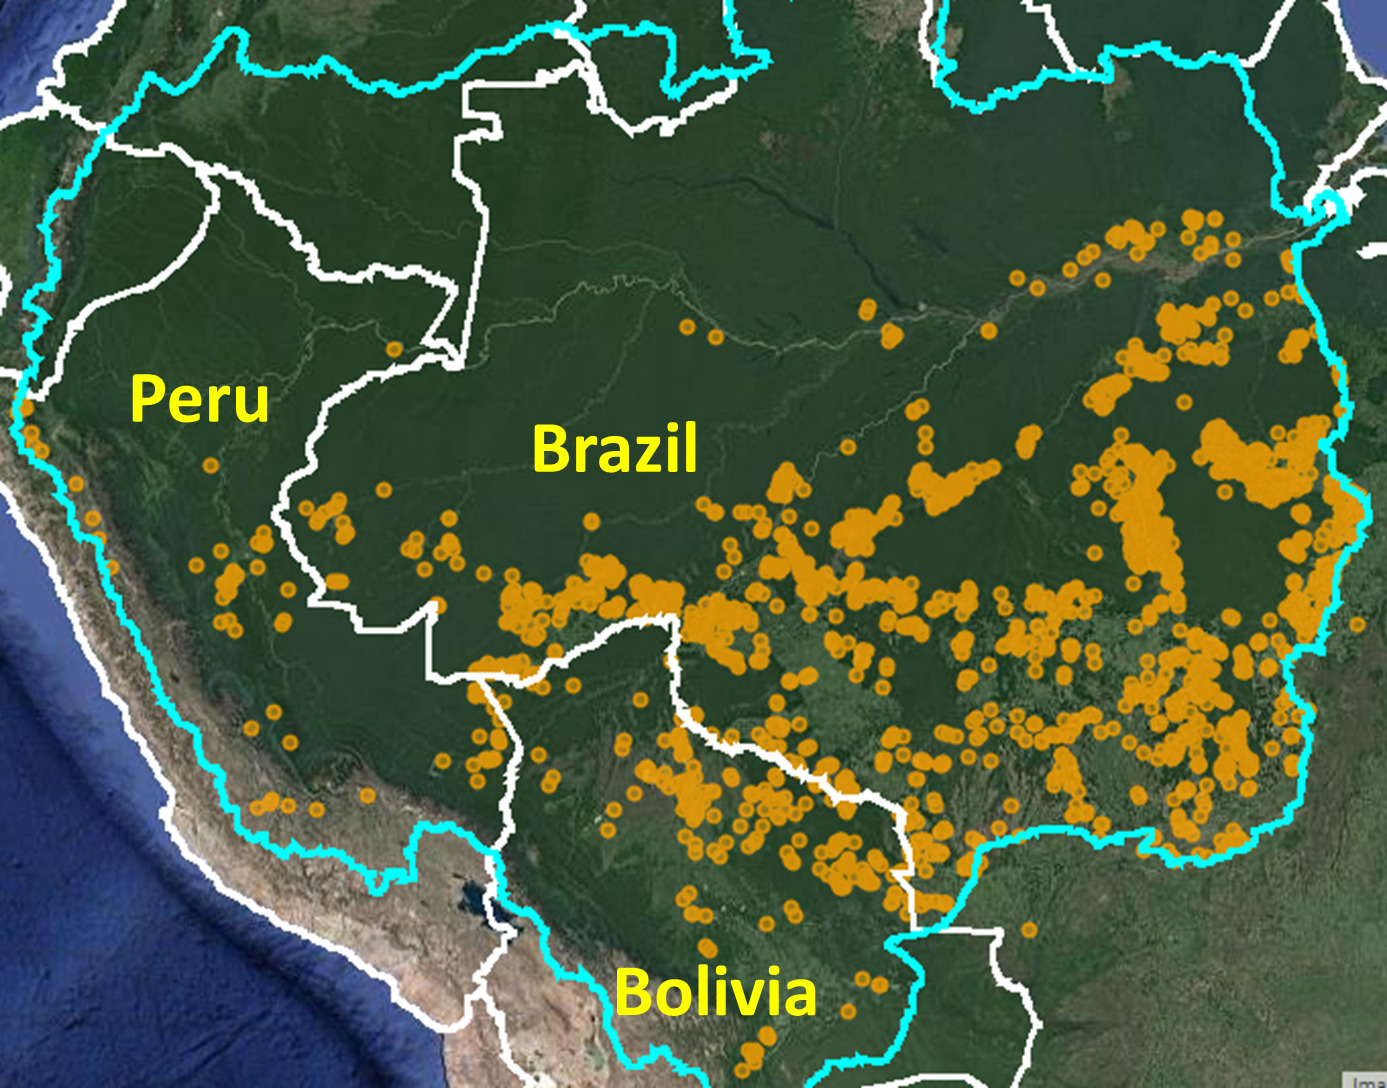
Base Map. Major Amazon fires 2020 (orange dots) within Amazon watershed (blue line). Data: MAAP.

Following the intense Amazon fire season of 2019 that made international headlines, here we report another major fire year in 2020.

Using the novel data from our real-time Amazon Fires Monitoring app,* we documented over 2,500 major fires across the Amazon in 2020 (see Base Map).

The vast majority (88%) of the major fires were in the Brazilian Amazon, followed by the Bolivian Amazon (8%) and Peruvian Amazon (4%). No major fires were detected in the other Amazonian countries.*

We highlight several major headlines:

  • In the Brazilian Amazon, we detected 2,250 major fires. Most (51%) burned recently deforested areas, defined as fires in areas previously cleared between 2018 and 2020. These fires burned an estimated 1.8 million acres, emphasizing the current high deforestation rates in Brazil. In September, there was a major spike in forest fires, impacting vast areas of standing forest (over 5 million acres).
    m
  • In the Bolivian Amazon, we detected 205 major fires. The vast majority (88%) burned in Amazonian savanna and dry forest ecosystems. Notably, a quarter of these fires burned within protected areas.
    ,
  • In the Peruvian Amazon, we detected 116 major fires. There were three major types: 41% burned high elevation grasslands (impacting 26,000 acres), 39% burned recently deforested areas, and 17% burned standing forest (impacting 6,700 acres).
    v
  • The vast majority of the major fires across all three countries were likely human-caused and illegal, in violation of governmental fire management regulations and moratoriums.
    k
  • The app was only fully implemented in 2020, so we do not have comparable data for 2019. However, our extensive analysis of satellite imagery indicates that, in the Brazilian Amazon, both 2019 and 2020 had in common the extensive burning of recently deforested areas. The late season shift to forest fires seemed much more intense in 2020. In the Bolivian Amazon, both 2019 and 2020 had in common the extensive burning of Amazon savannas and dry forests.

See below for additional and more detailed findings for each country. Also, check out Mongabay’s real-time Brazilian Amazon fire tracker based on our analysis.

Brazilian Amazon

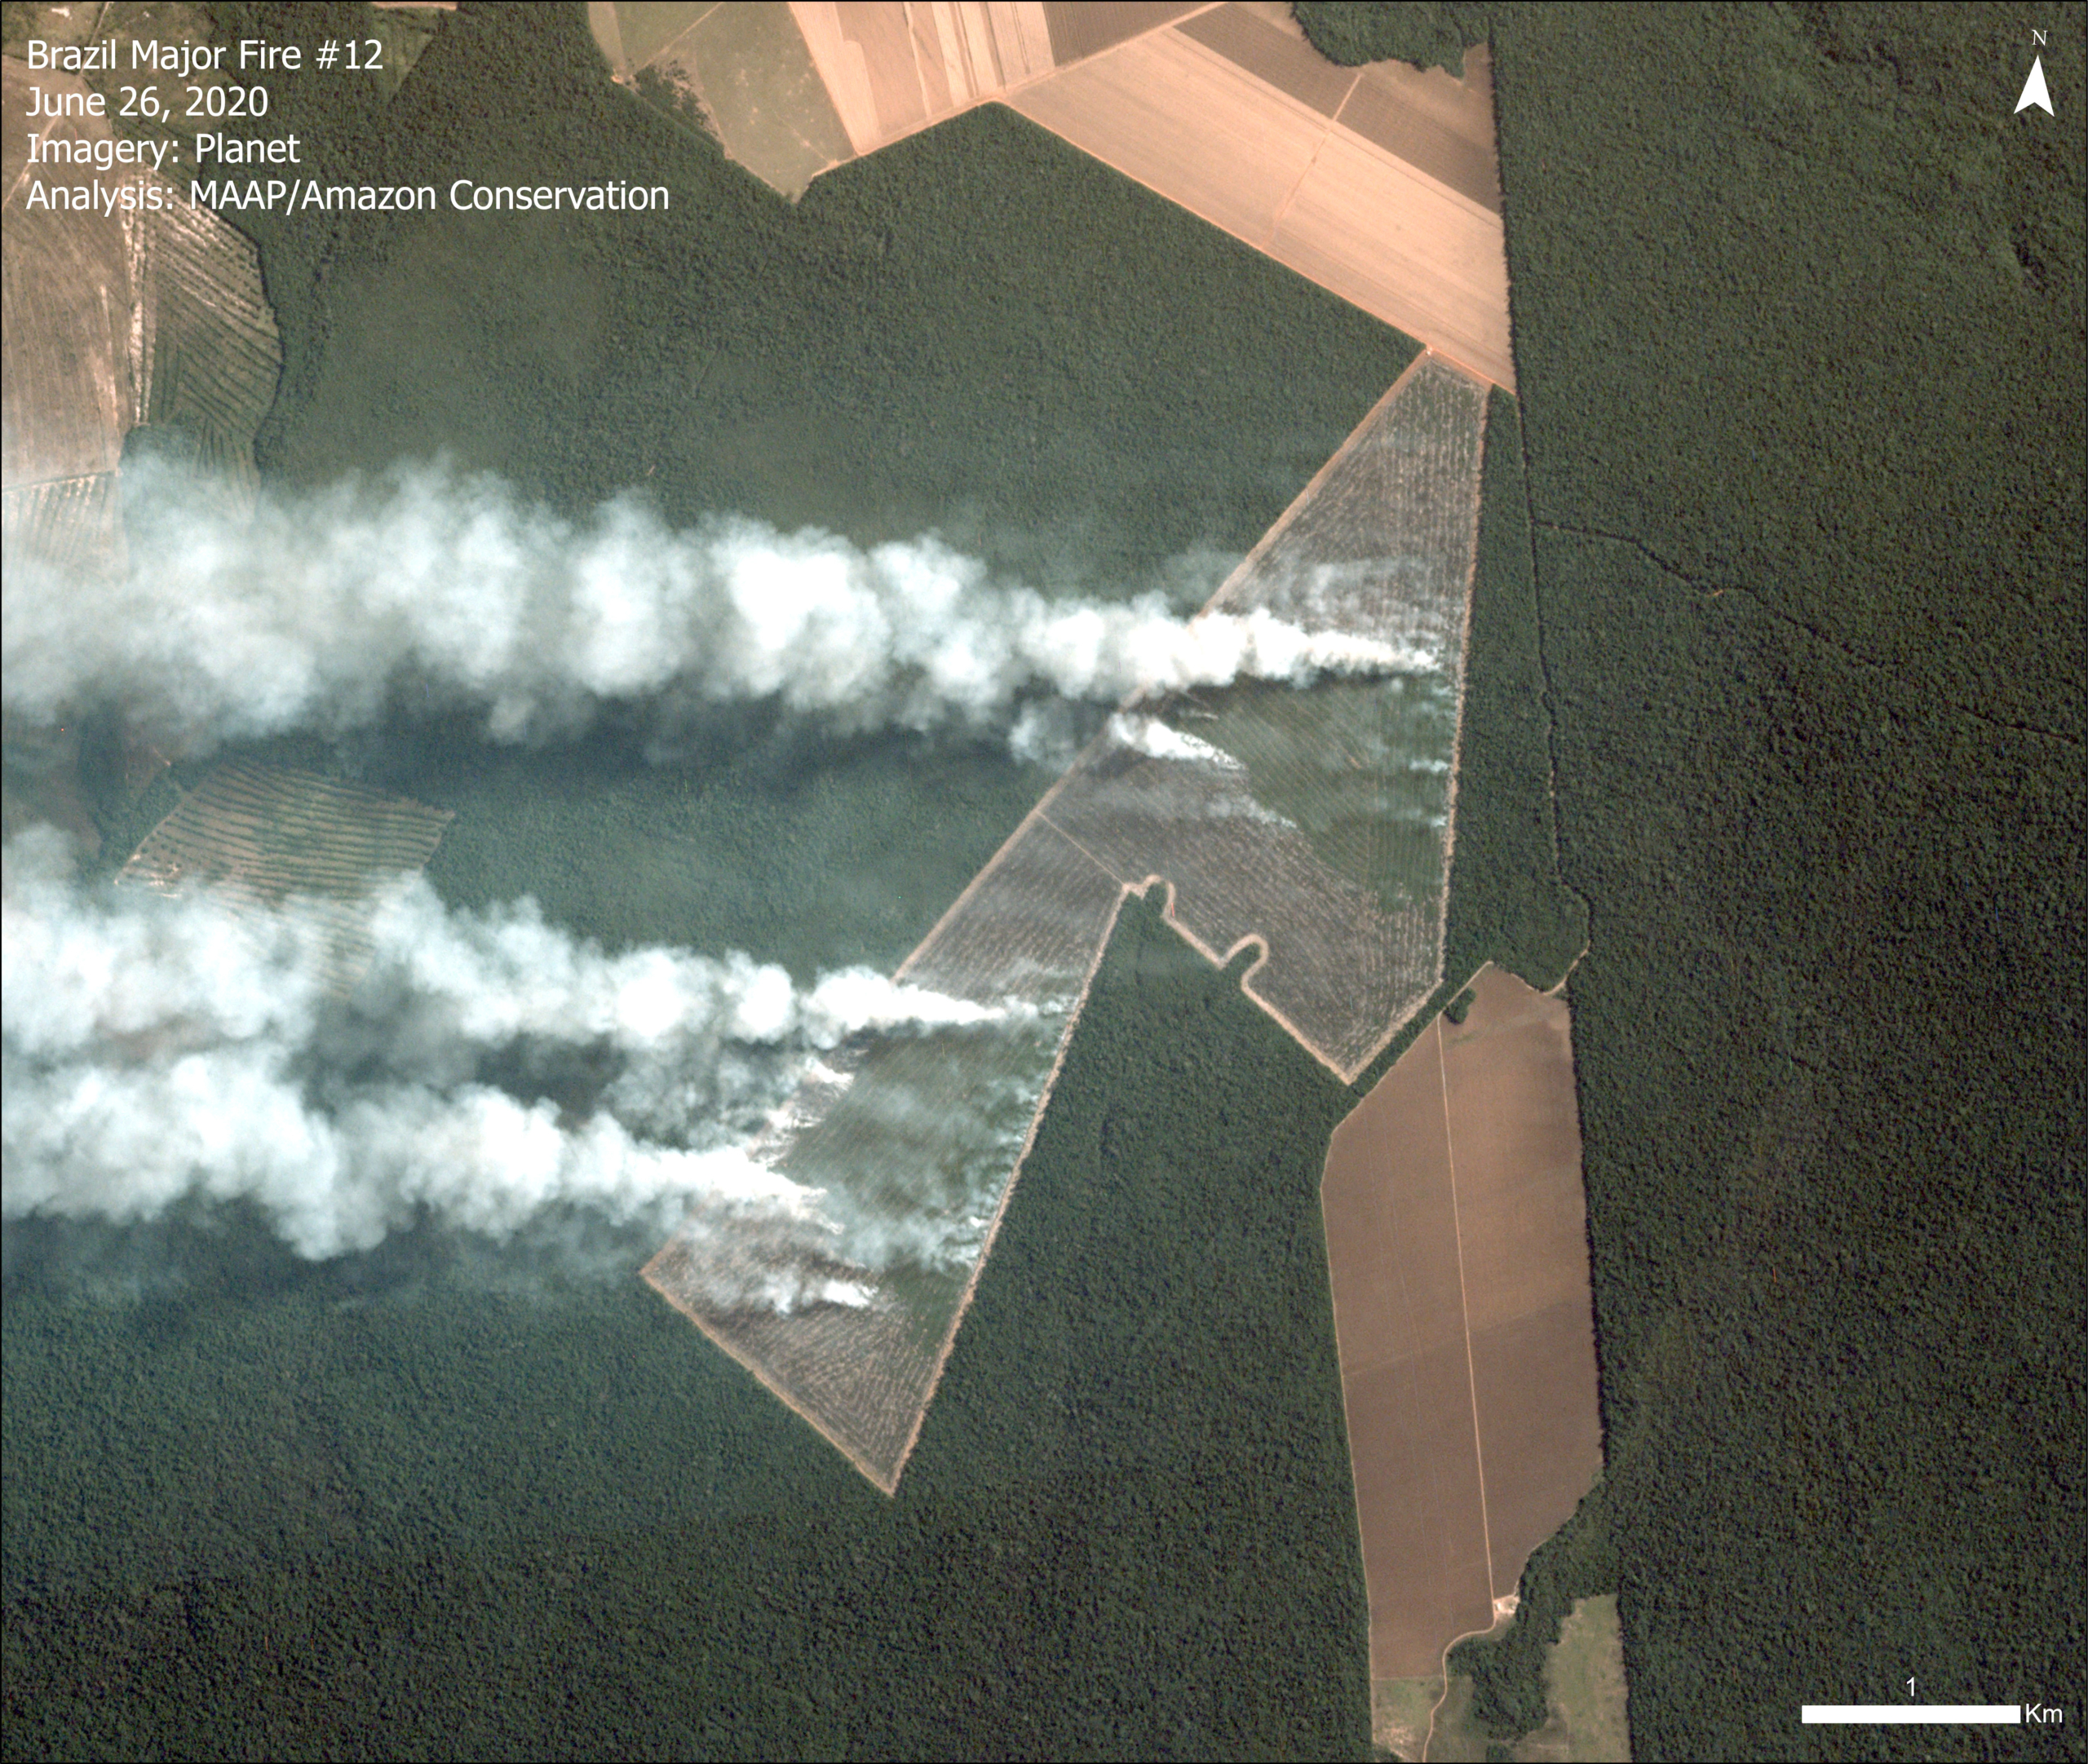
Image 1. Major fire burning recently deforested area in Brazilian Amazon (Mato Grosso). Data: Planet.

We emphasize the following additional findings for the Brazilian Amazon:

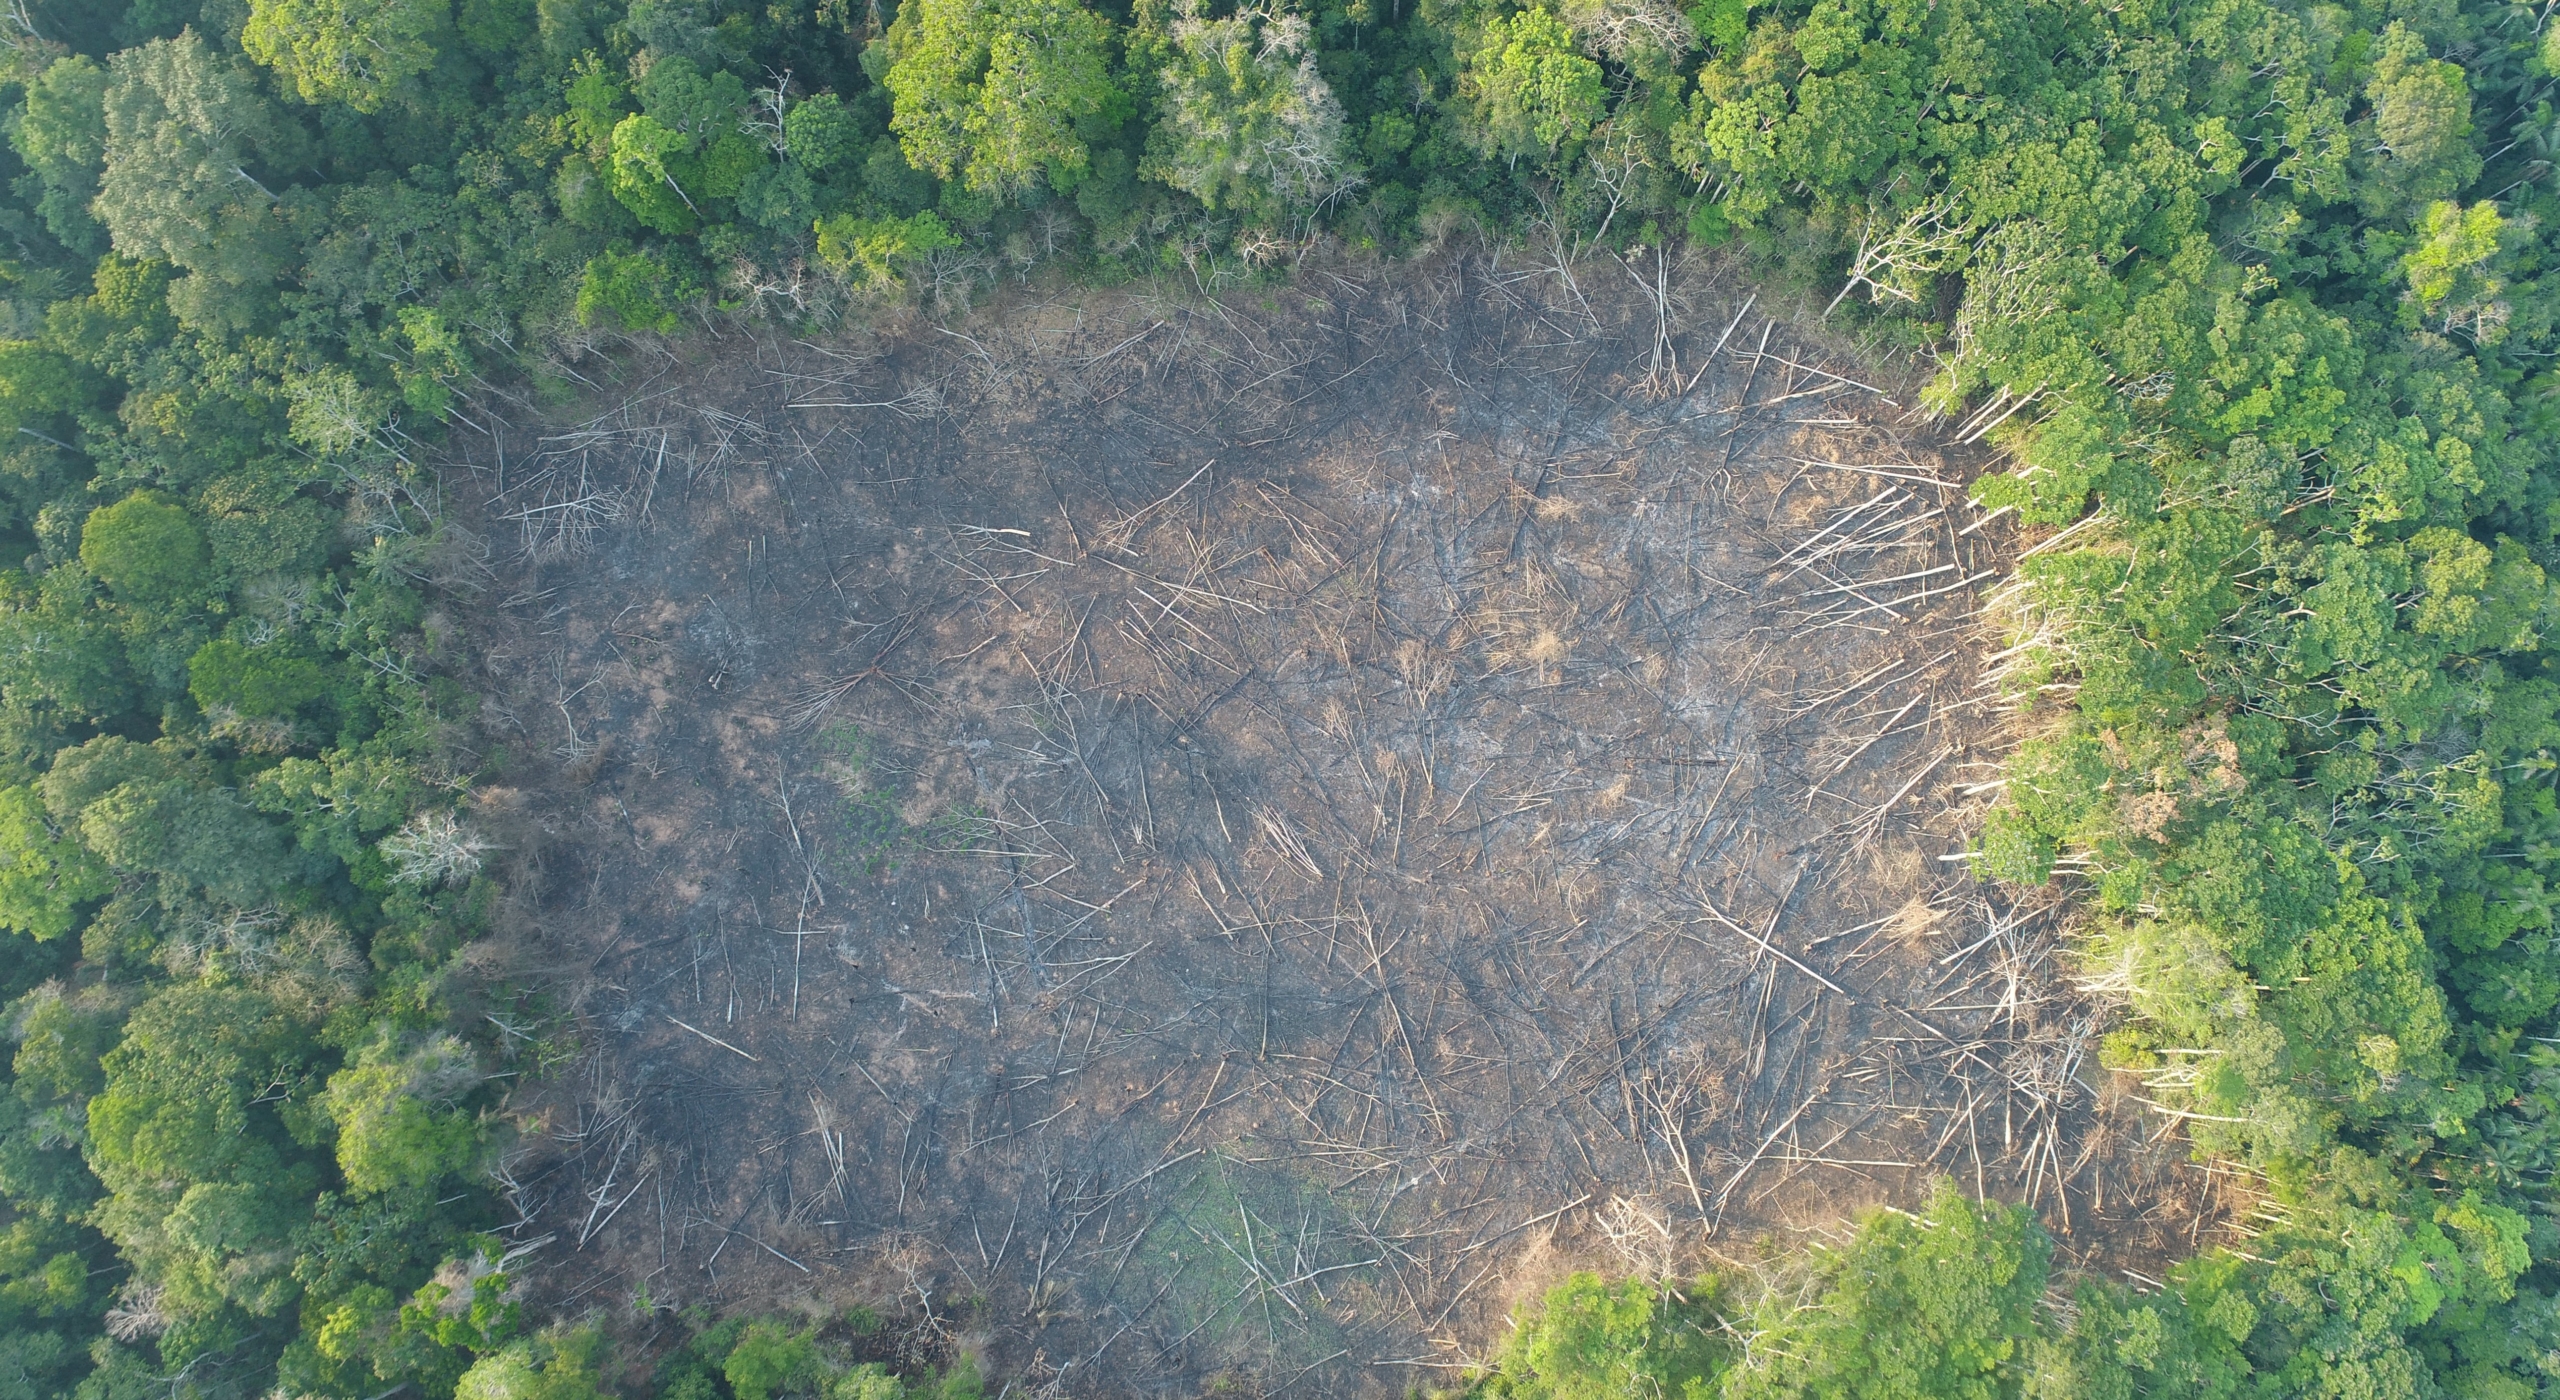
  • Of the 2,250 major fires, over half (51%) burned recently deforested areas, defined as areas where the forest was previously cleared between 2018 and 2020 prior to burning (Image 1). These fires burned an estimated 1.8 million acres (742,000 hectares), highlighting the current high deforestation rates in Brazil.
    .
  • A striking number (40%) were forest fires, defined here as human-caused fires in standing forest. A rough initial estimate suggests that 5.4 million acres (2.2 million hectares) of Amazon forest burned.
    .
  • Over half (51%) occurred in September, followed by August and October (25% and 15%, respectively). September was also when we documented a major shift from fires in recently deforested areas to forest fires.
    .
  • An important number of major fires (12%) occurred within indigenous territories and protected areas. The most impacted were Xingu and Kayapó Indigenous Territories, Jamanxim National Forest, and Nascentes da Serra do Cachimbo Biological Reserve.
    .
  • The vast majority of the major fires (97%) appear to be illegal, occurring after the Amazon fire moratoriums established in July (the government established a 4-month national fire moratorium starting July 15).
    ,
  • Pará  (38%) and Mato Grosso (31%) states had the most fires, followed by Amazonas (15%), Rondônia (11%), and Acre (4%).

Bolivian Amazon

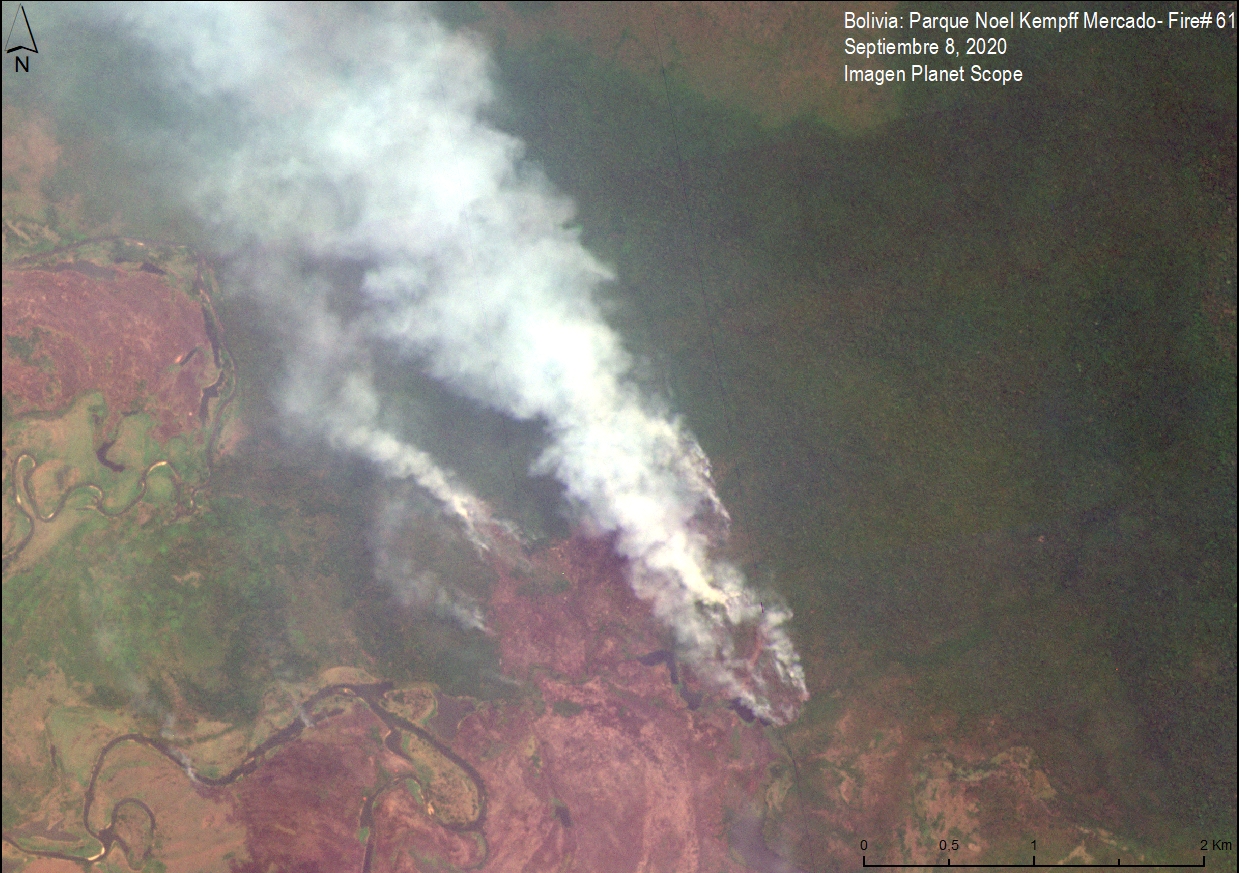
Image 2. Major fire in Noel Kempff Mercado National Park, in the Bolivian Amazon. Data: Planet.

We emphasize the following additional findings for the Bolivian Amazon:

  • Of the 2015 major fires, many (46%) occurred in Amazon savannas.
    .
  • Another 42% of the fires were located in forests, mostly in the dry forests of the Chiquitano. Note, in November there was a major spike in these fires.
    .
  • Importantly, 25% of the major fires were in protected areas. The most impacted were Noel Kempff Mercado National Park (Image 2), Copaibo Municipal Protected Area, Iténez National Park, Keneth Lee Reserve, Rios Blanco y Negro Wildlife Reserve, and Pampas del Río Yacuma Integrated Management Natural Area.
    k
  • The vast majority of the fires (96%) were likely illegal, occuring after the fire moratoriums (August 3 in Beni and Santa Cruz, followed by October 5 nationally).
    .
  • Most of the fires occurred in the department of Beni (51%), followed by Santa Cruz (46%).
    .
  • August had the most fires (27%) followed closely by each of September, October, and November (24% each).
    h

Peruvian Amazon

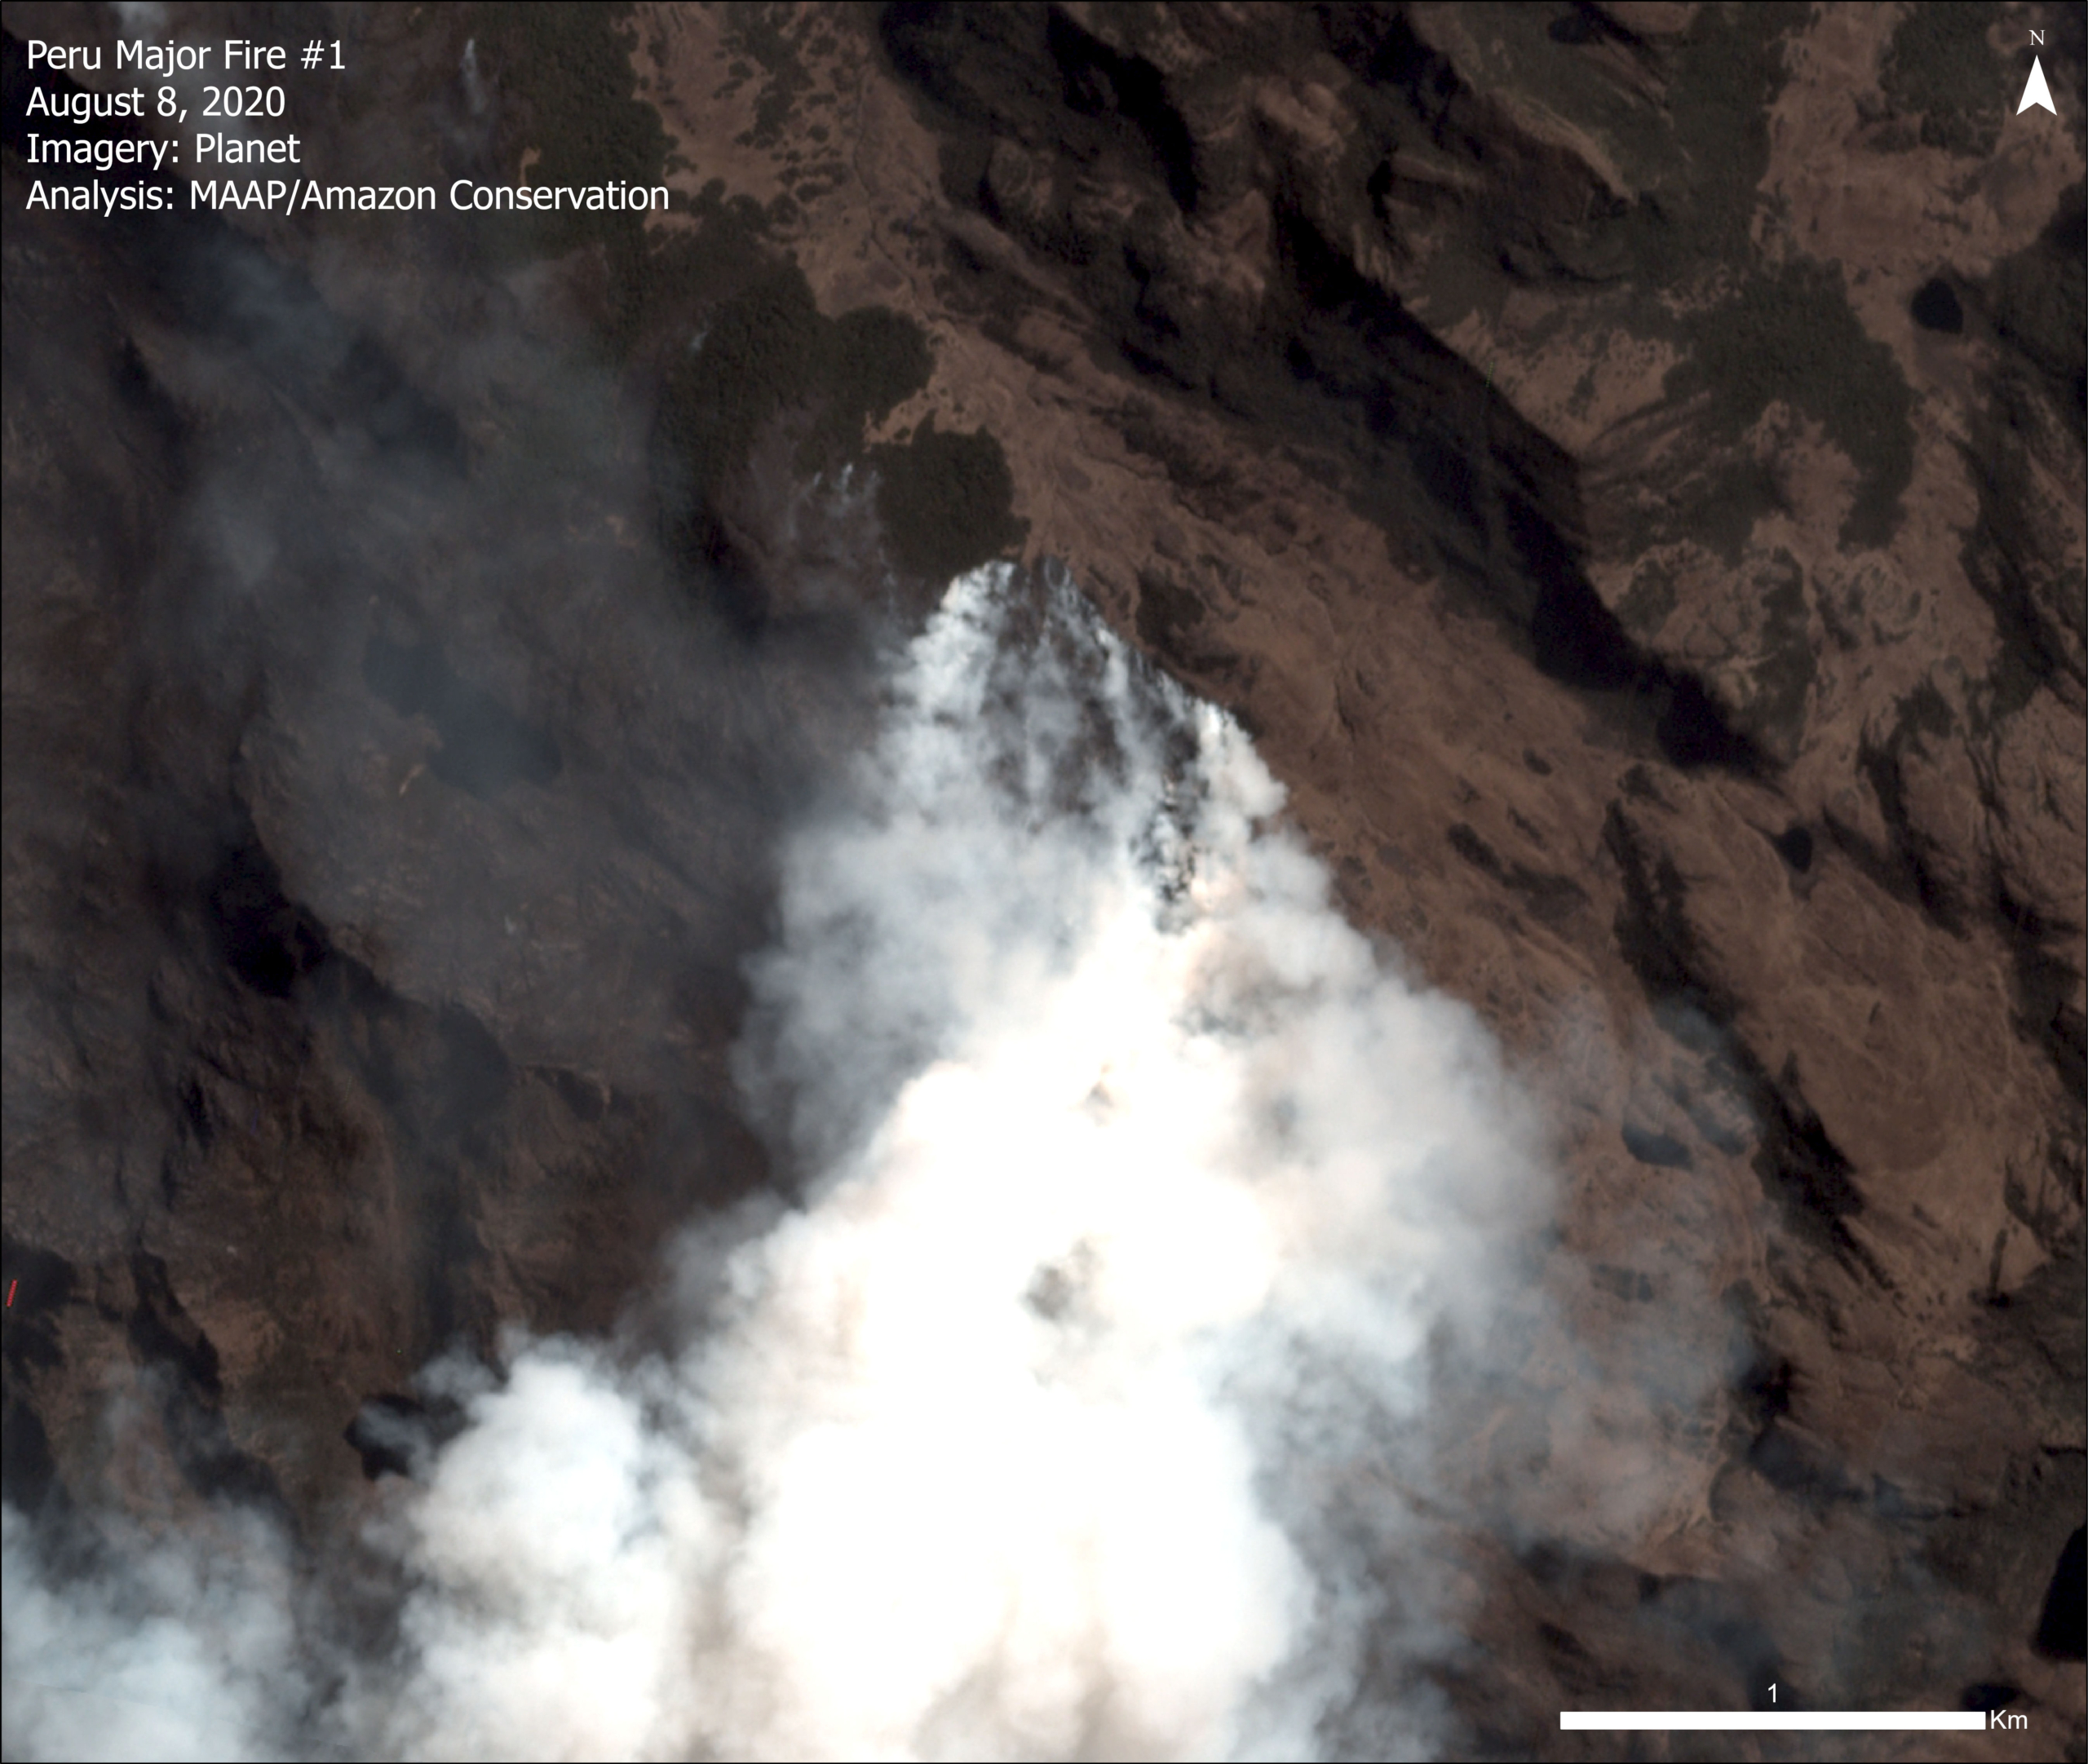
Image 3. Major fire in higher elevation grassland of the Peruvian Amazon. Data: Planet.

We emphasize the following additional findings for the Peruvian Amazon:

  • Of the 116 major fires, many (39%) burned recently deforested areas. Although the pattern is similar to the Brazilian Amazon, the burned (and previously deforested) areas are much smaller (4,660 vs 1.8 million acres).
    ,
  • There were also numerous major fires (41%) in higher elevation grasslands across several regions (Image 3). These fires impacted 26,000 acres (10,000 hectares). We likely underestimated the number of these fires because, due to the lack of biomass in these ecosystems, they didn’t always register as a major fire in the app.
    k
  • Another 17% were forest fires, impacting 6,700 acres (2,700 hectares).
    k
  • All of the fires in the Peruvian were likely illegal, according to Peruvian fire management regulations.
    j
  • 15 regions experienced major fires, reflecting the mix of both grassland and forest fires. The regions with the most fires were Madre de Dios (23%), Ucayali (12%) and Junin (11%).
    h
  • November surprisingly had the most major fires (46%), followed by October and September (29% and 22%, respectively).
    j

*Notes and Methodology

The data is based on our analysis of Amazon Conservation’s novel real-time Amazon Fires Monitoring app. We started daily monitoring in May and continued through November. Specifically, he first major fire was detected on May 28 and the data was updated daily through November 30.
The app displays aerosol emissions as detected by the European Space Agency’s Sentinel-5 satellite. Elevated aerosol levels indicate the burning of large amounts of biomass, defined here as a “major fire”. In a novel approach, the app combines data from the atmosphere (aerosol emissions in smoke) and the ground (heat anomaly alerts) to effectively detect and visualize major Amazon fires.

When fires burn, they emit gases and aerosols. A new satellite (Sentinel-5P from the European Space Agency) detects these aerosol emissions (aerosol definition: Suspension of fine solid particles or liquid droplets in air or another gas). Thus, the major feature of the app is detecting elevated aerosol emissions which in turn indicate the burning of large amounts of biomass. For example, the app distinguishes small fires clearing old fields (and burning little biomass) from larger fires burning recently deforested areas or standing forest (and burning lots of biomass). The spatial resolution of the aerosol data is 7.5 sq km. The high values in the aerosol indices (AI) may also be due to other reasons such as emissions of volcanic ash or desert dust so it is important to cross reference elevated emissions with heat data and optical imagery.

We define “major fire” as one showing elevated aerosol emission levels on the app, thus indicating the burning of elevated levels of biomass. This typically translates to an aerosol index of >1 (or cyan-green to red on the app). To identify the exact source of the elevated emissions, we reduce the intensity of aerosol data in order to see the underlying terrestrial heat-based fire alerts. Typically for major fires, there is a large cluster of alerts. The major fires are then confirmed, and burn areas estimated, using high-resolution satellite imagery from Planet Explorer.

Some additional country-specific notes:

Bolivia – As note above, the high values in the aerosol indices (AI) may also be due to other reasons such as emissions of volcanic ash or desert dust. Hence, some areas, such as the Salar de Uyuni, in western Bolivia, often have orange or red tones.

Colombia – Our daily 2020 monitoring took place from May until November, but Colombia’s drier burning season was likely earlier in the year (January – March). We will be monitoring Colombia during this time frame in 2021.

Acknowledgements

The app was developed and updated daily by Conservación Amazónica (ACCA). The data analysis is led by Amazon Conservation in collaboration with SERVIR Amazonia.

We thank E. Ortiz, A. Folhadella, A. Felix, and G. Palacios for their helpful comments on this report.

Citation

Finer M, Villa L, Vale H, Ariñez A, Nicolau A, Walker K (2020) Amazon Fires 2020 – Recap of Another Intense Fire Year. MAAP: 129.

MAAP #128: United Cacao Case – 7 Years After Massive Deforestation in the Peruvian Amazon

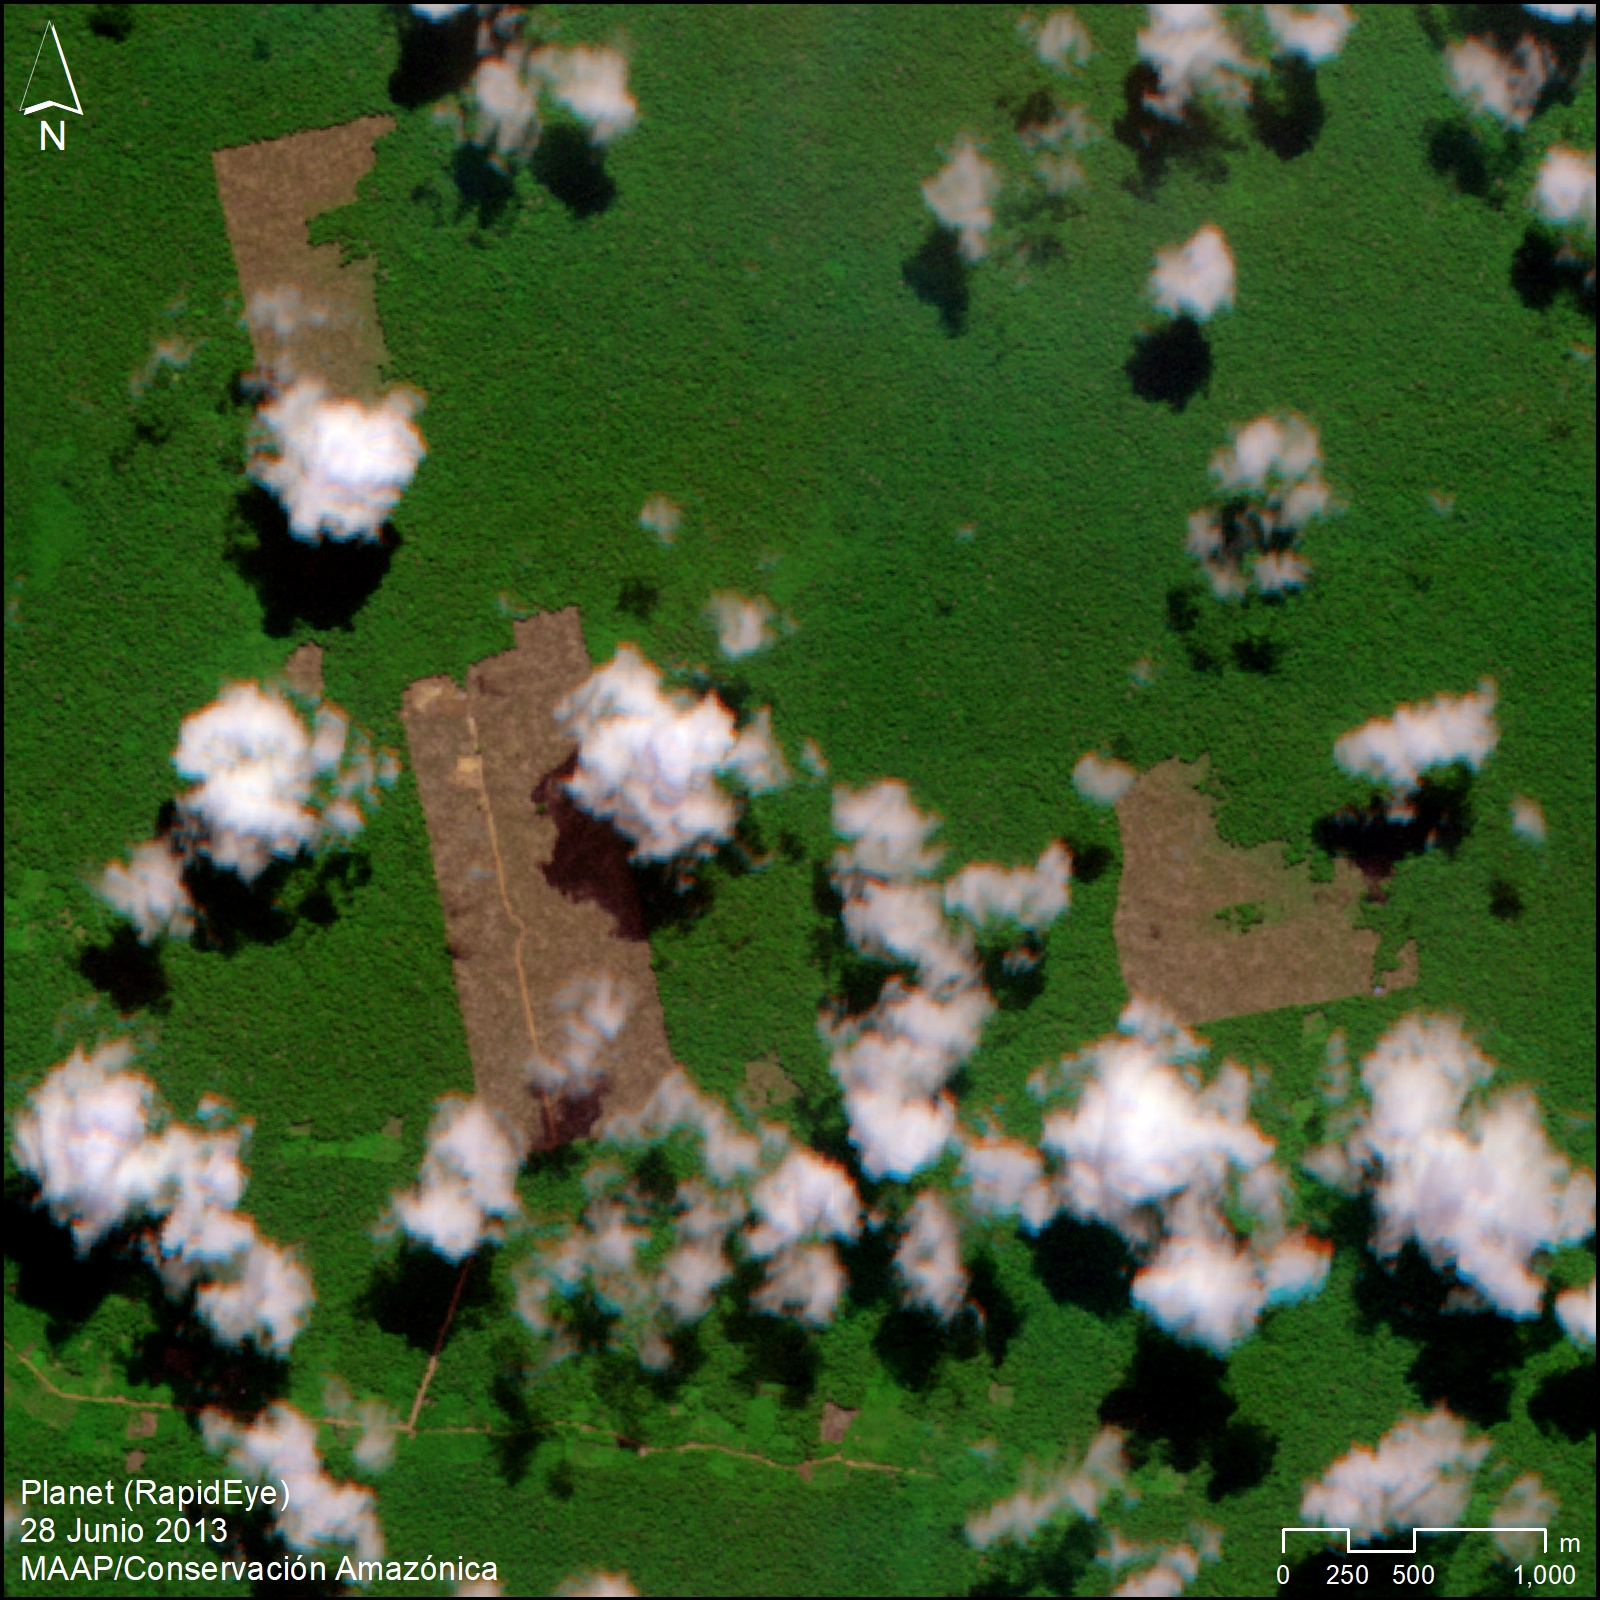
Image 1. The first sign of large-scale deforestation, near the town of Tamshiyacu, in June 2013. Data: Planet (RapidEye). First time published. Click to enlarge.

Here, we confirm the massive deforestation of primary forest (more than 2,000 hectares) in the Peruvian Amazon by the company United Cacao between 2013 and 2016.

We present a series of recently obtained (and never before published) satellite images to emphasize the reality and importance of a deforestation case that is still being debated at the highest levels in the Peruvian government, seven years later.

In June 2013, a high-resolution satellite, through scattered clouds, revealed the start of massive deforestation of primary forest near the town of Tamshiyacu, in the Loreto region (Image 1).

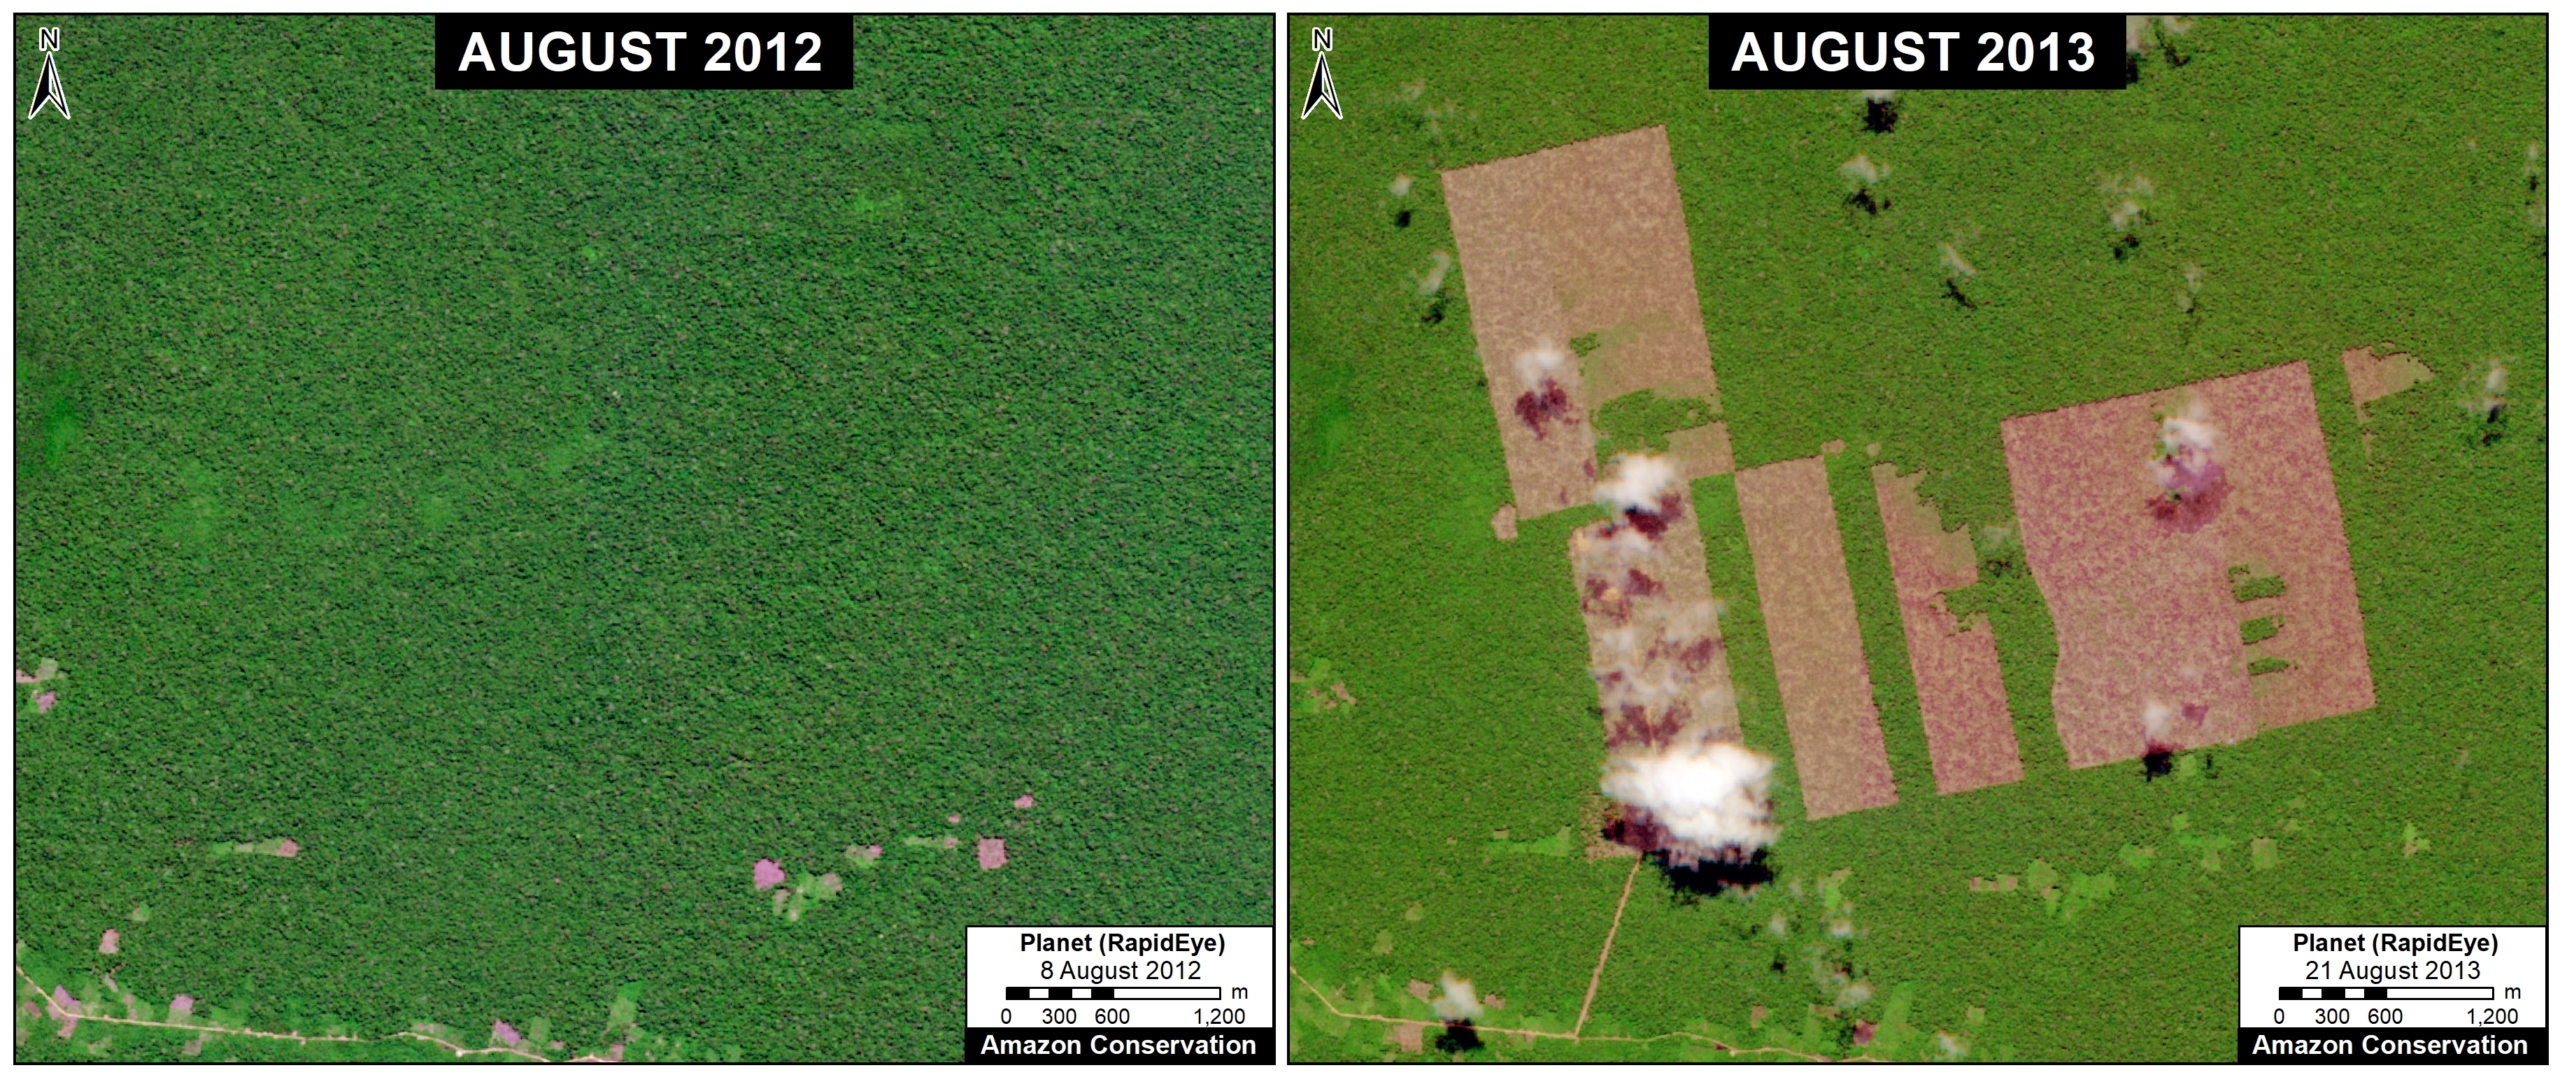
In August of that same year, the clouds cleared a bit more, giving a better view. Image 2 (see below) shows the rapid deforestation of primary forest in 2013.

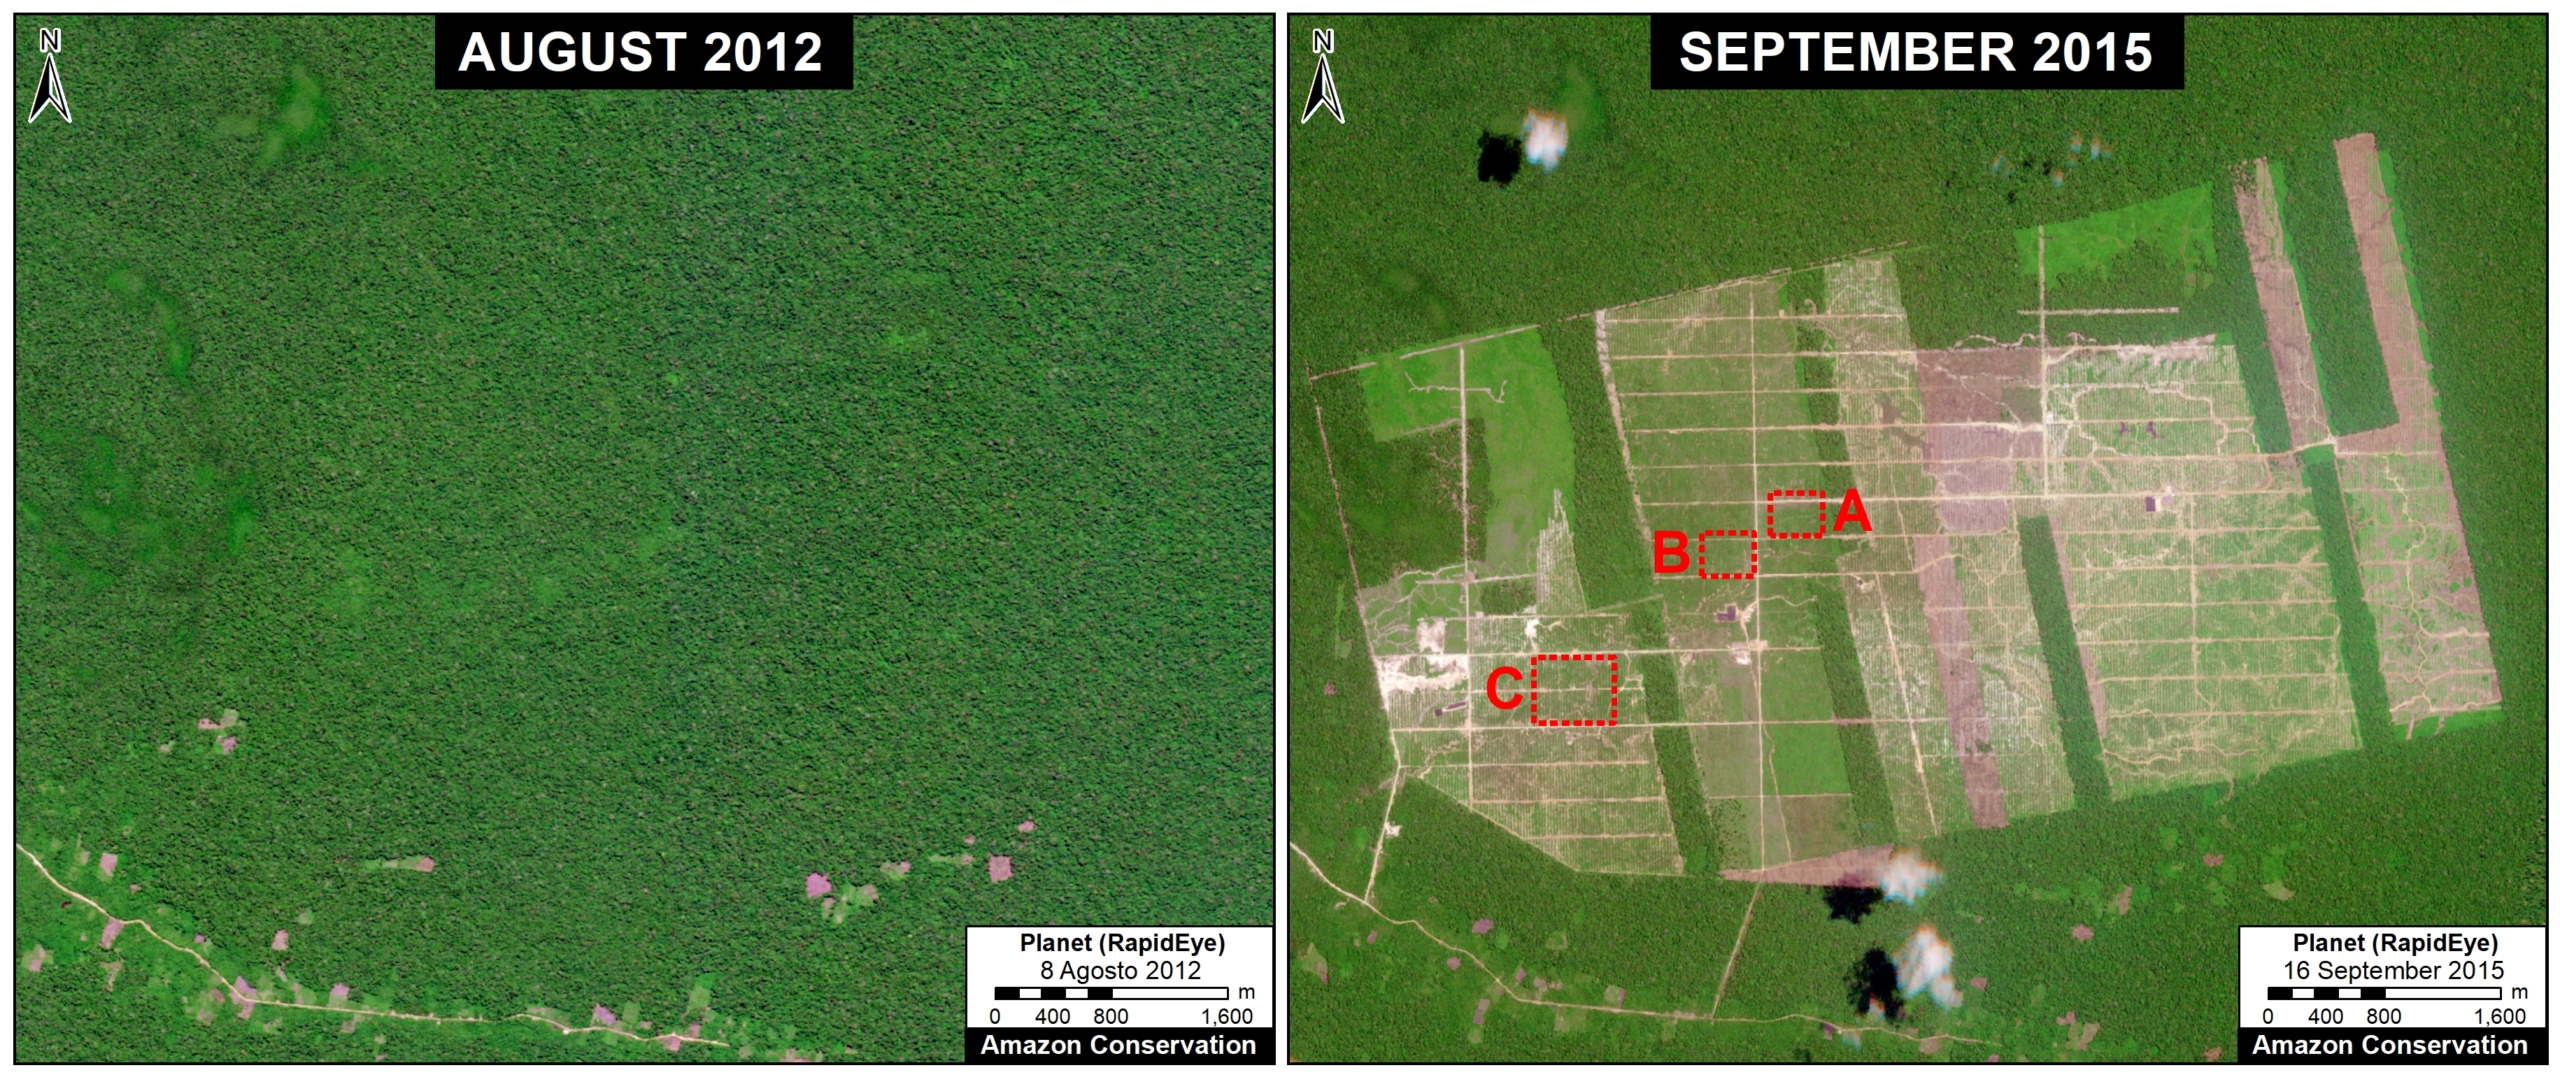
By September 2015, the deforestation had reached 2,380 hectares, or 5,880 acres (Image 3).

Most recently, in October 2020, a new very high-resolution image shows cacao crops in areas that, seven years ago, were primary forest (Image 4).

Below, we show, for the first time, these high and very-high resolution images (5 and 0.5 meters, respectively) recently obtained from the satellite company Planet, clearly showing the situation from 2012 -2020. Additionally, we show the historical context with Landsat images dating back to 1985, and briefly describe the current political situation regarding the case.
Deforestation 2013

Image 2 shows the first stage of large-scale deforestation (1,100 hectares) by the company United Cacao, between August 2012 (left panel) and August 2013 (right panel).

Image 2. Large-scale deforestation by United Cacao between August 2012 (left panel) and August 2013 (right panel). Data: Planet (RapidEye). First time published. Click to enlarge.

Deforestation 2015

Image 3 shows the total large-scale deforestation (2,380 hectares, or 5,880 acres) by United Cacao between August 2012 (left panel) and September 2015 (right panel). Insets A-C indicate the locations of the zooms below.

Image 3. Large-scale deforestation by United Cacao between August 2012 (left panel) and September 2015 (right panel). Data: Planet (RapidEye). First time published. Click to enlarge.

2020 – Cacao Crops in Deforested Areas

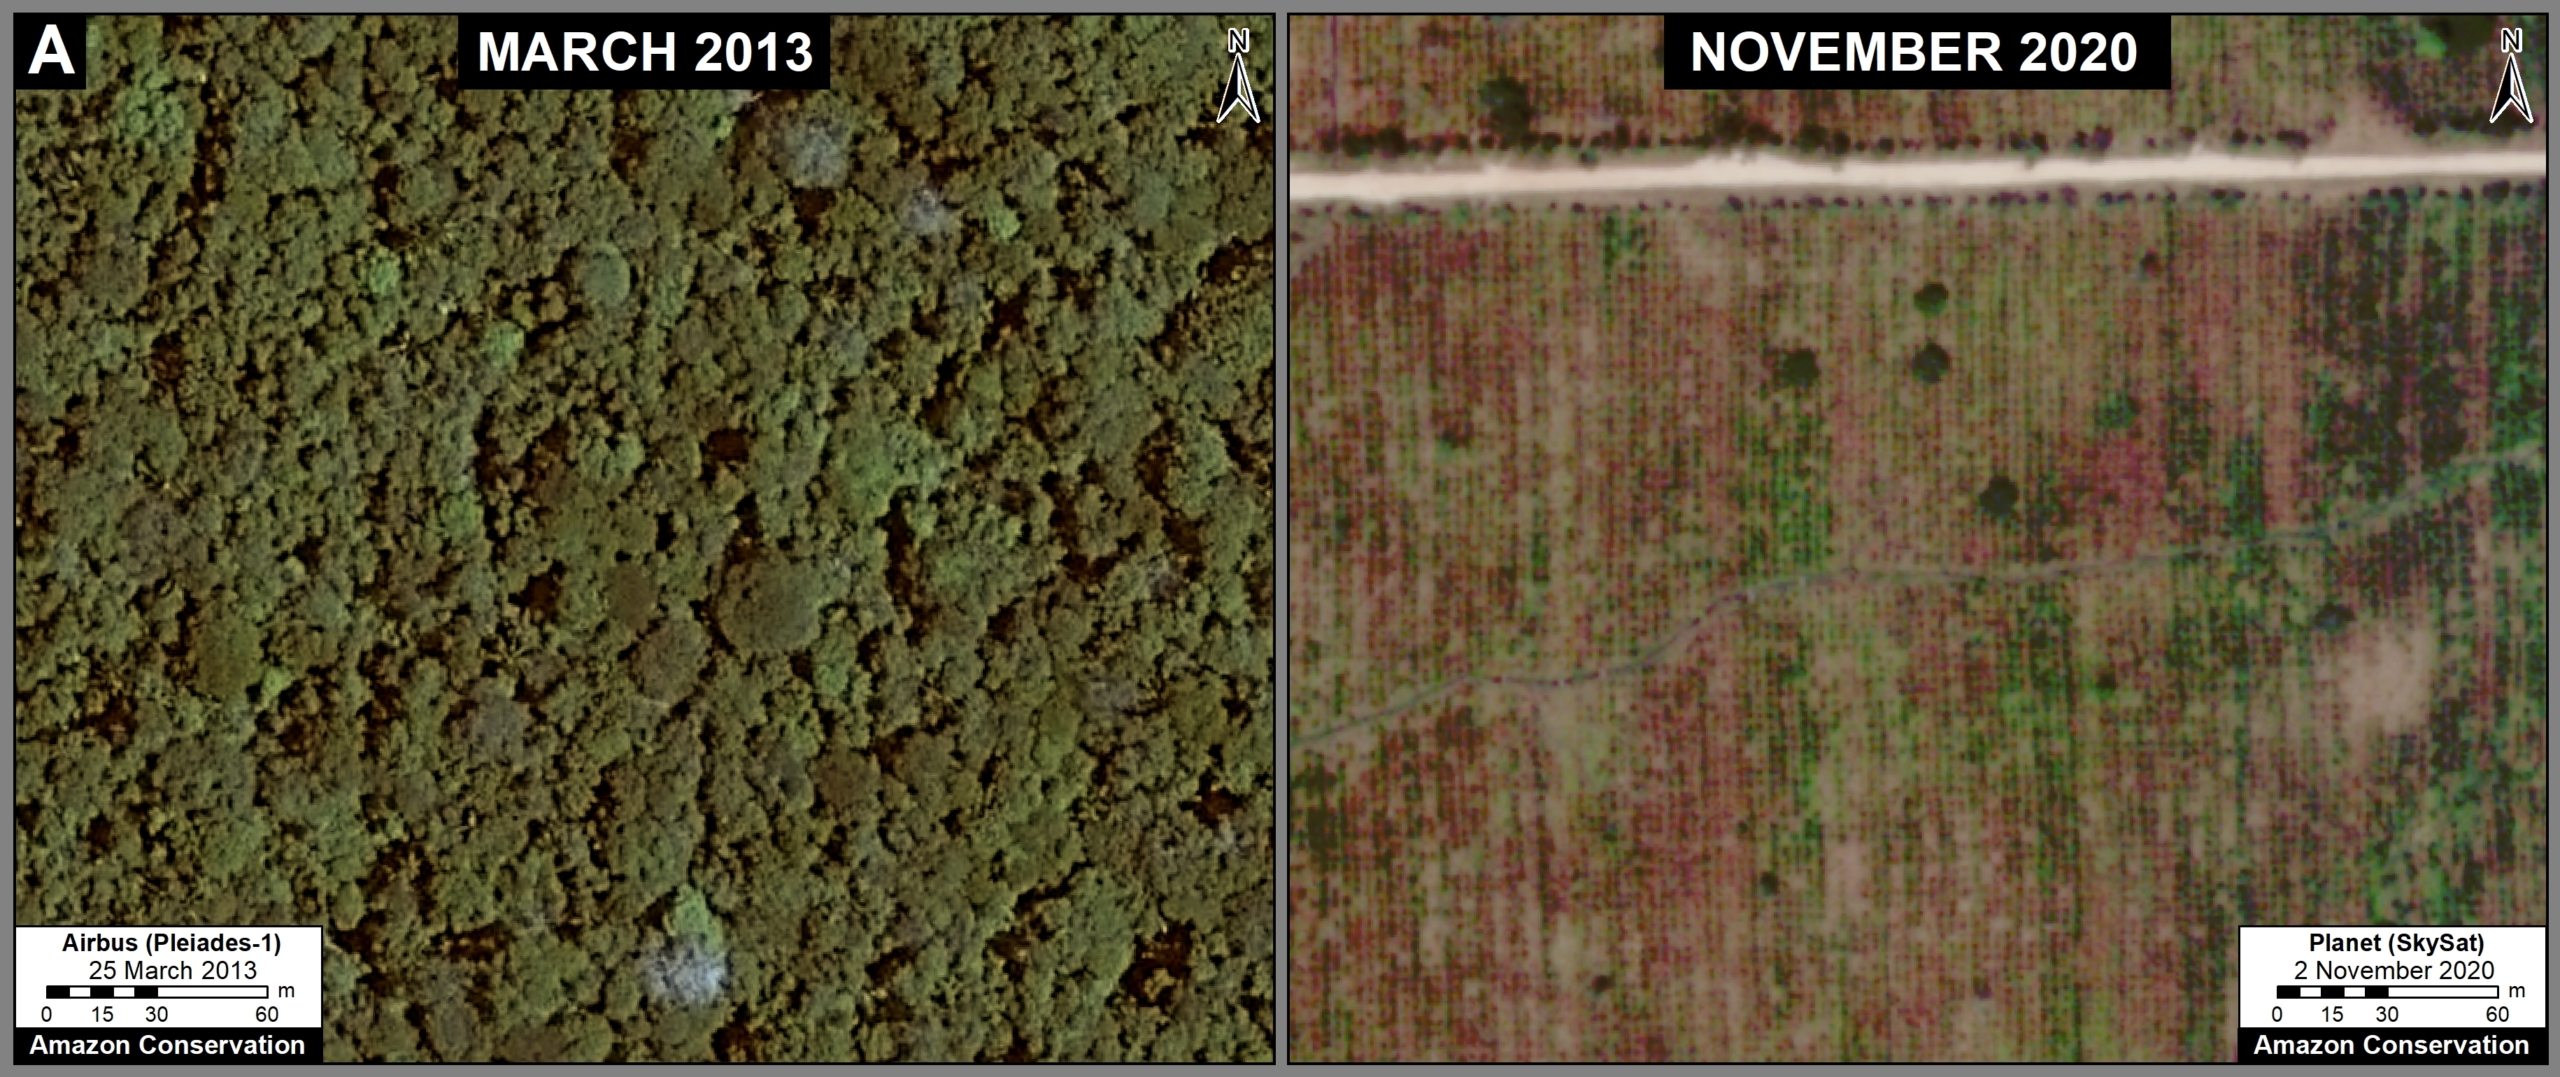
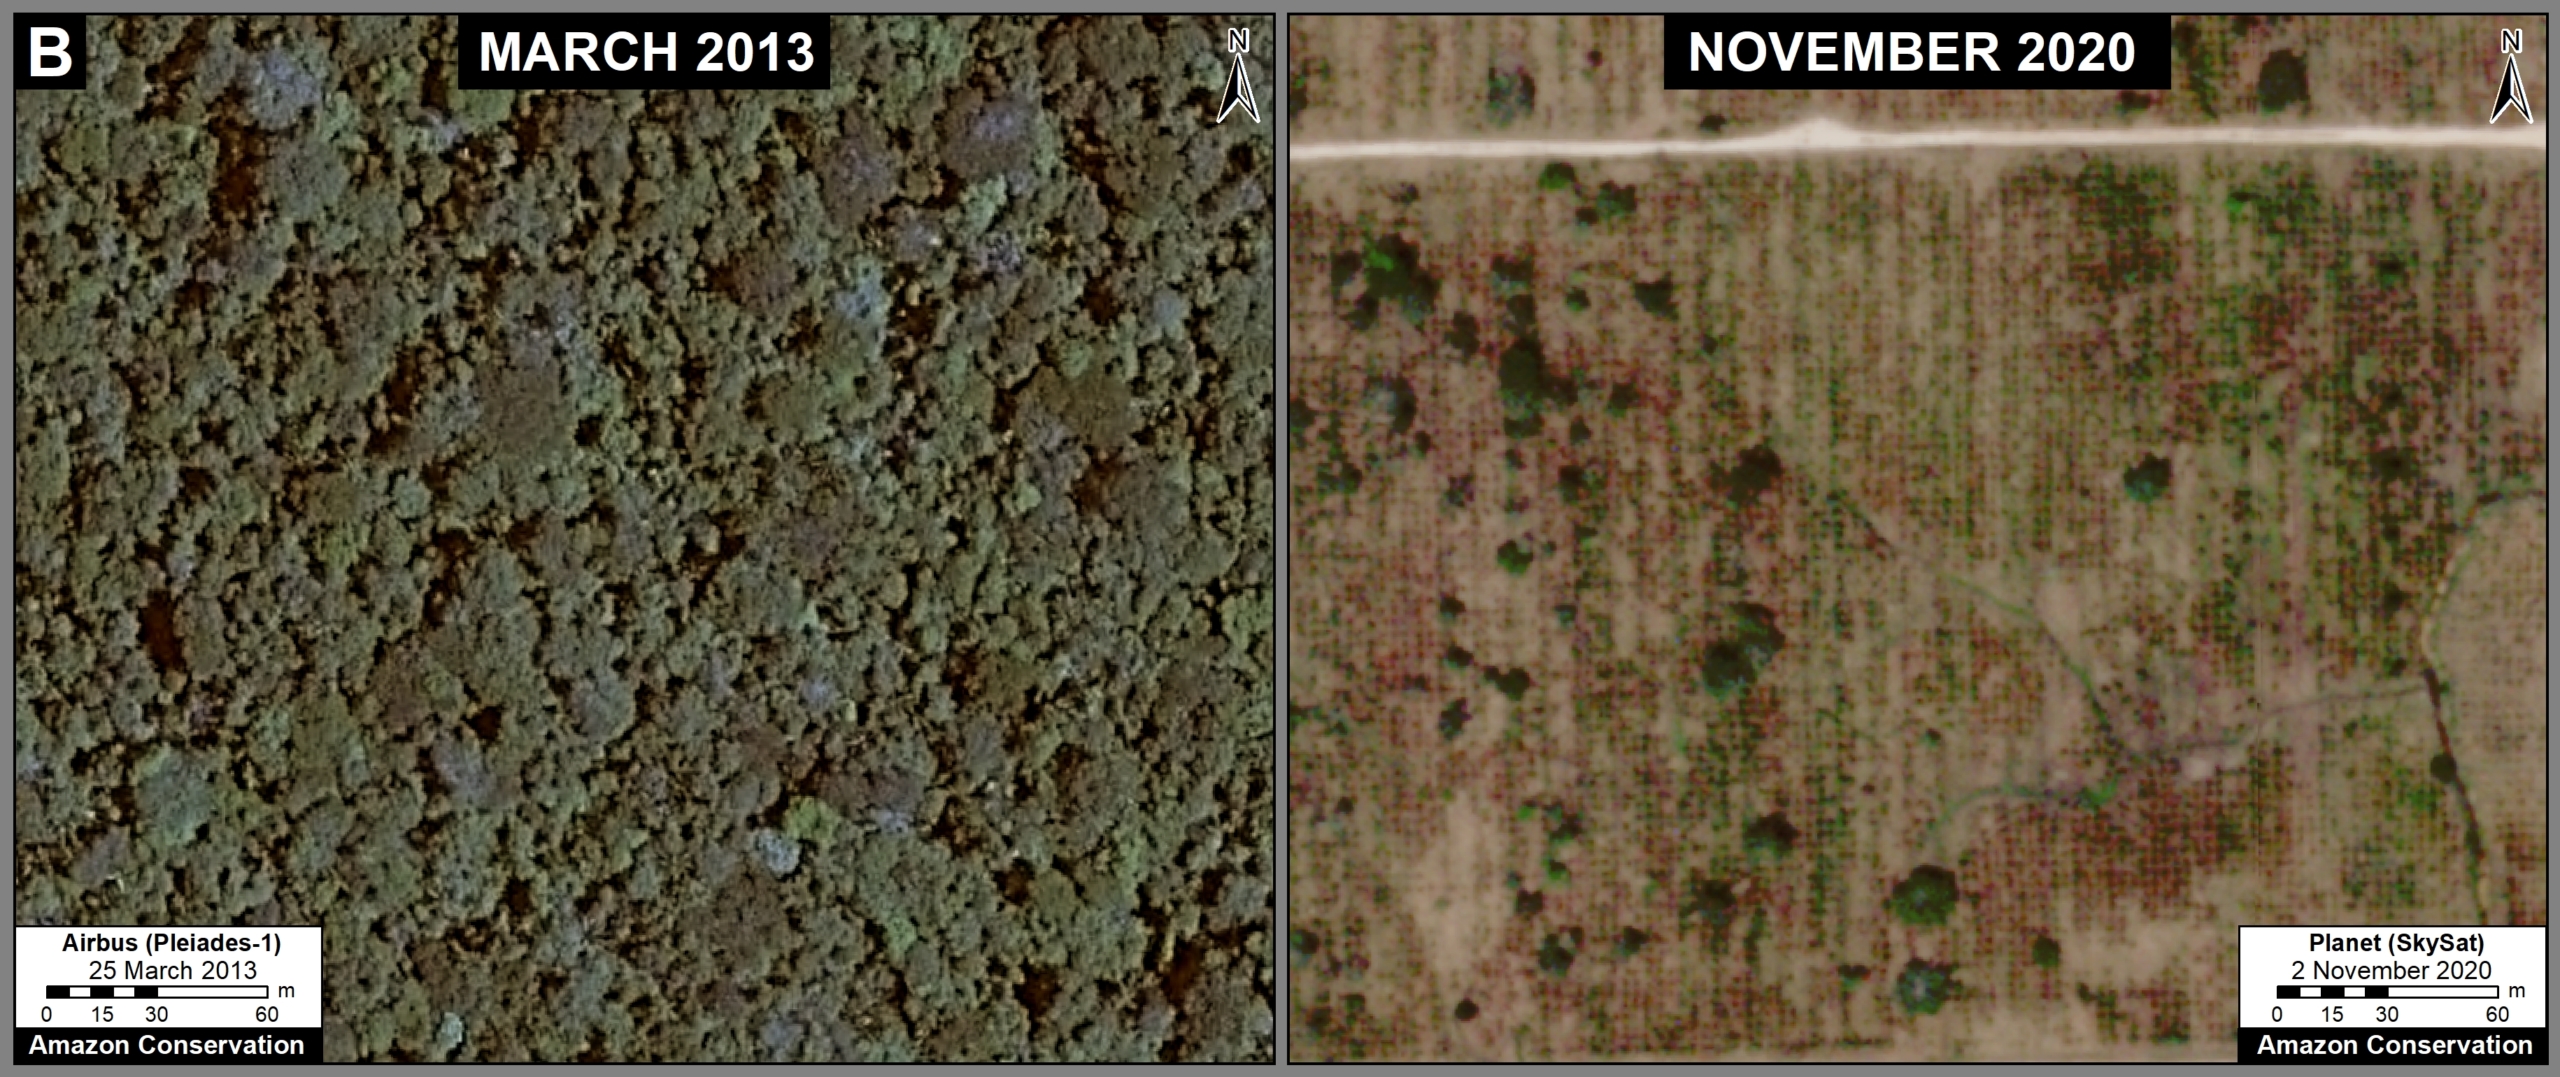
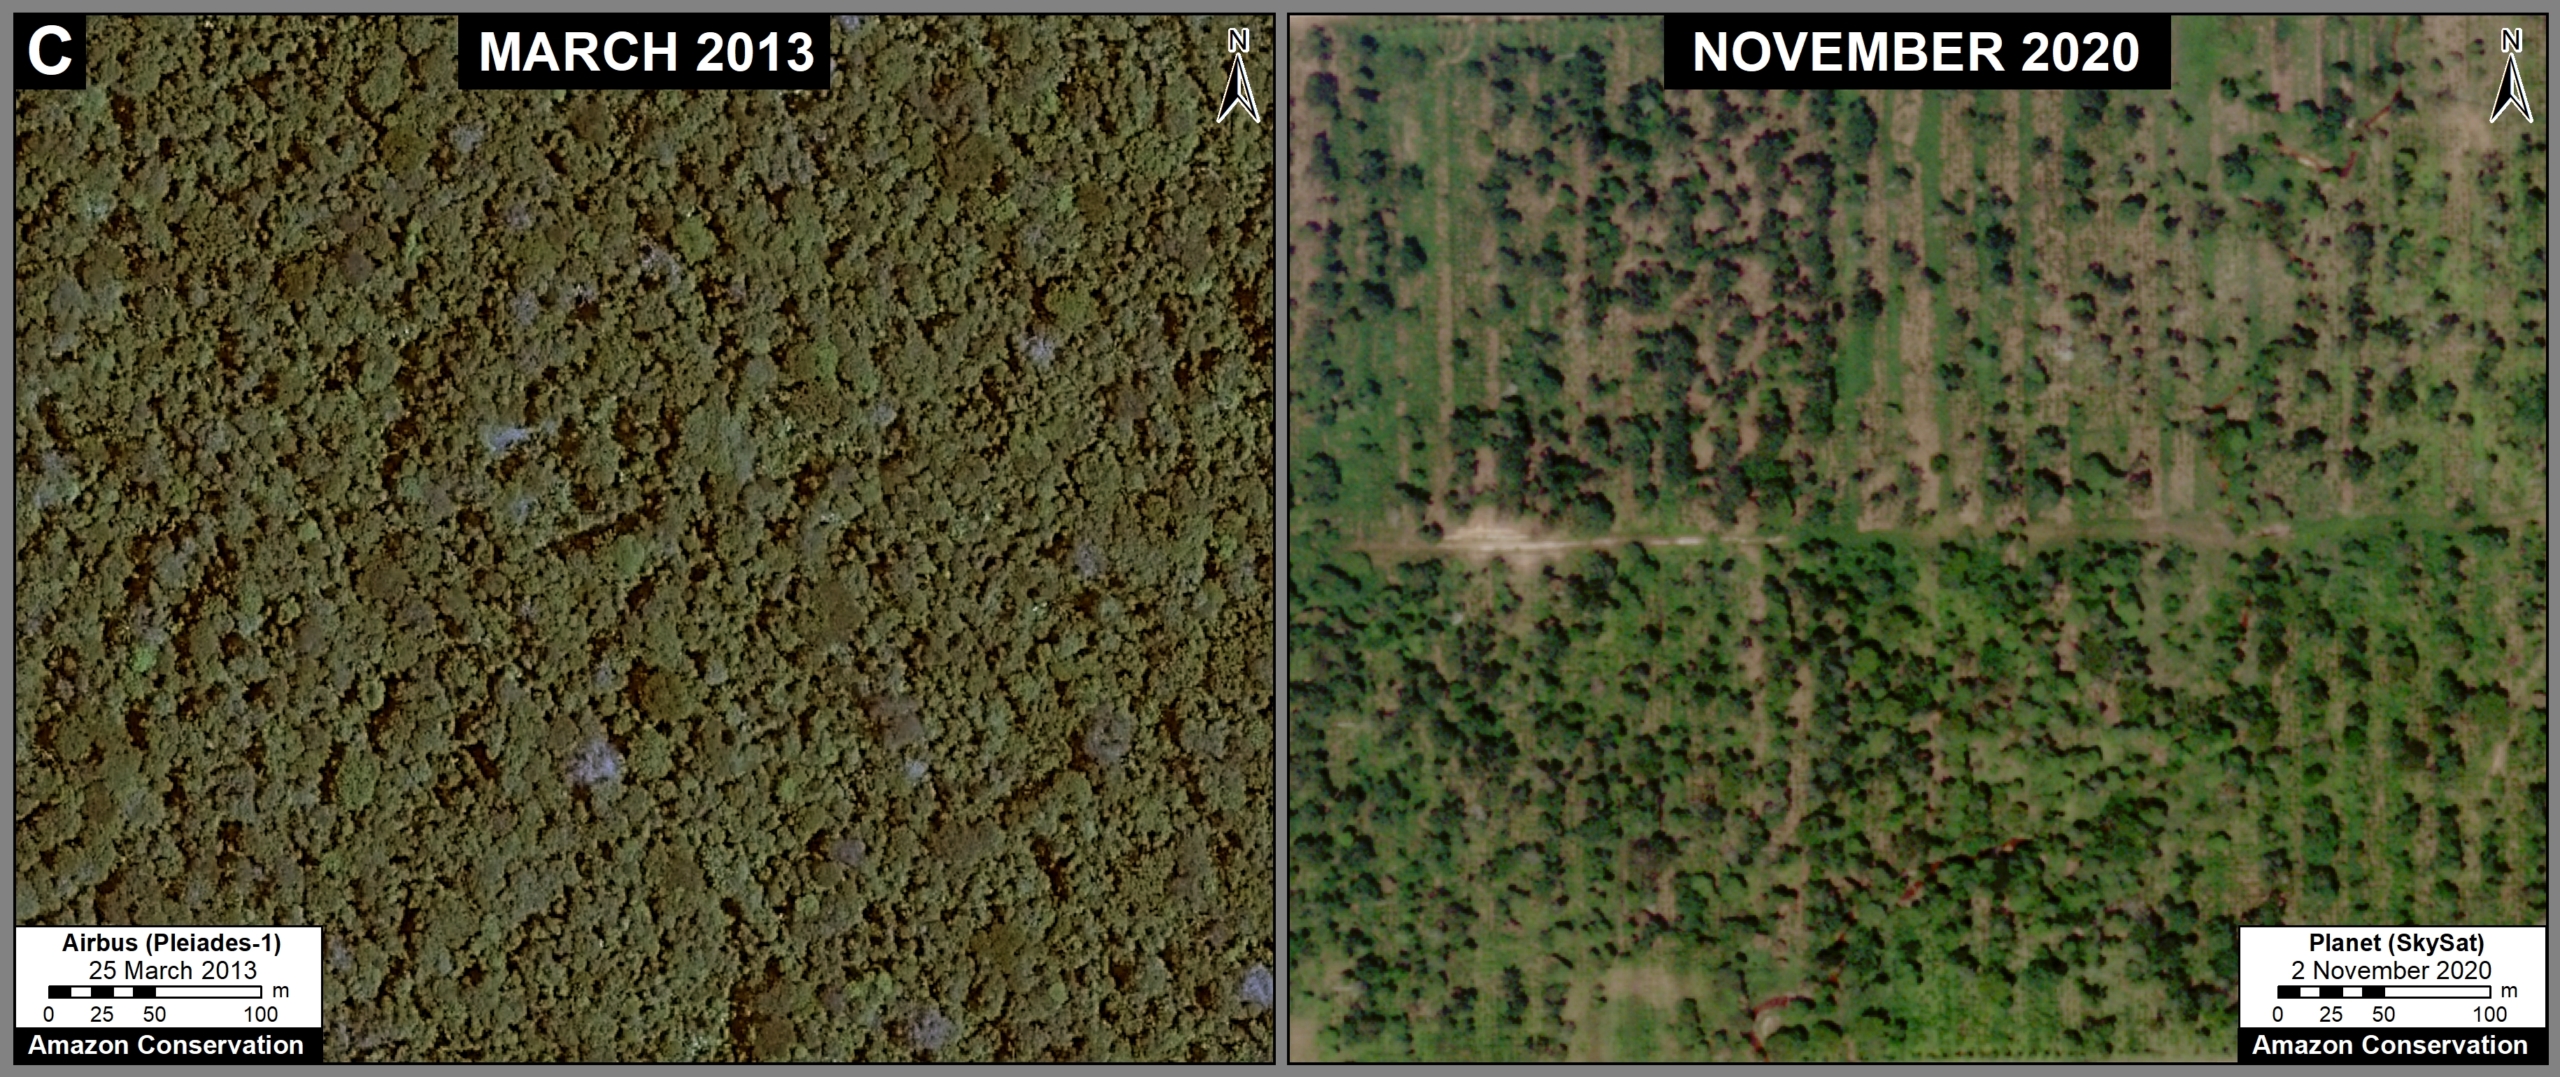
Images 4-6 show current cacao crops (right panel) in areas that, seven years ago, were primary forest (left panel).

Image 4. Current cacao crops (right panel) in areas that, seven years ago, were primary forest (left panel). Data: Planet, Airbus. First time published. Click to enlarge.
Image 5. Current cacao crops (right panel) in areas that, seven years ago, were primary forest (left panel). Data: Planet, Airbus. First time published. Click to enlarge.
Image 6. Current cacao crops (right panel) in areas that, seven years ago, were primary forest (left panel). Data: Planet, Airbus. First time published. Click to enlarge.

Current Policy Situation

In 2014, the Ministry of Agriculture (MINAGRI) ordered United Cacao (Cacao del Perú Norte SAC) to halt its development and production activities, but the company did not comply.

In 2019, MINAGRI rejection the Program for  Adequacy and Environmental Management (PAMA) presented by the company that took over the operation, Tamshi S.A.C. The PAMA is a type of environmental impact evaluation for projects already in operation.

Also in 2019, environmental enforcement of the case was transferred from MINAGRI to the Agency for Environmental Assessment and Enforcement (OEFA).

Most recently, OEFA issued a major fine, equivalent to around $35 million, to the company Tamshi S.A.C. for carrying out activities without having an approved environmental management plan. OEFA also issued 17 corrective measures, one of which was the immediate stoppage of activities.

Acknowledgments

We thank C. Ipenza, A. Felix, C. Noriega, S. Novoa, and G. Palacios for their helpful comments on this report.

This report was conducted with technical assistance from USAID, via the Prevent project. Prevent is an initiative that, over the next 5 years, will work with the Government of Peru, civil society, and the private sector to prevent and combat environmental crimes in Loreto, Ucayali and Madre de Dios, in order to conserve the Peruvian Amazon.

This publication is made possible with the support of the American people through USAID. Its content is the sole responsibility of the authors and does not necessarily reflect the views of USAID or the US government.

This work was also supported by NORAD (Norwegian Agency for Development Cooperation), and ICFC (International Conservation Fund of Canada), and EROL Foundation.

Citation

Finer M, Mamani N (2020) United Cacao Case – 7 Years After Massive Deforestation in the Peruvian Amazon. MAAP: 128.

MAAP #127: Mennonite Colonies Continue Major Deforestation in Peruvian Amazon

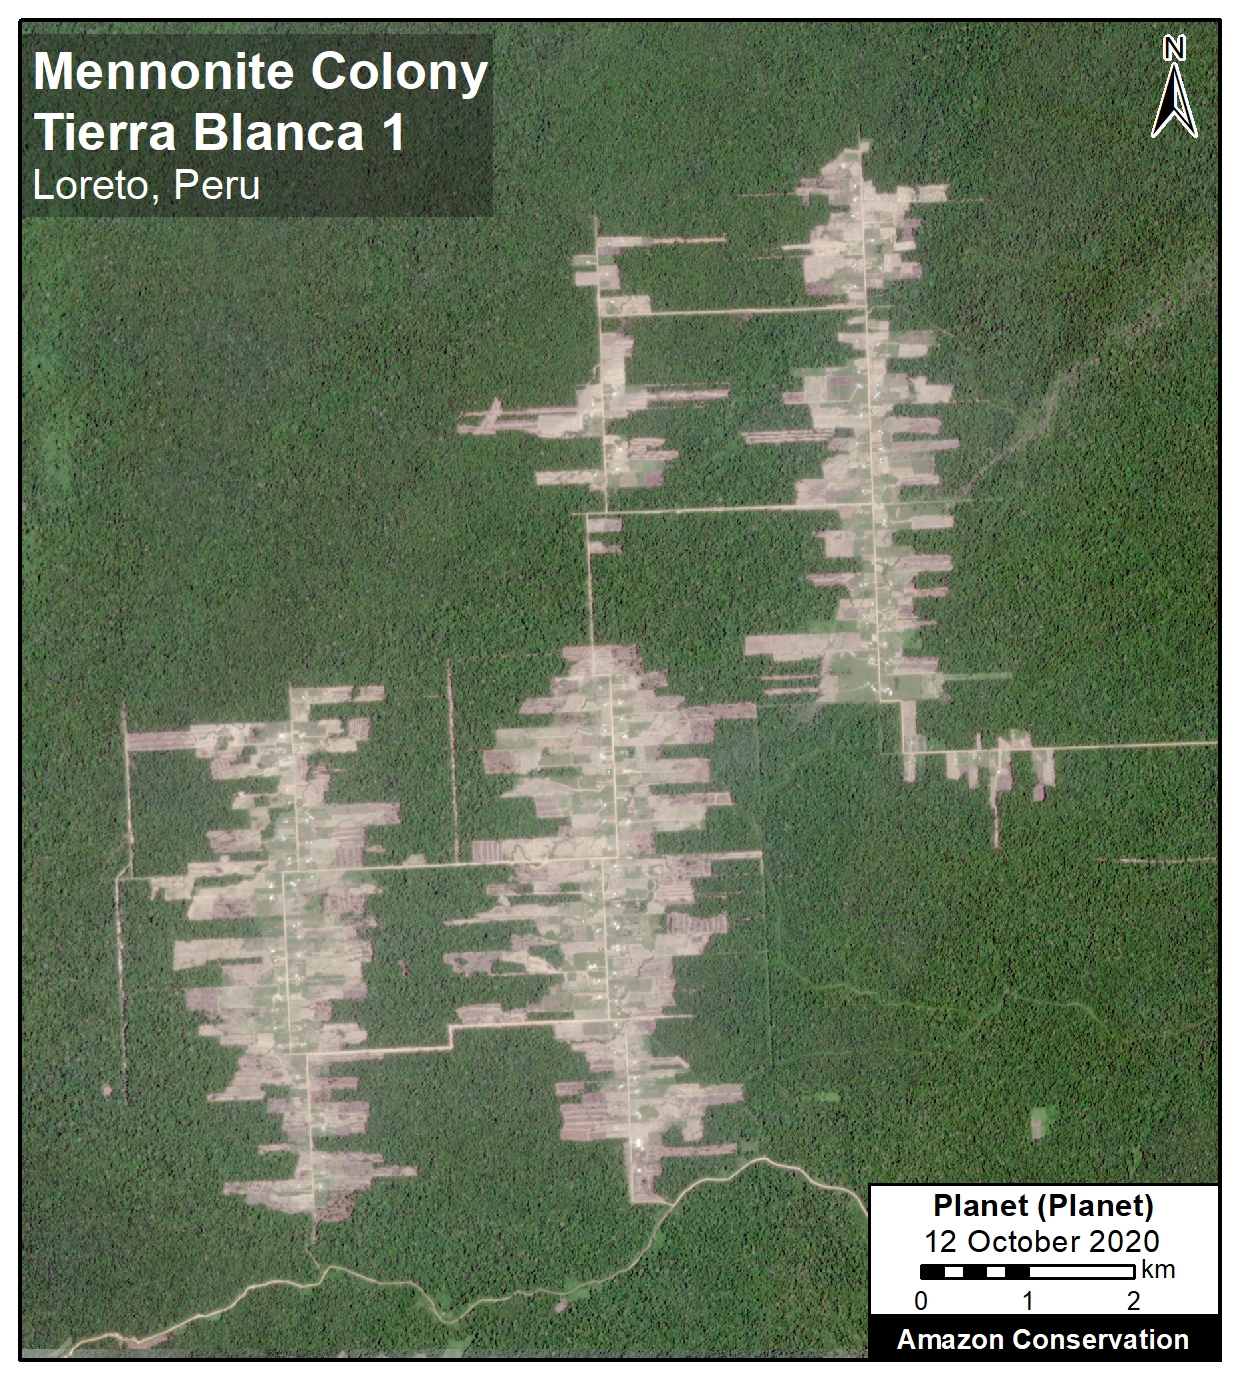
Recent deforestation associated with the Mennonite colony Tierra Blanca 1, in Loreto, Peru. Data: Planet

The Mennonites, a religious group often associated with organized agricultural activity, have started three new colonies in the Peruvian Amazon.

We have documented the deforestation of 8,500 acres (3,440 hectares) in these three colonies over the past four years (updated October 2020).

The deforestation started in 2017, but continues to be active in 2020 (with 1,900 acres lost, 25% of the total).

Notably, this combined Mennonite deforestation now exceeds the total loss from the infamous United Cacao case (2,400 hectares), one of the last major controversial large-scale deforestation cases in the Peruvian Amazon (MAAP #27).

Moreover, there are strong indications that the deforestation associated with these three Mennonite colonies is illegal (see Legality Statement below).

Below, we present the following:

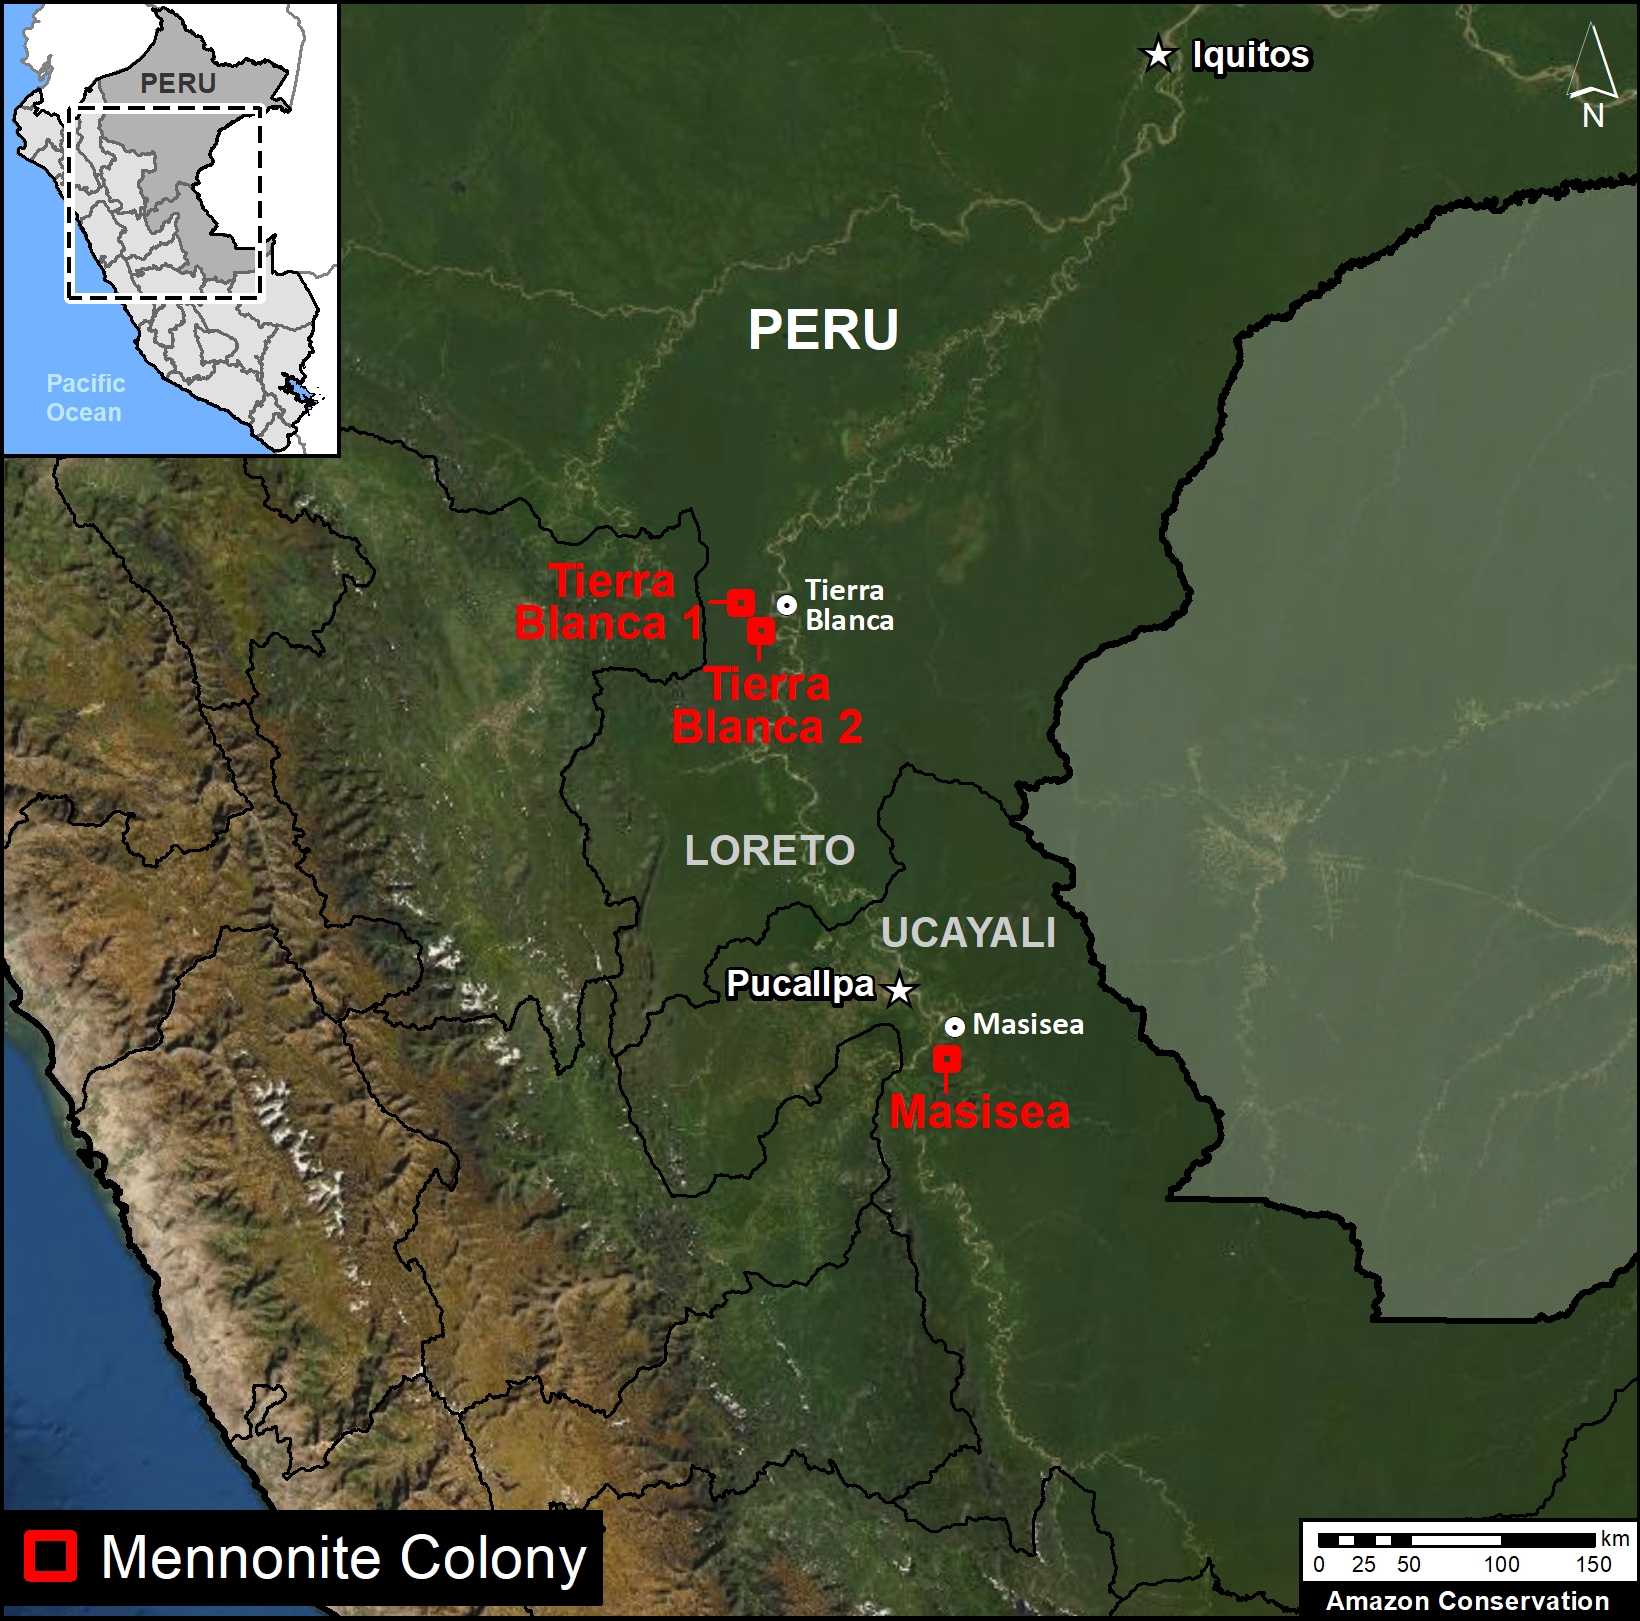
  • A Base Map showing the location of the three new Mennonite colonies in the Peruvian Amazon.
  • A series of satellite images showing the recent deforestation in the most active colony (Tierra Blanca 1), including a very high resolution (0.5 meter) Skysat image.
  • a Legality Statement.
  • A graphic showing that the deforested area was not previously cleared (that is, it was intact forest).


Base Map. Location of the three new Mennonite Colonies in the Peruvian Amazon. Data: MAAP.

Base Map

The Base Map shows the location of the three new Mennonite colonies in the Peruvian Amazon.

Two colonies are located near the town of Tierra Blanca in the northern Peruvian Amazon (Loreto region).

The other colony is located near the town of Masisea in the central Peruvian Amazon (Ucayali region).

Of the total deforestation (8,500 acres):

  • 63% (5,370 acres) is from the colony Tierra Blanca 1;
  • 25% (2,145 acres) is from the colony Masisea;
  • 12% (990 acres) is from the colony Tierra Blanca 2.


Deforestation 2017-20

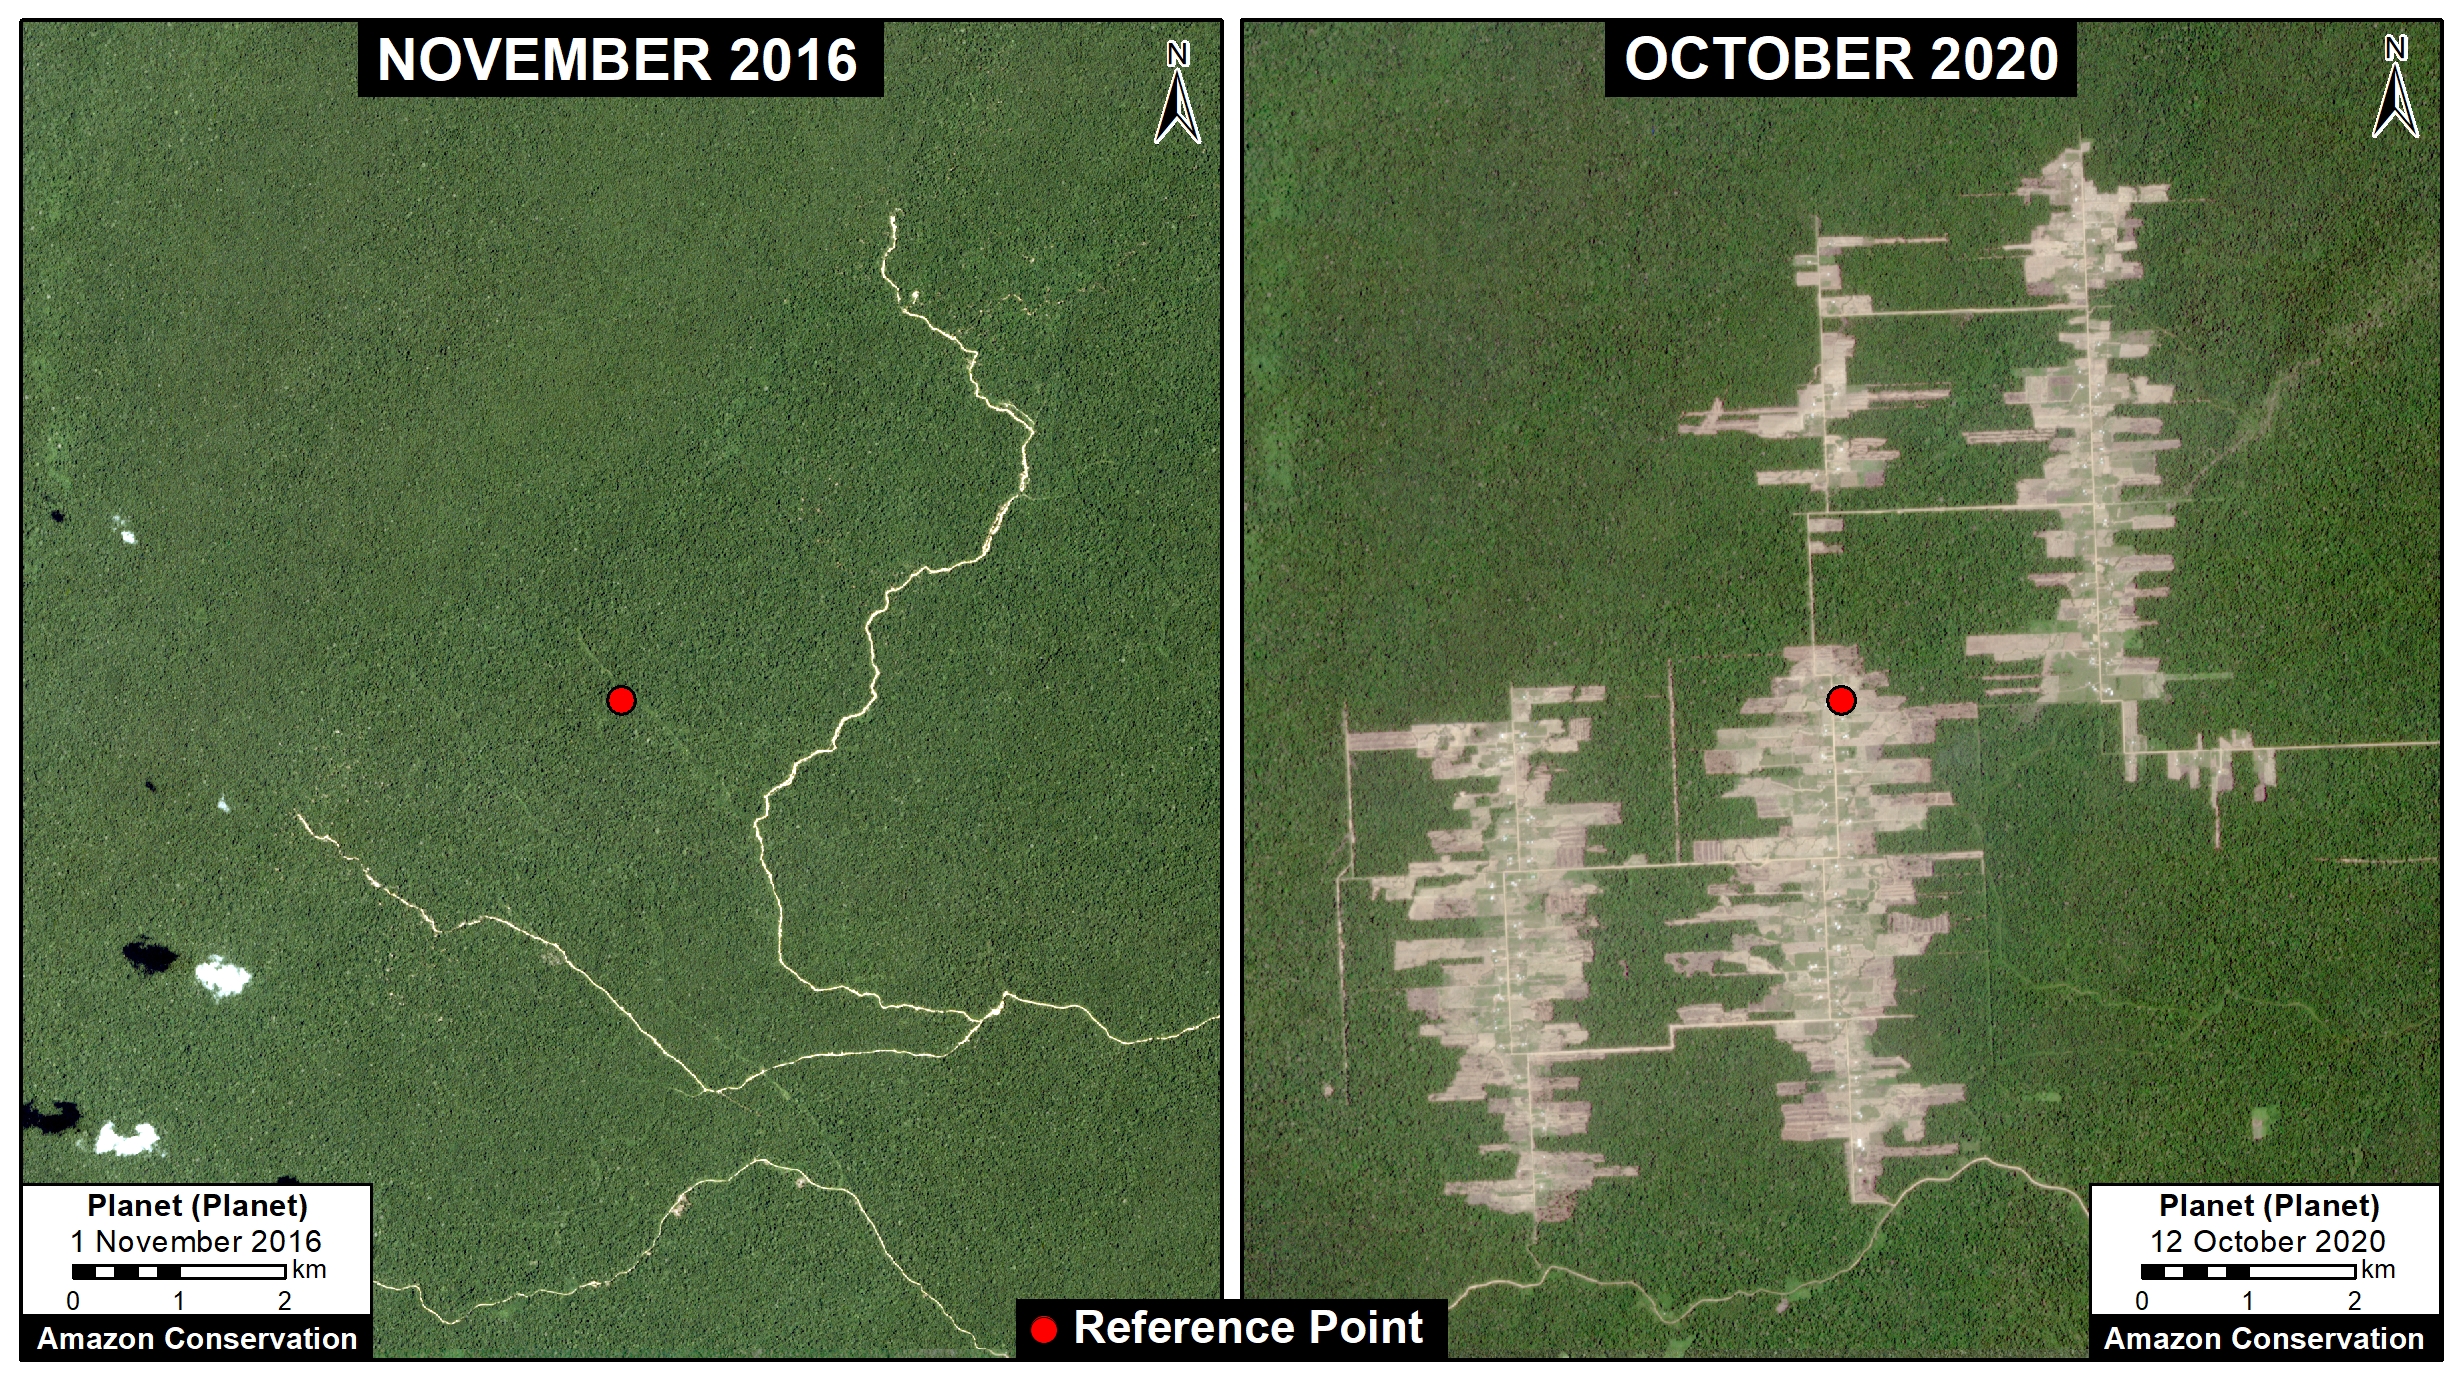
The following image shows the total deforestation of 5,370 acres (2,174 hectares) between November 2016 (left panel) and October 2020 (right panel), associated with the Mennonite colony Tierra Blanca 1. The red dot serves as a reference point between the two panels. Click to enlarge.

Deforestation between September 2016 (left panel) and October 2020 (right panel), associated with the Mennonite colony Tierra Blanca 1. Data: Planet, MAAP. Click to enlarge.

Deforestation 2020

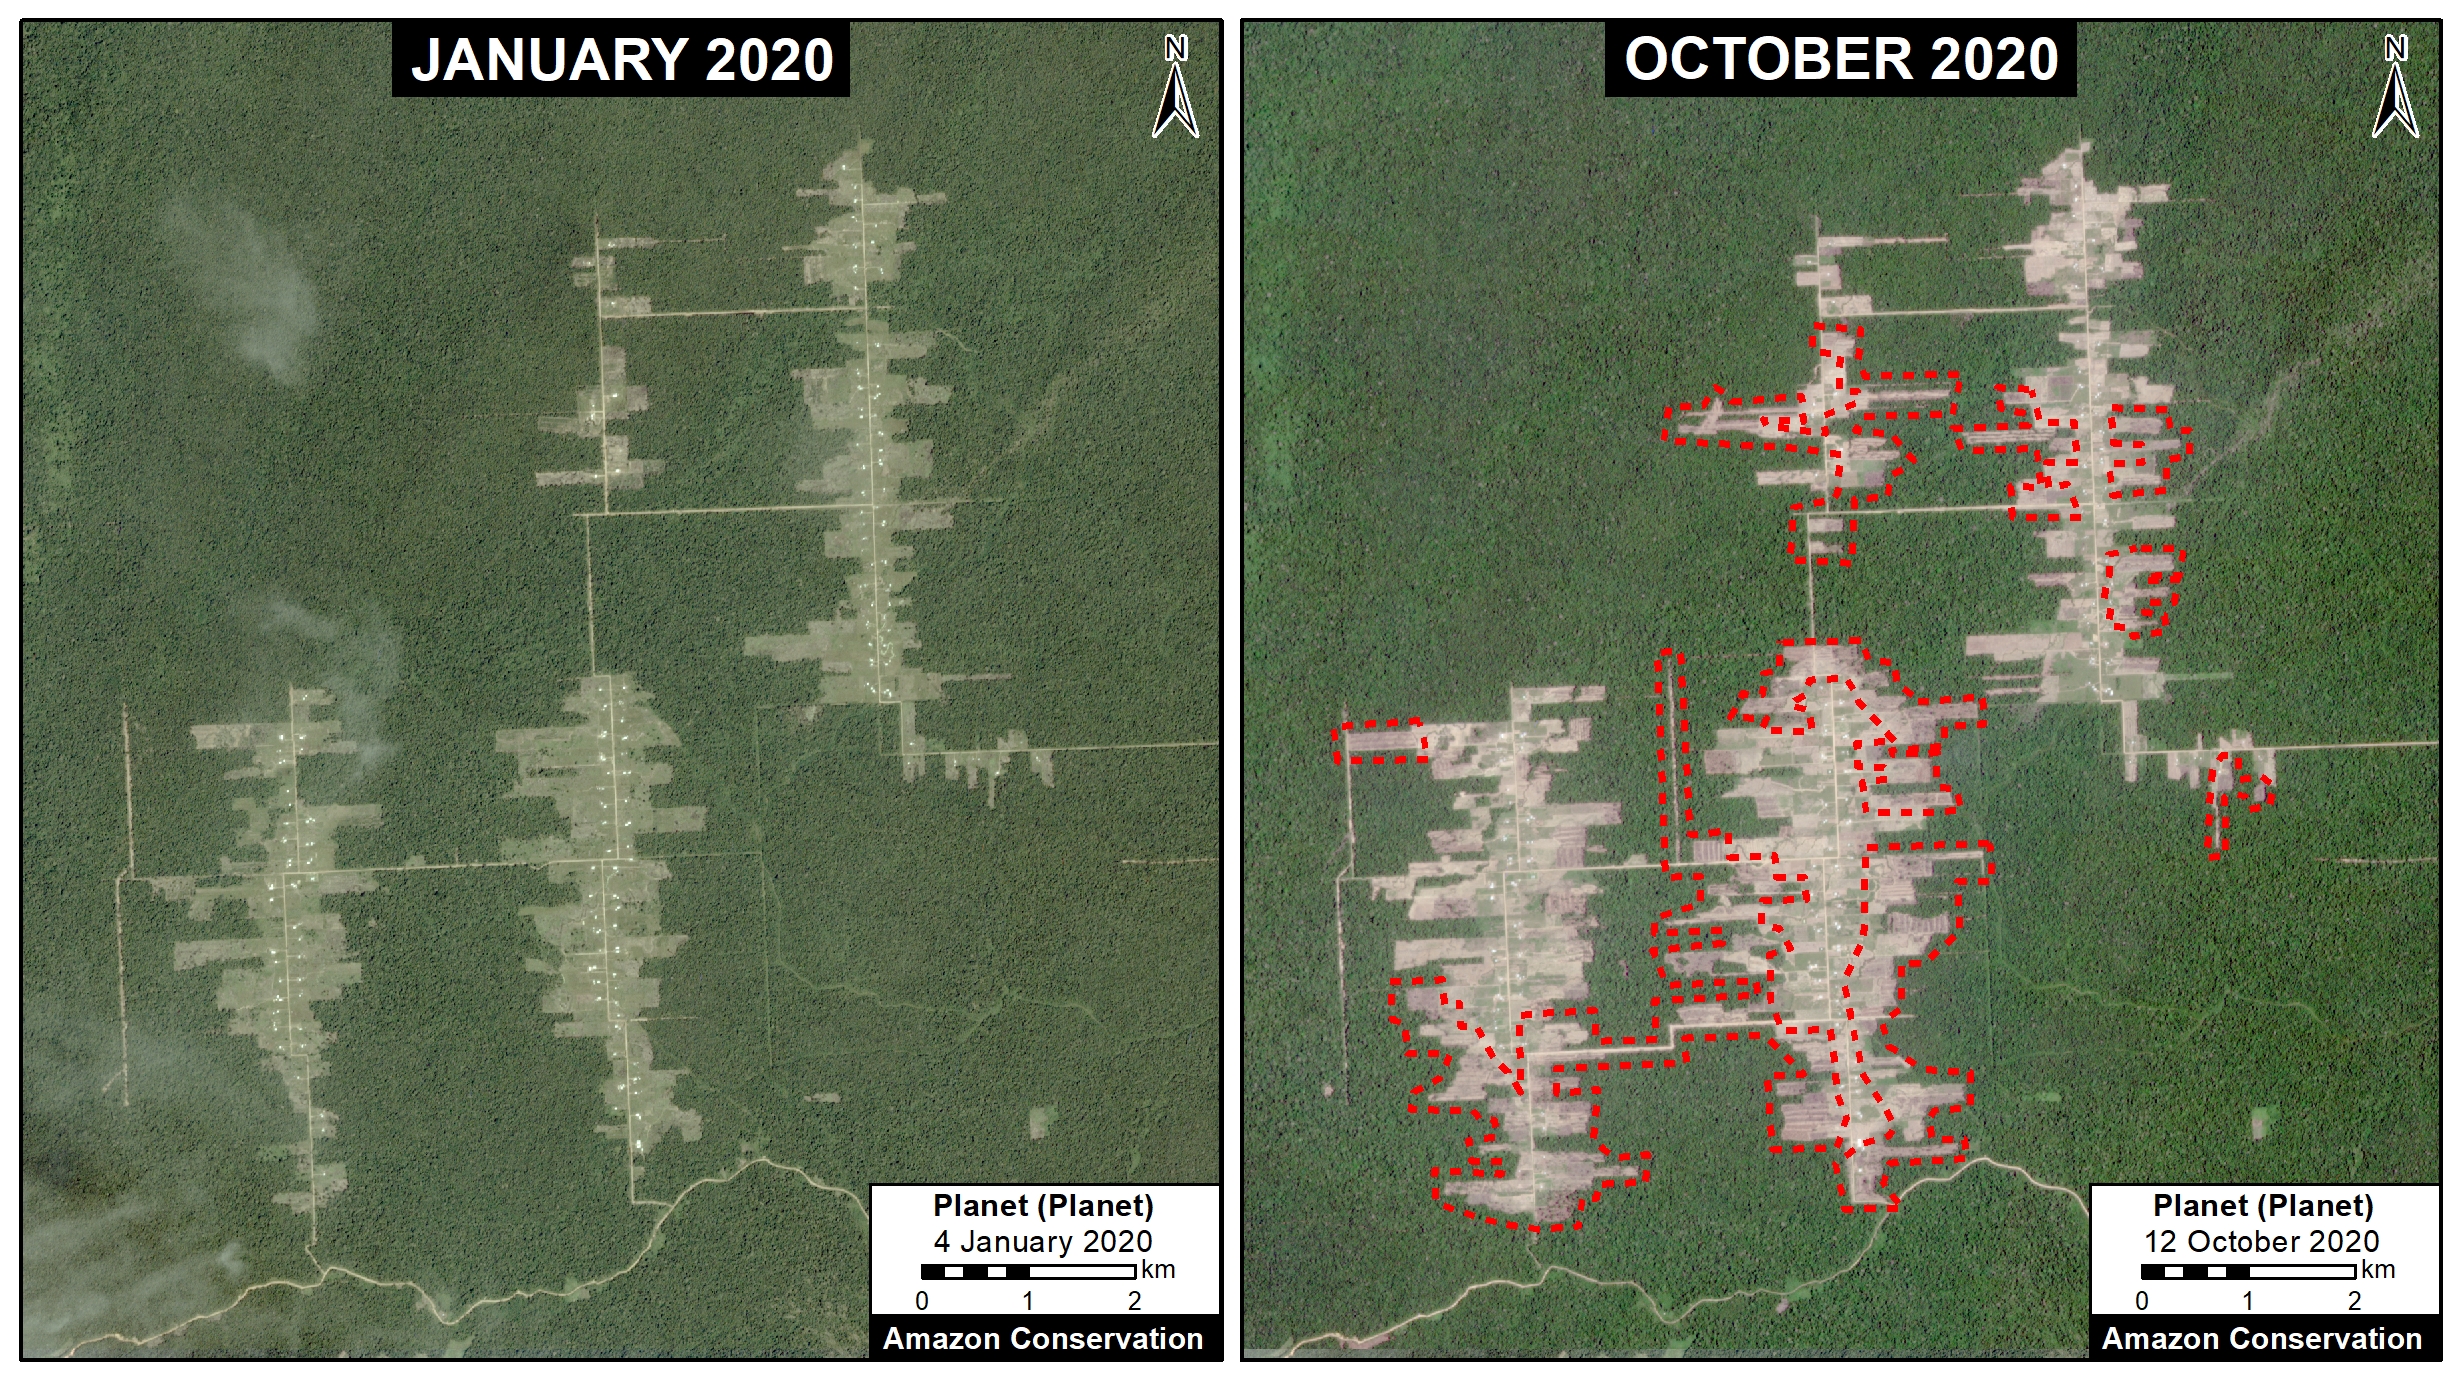
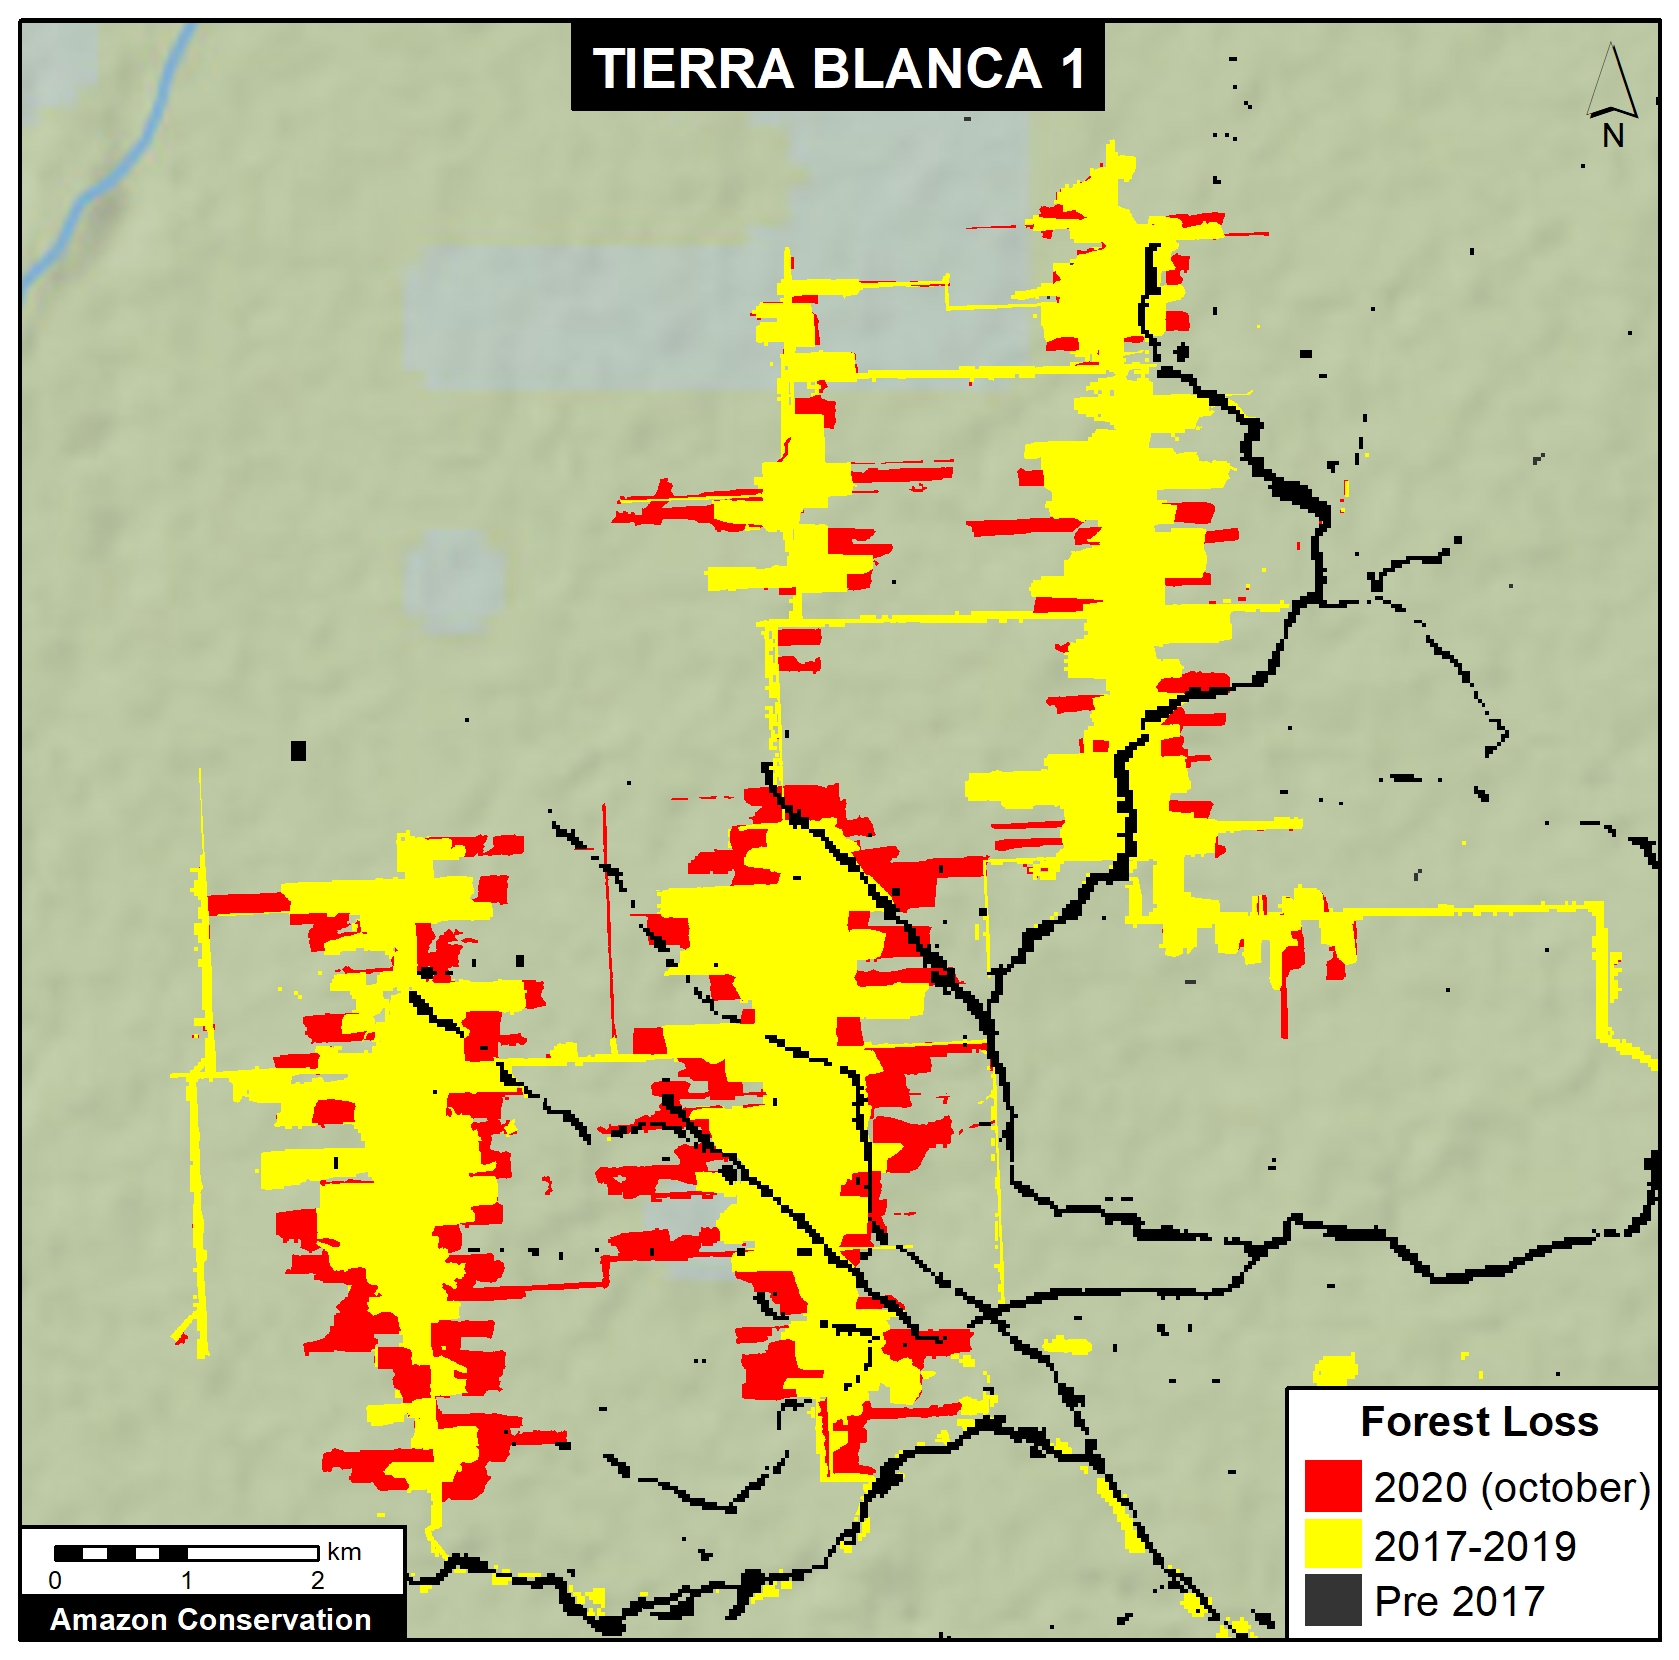
The following image shows the most recent deforestation of 1,540 acres (625 hectares) between January 2020 (left panel) and October 2020 (right panel), associated with the Tierra Blanca 1 Mennonite colony. The red lines indicate new 2020 deforestation. Also see the Annex below for a map of the 2020 deforestation in relation to previous 2017-19 deforestation. Click to enlarge.

Deforestation between January 2020 (left panel) and October 2020 (right panel), associated with the Mennonite colony Tierra Blanca 1. Data: Planet, MAAP. Click to enlarge.

Very High Resolution Satellite Image (Skysat)

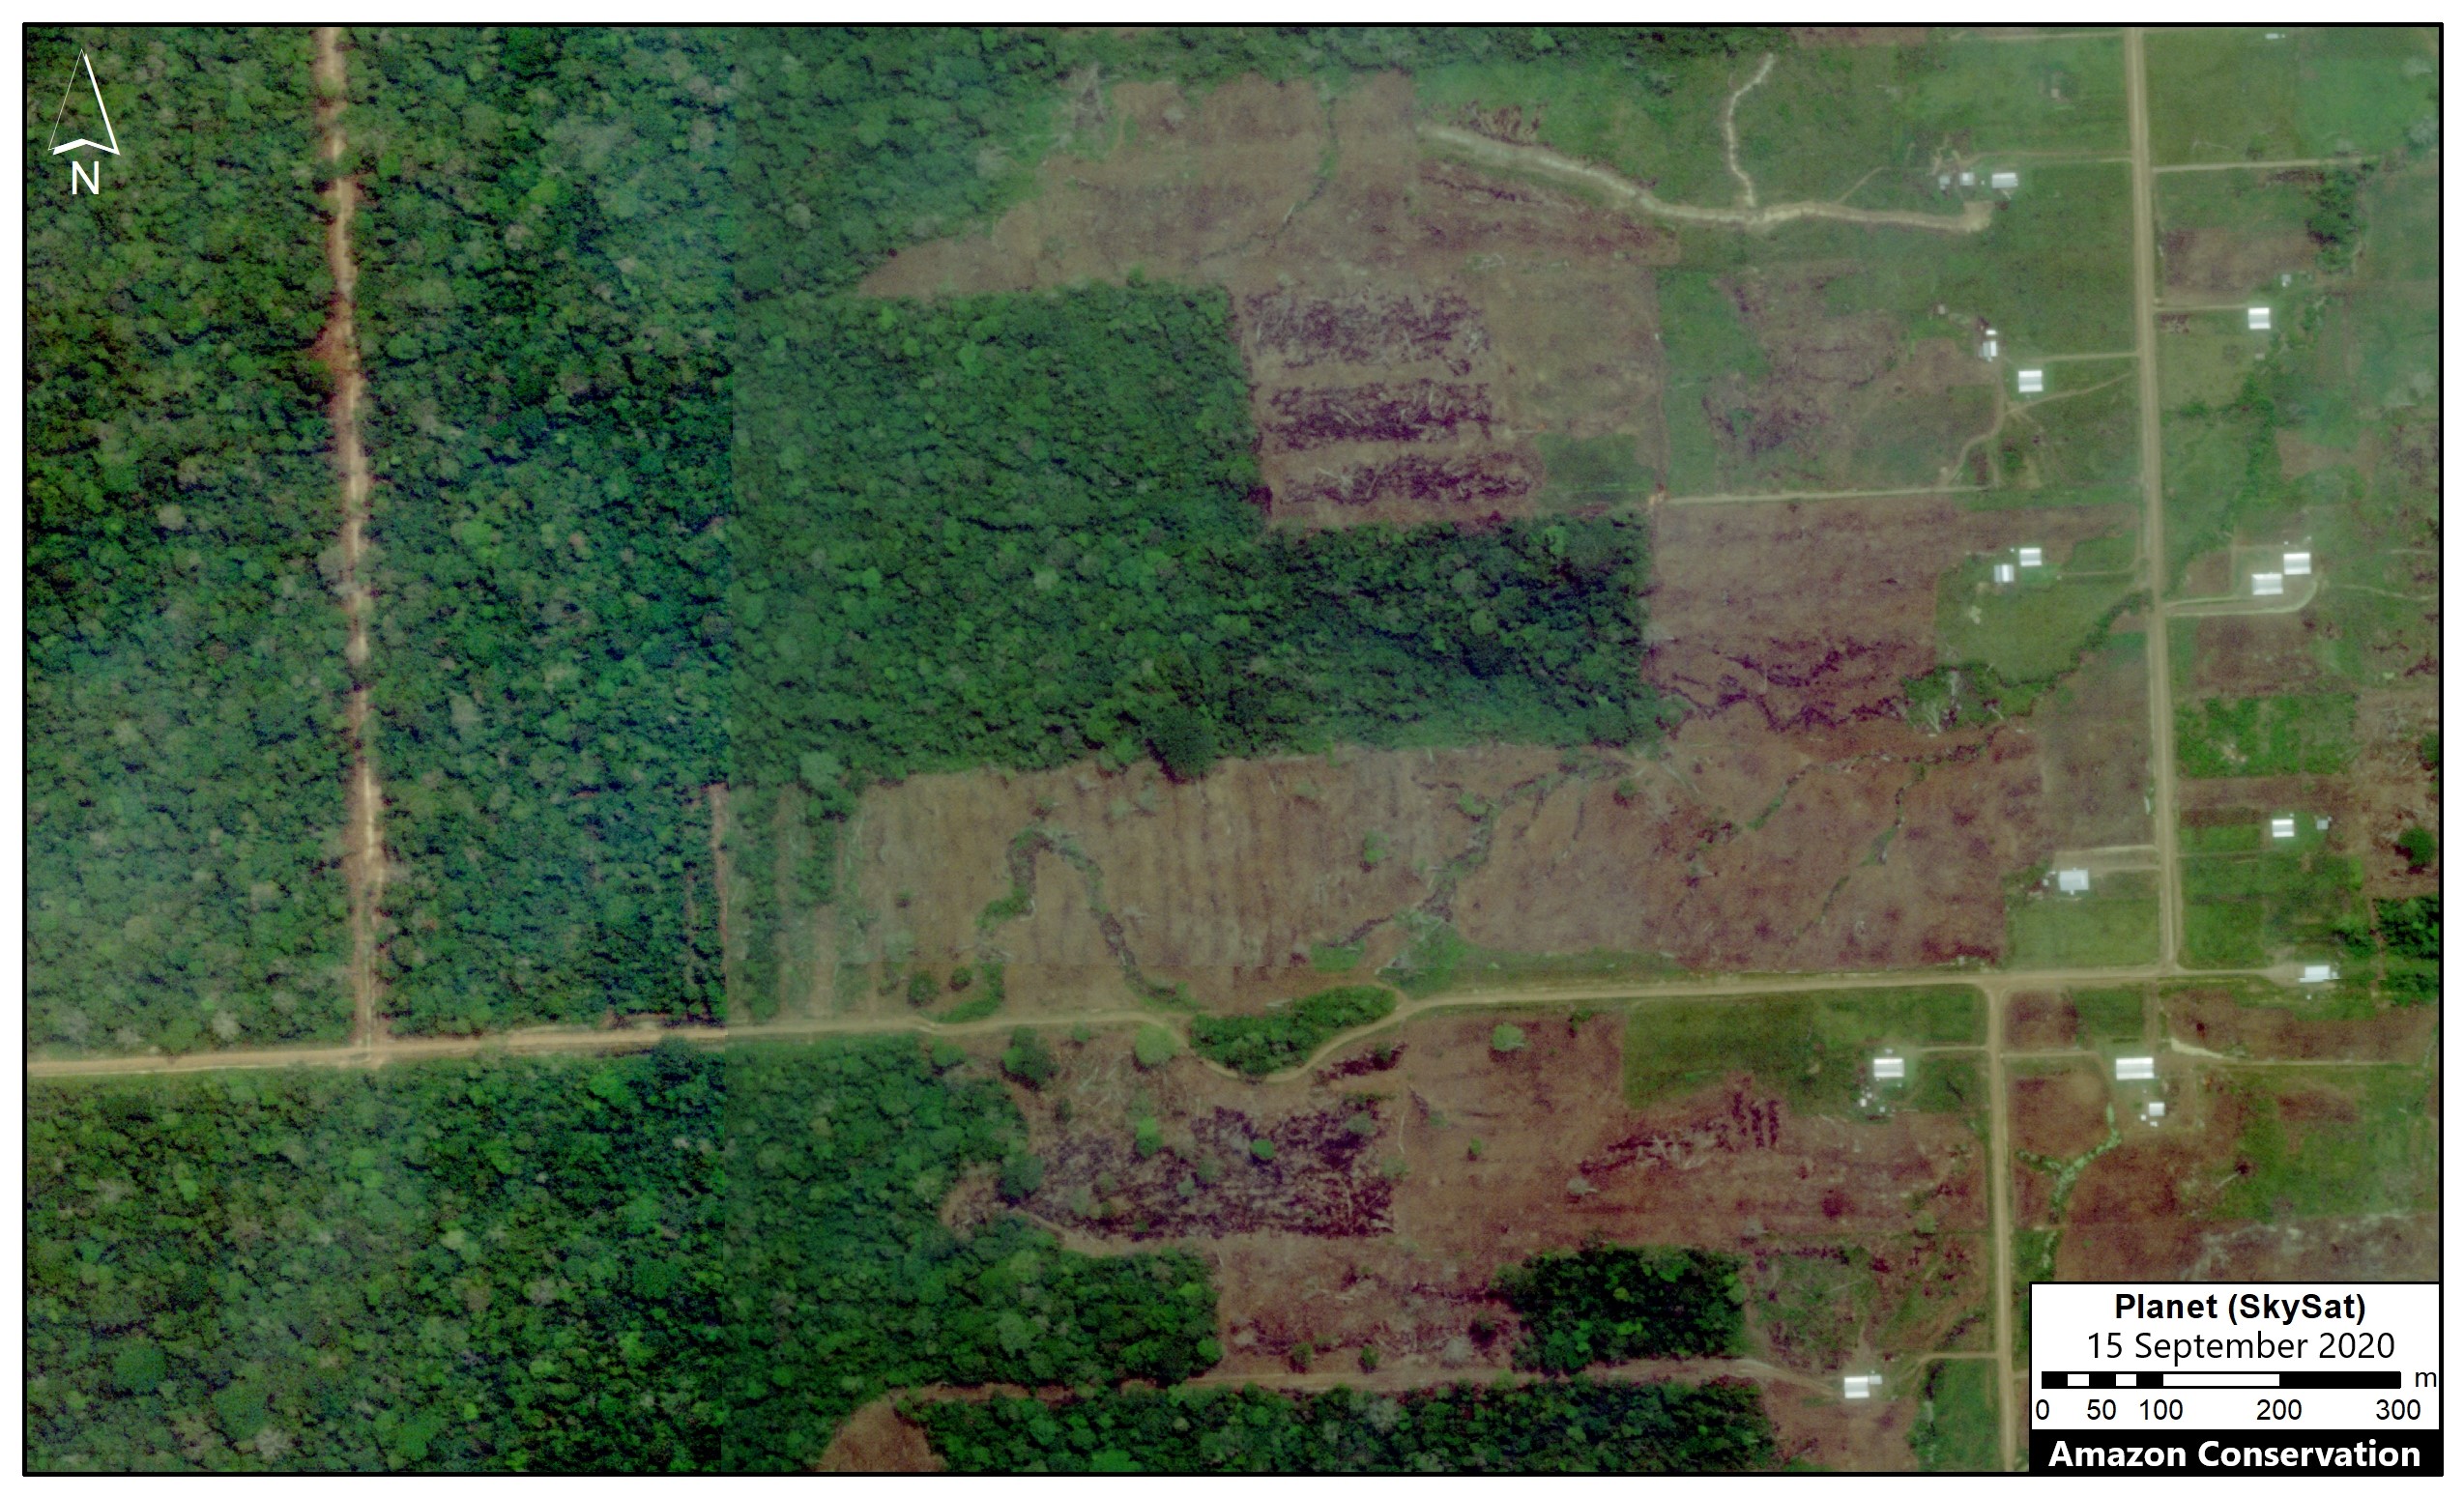
We recently obtained a very high resolution (0.5 meter) satellite image of the Tierra Blanca 1 colony, thanks to the company Planet and their Skysat fleet. The image allows enhanced visualization of some details of the deforested area, such as roads, buildings, and cleared land for likely agricultural activities. Click to enlarge.

Very high resolution satellite image (0.5 meters) over the Tierra Blanca 1 colony. Data: Planet (Skysat). Click to enlarge.

Legality Statement

Regarding the findings in Loreto (Tierra Blanca), we consulted with the Regional Government of Loreto who, in a document dated October 15, 2020, indicated that the Mennonite colonies do not have any approvals for the large-scale forest clearing in the area. The documented also indicated that they were coordinating with the environmental prosecutor’s office (known as FEMA) to investigate the case and its environmental impact.

Regarding the findings in Ucayali (Massisea), our investigations revealed that there is an investigation in progress by the environmental prosecutor’s office (FEMA). In addition, the regional government has initiated a sanctioning procedure for the alleged unauthorized land use change (deforestation) associated with Mennonite colony near Masisea.

Annex

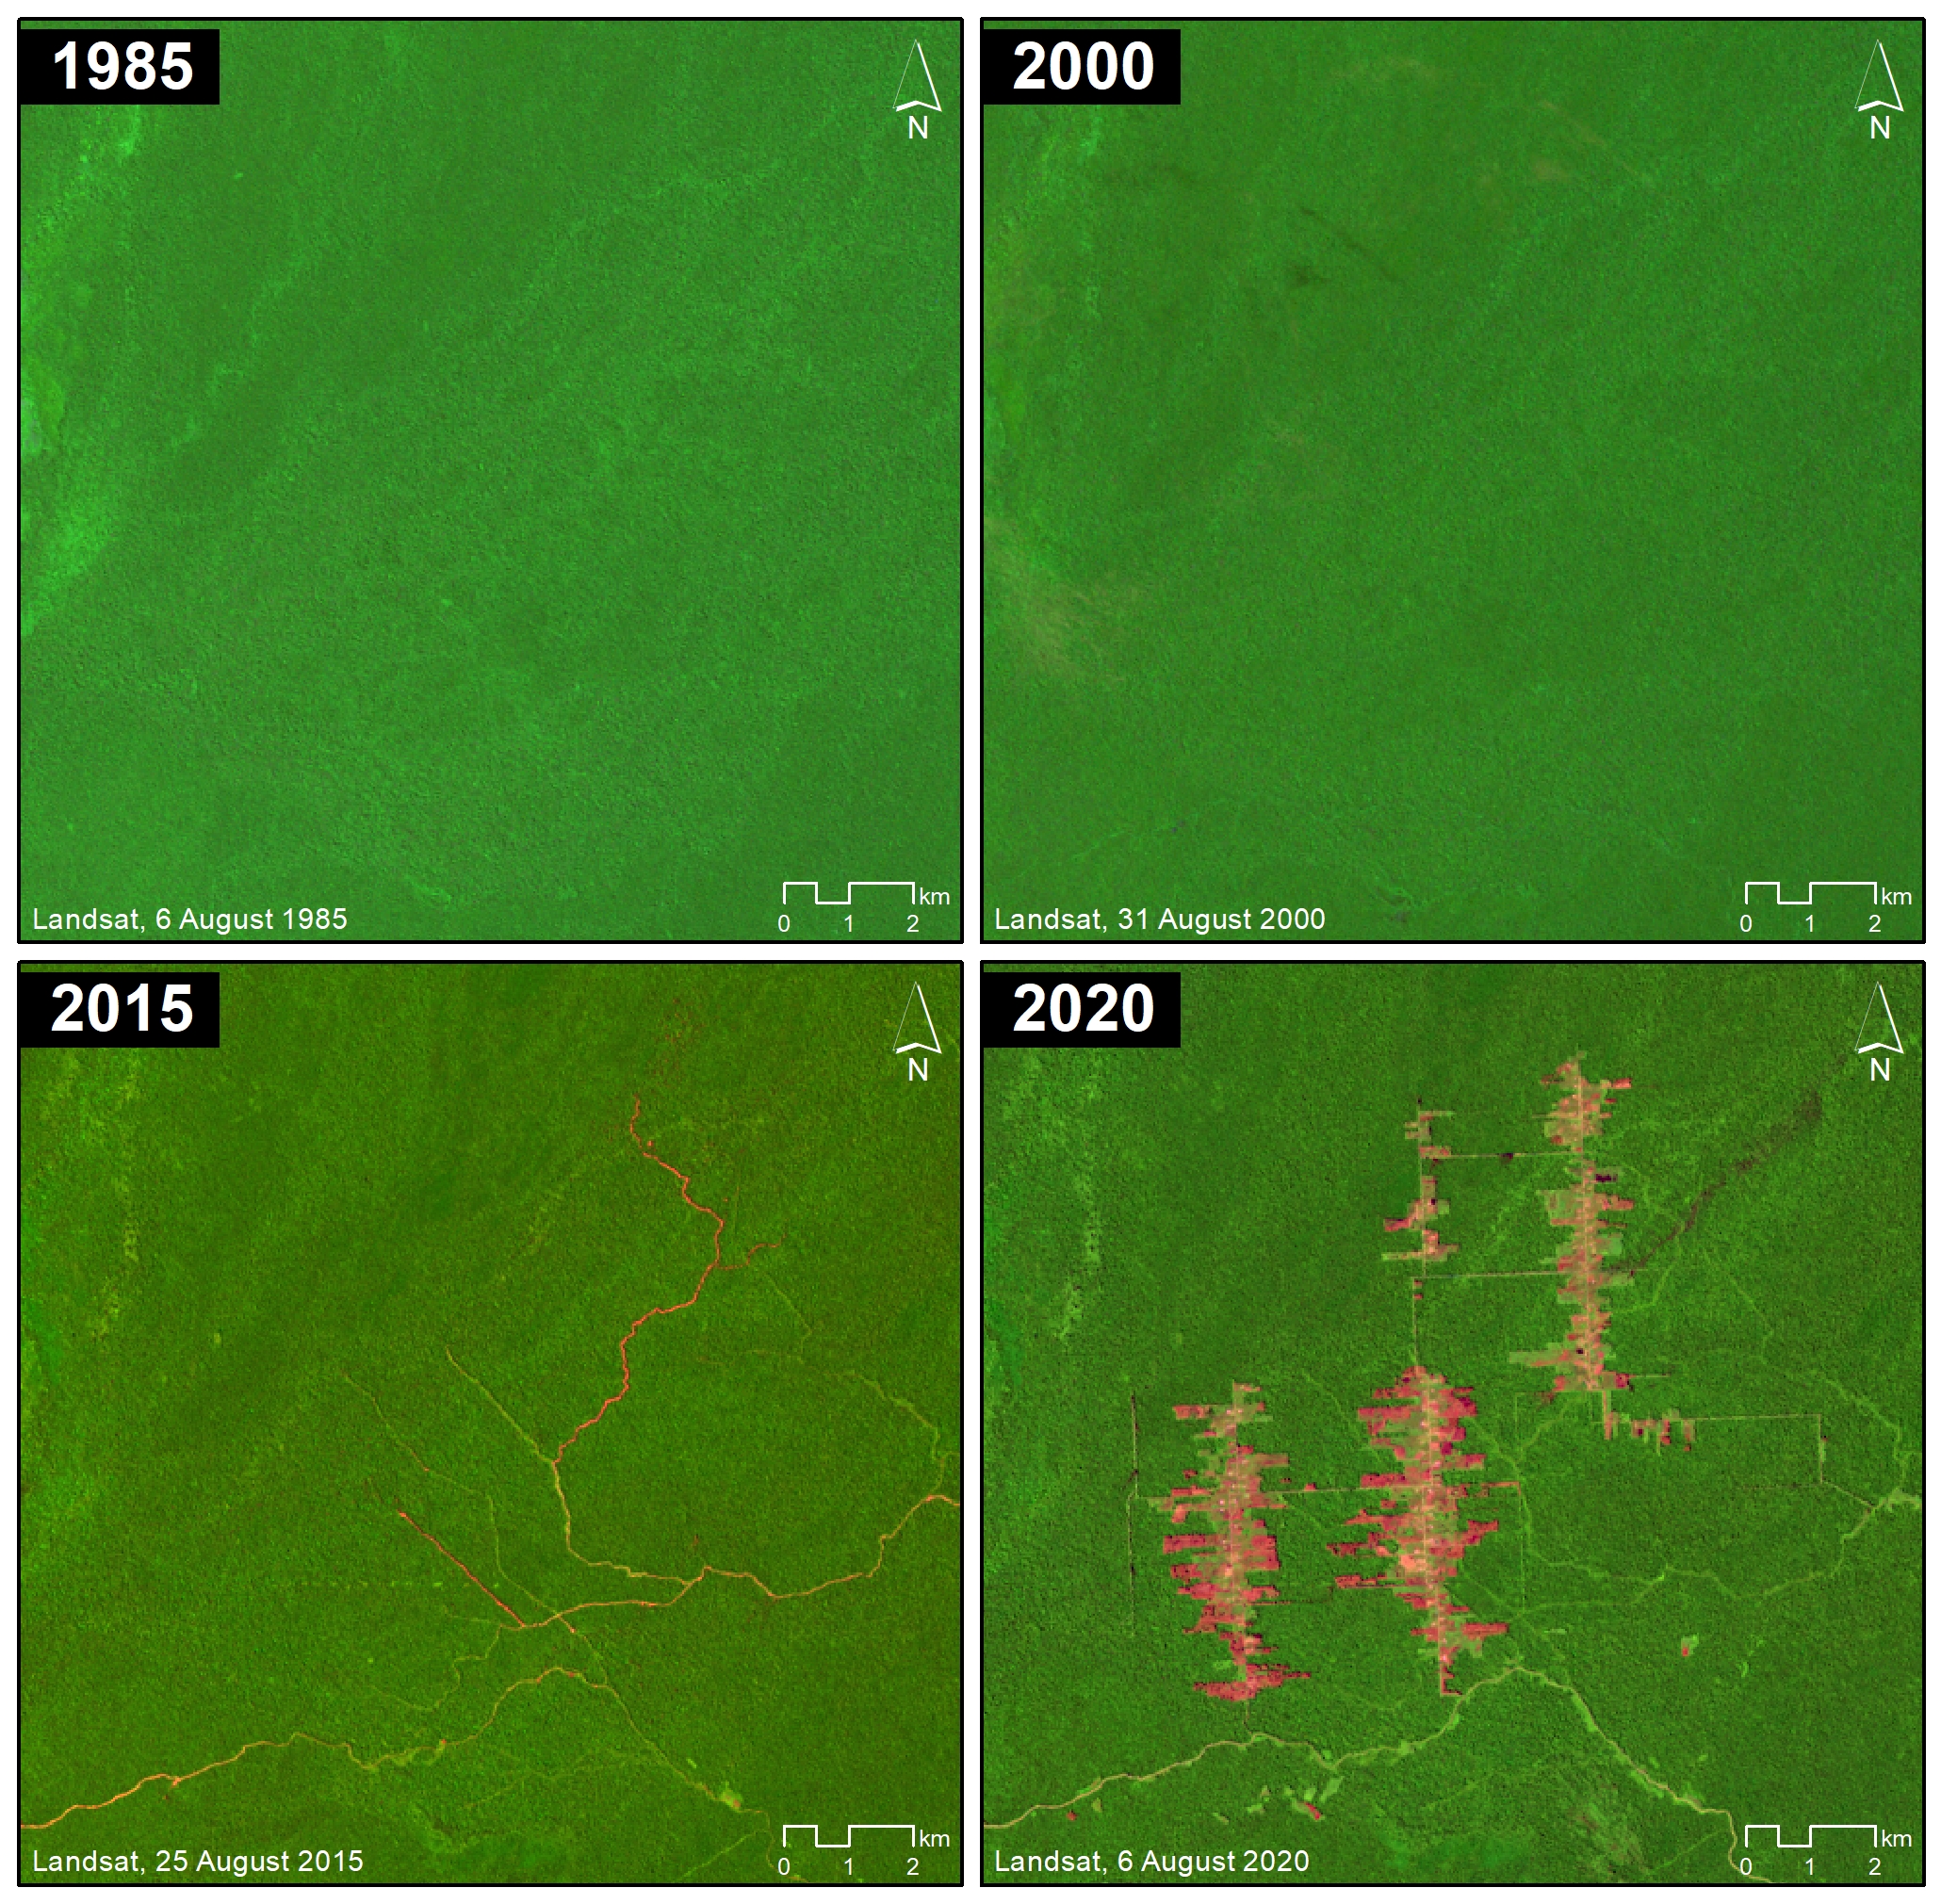
We present a time series of satellite images ranging from 1985 to 2020 that shows that the major deforestation in the area began with the Mennonite intervention.

Annex. Deforestation in 2020 in relation to 2017-19, associated with Mennonite colony Tierra Blanca 1. Data: MAAP.

Acknowledgements

We thank S. Novoa and G. Palacios for helpful comments to earlier versions of this report.

This work was supported by the following major funders: Erol Foundation, Norwegian Agency for Development Cooperation (NORAD), and International Conservation Fund of Canada (ICFC).

Citation

Finer M, Mamani N, Suarez D (2020) MAAP: Mennonite Colonies Continue Major Deforestation in Peruvian Amazon Peruana. MAAP: 27.

MAAP #126: Drones and Legal Action in the Peruvian Amazon

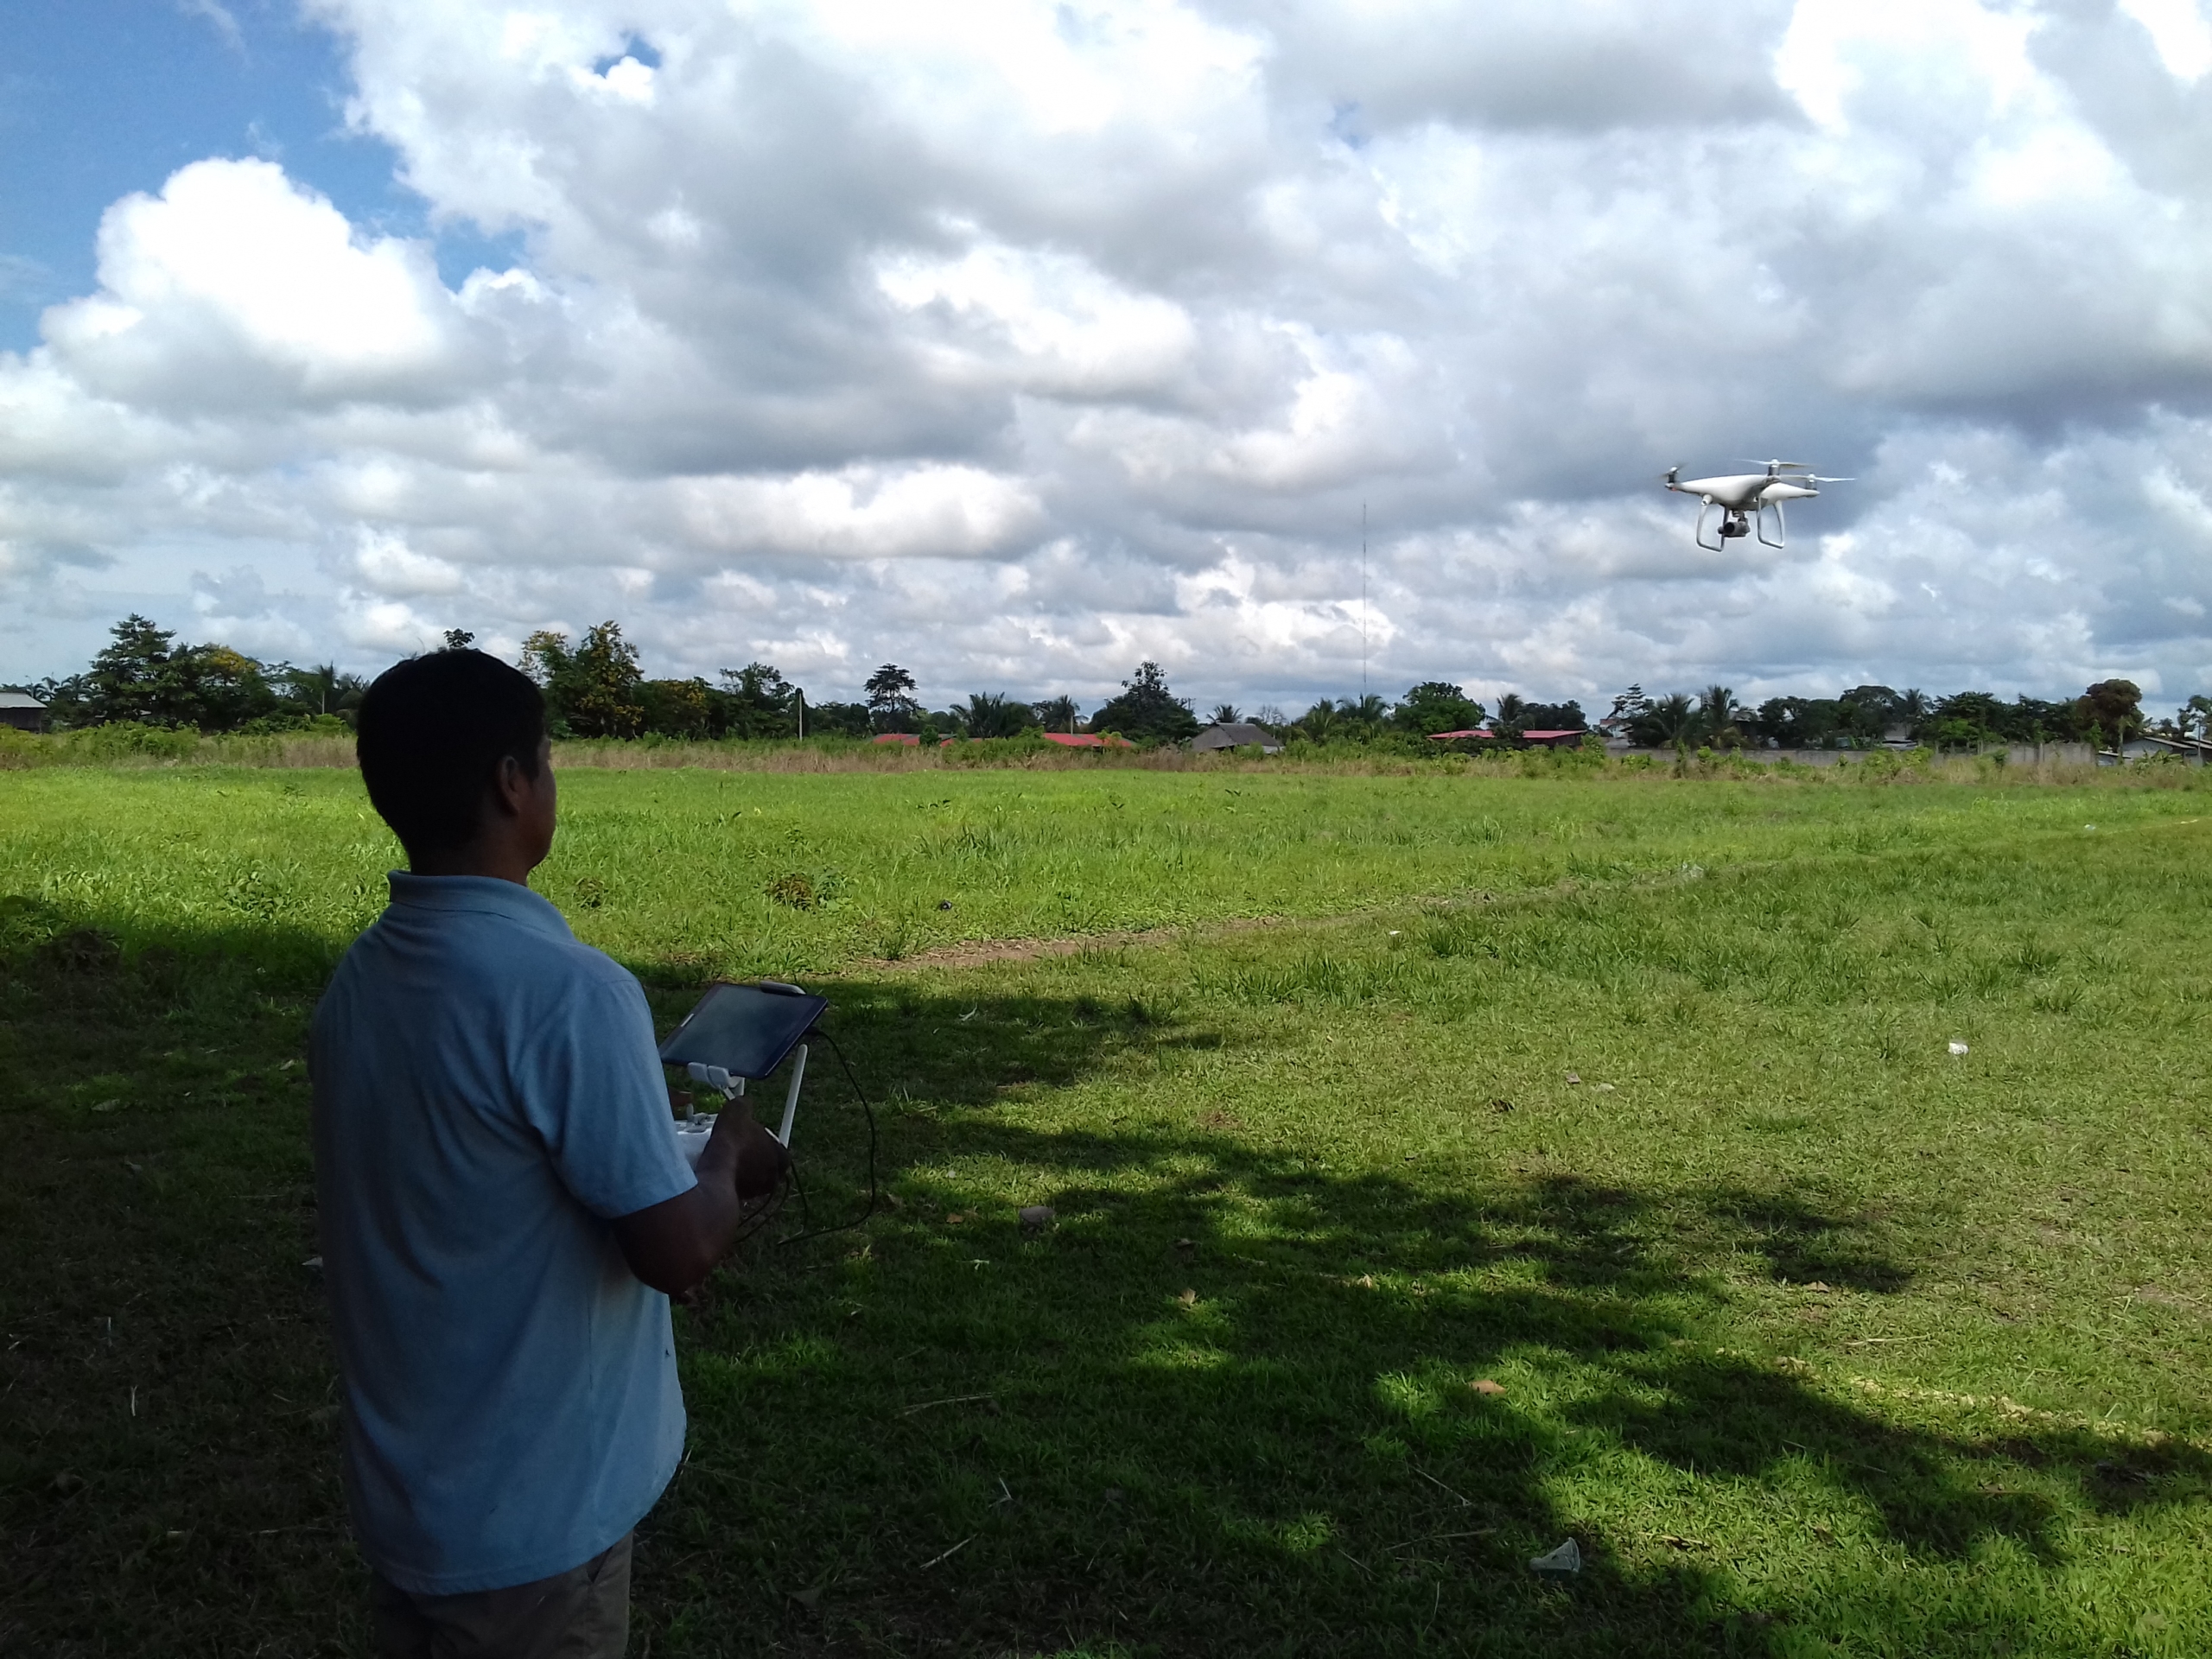
ACOMAT member flying a drone for monitoring their forestry concession. Source: ACCA.

The southern Peruvian Amazon (Madre de Dios region), is threatened by illegal mining, logging, and illegal deforestation.

In response, an association of forest concessionaires (known as ACOMAT) is implementing a comprehensive monitoring system that links the use of technology (satellites and drones) with legal action.

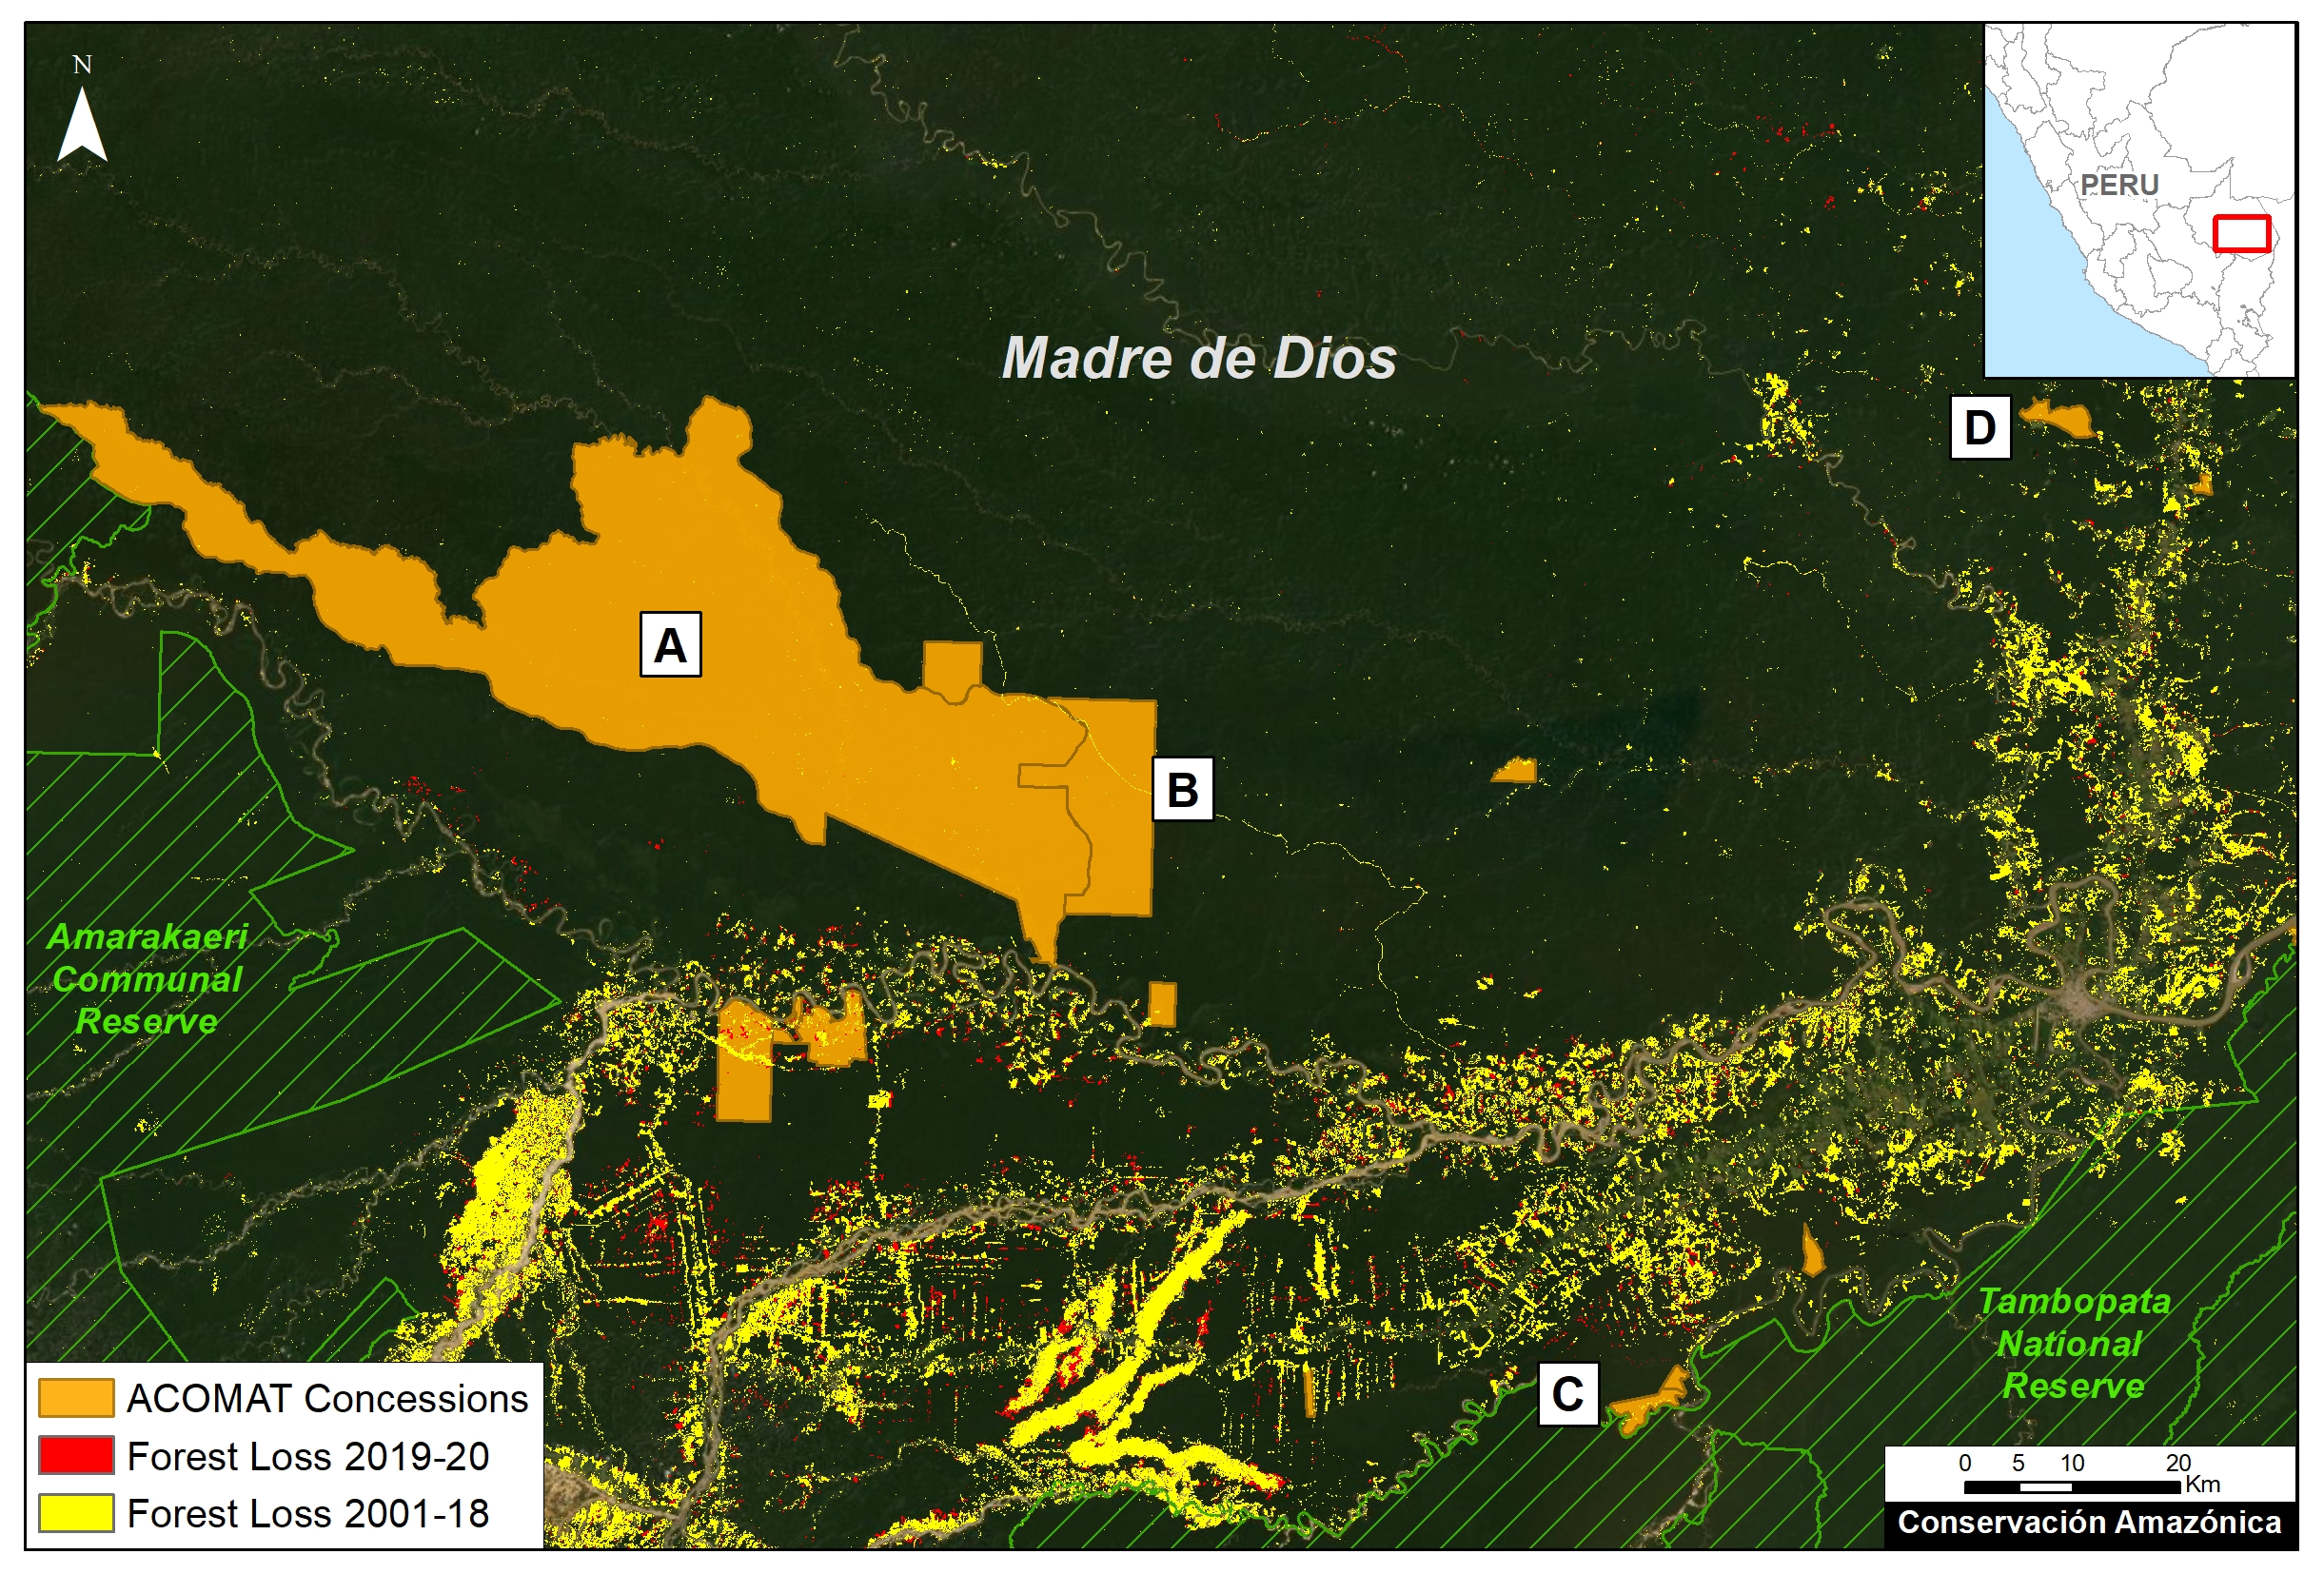
ACOMAT was formed in 2012 and now comprises 15 forestry concessions, covering 440,000 acres (178,000 hectares) in the southern Peruvian Amazon (see Base Map). Most of the concessions are alternatives to logging, such as Brazil nuts, Conservation, and Ecotourism.

This comprehensive system has three main elements:

1) Real-time, satellite-based forest loss monitoring (such as GLAD alerts) to quickly detect any possible new threats, even across vast and remote areas.

2) Field patrols with drone flights to verify forest alerts (or monitor threatened areas) with very high resolution images.

3) If suspected illegality is documented, initiate a criminal or administrative complaint, utilizing both the satellite and drone-based evidence.

In the case of ACOMAT, during 2019 they conducted 26 drone patrols and filed 15 legal complaints with the regional Environmental Prosecutor’s Office, known as FEMA. Below, we describe several of these cases.

Note that there is high potential to replicate this comprehensive monitoring model at the level of forest custodians (for example, concessionaires and indigenous communities) in the Amazon and other tropical forests.

Key ACOMAT Cases

Next, we describe four cases where comprehensive monitoring was performed (see Insets A-D on the Base Map).

Base Map. ACOMAT concessions. Data: ACCA, MINAM/PNCBMCC, SERNANP.

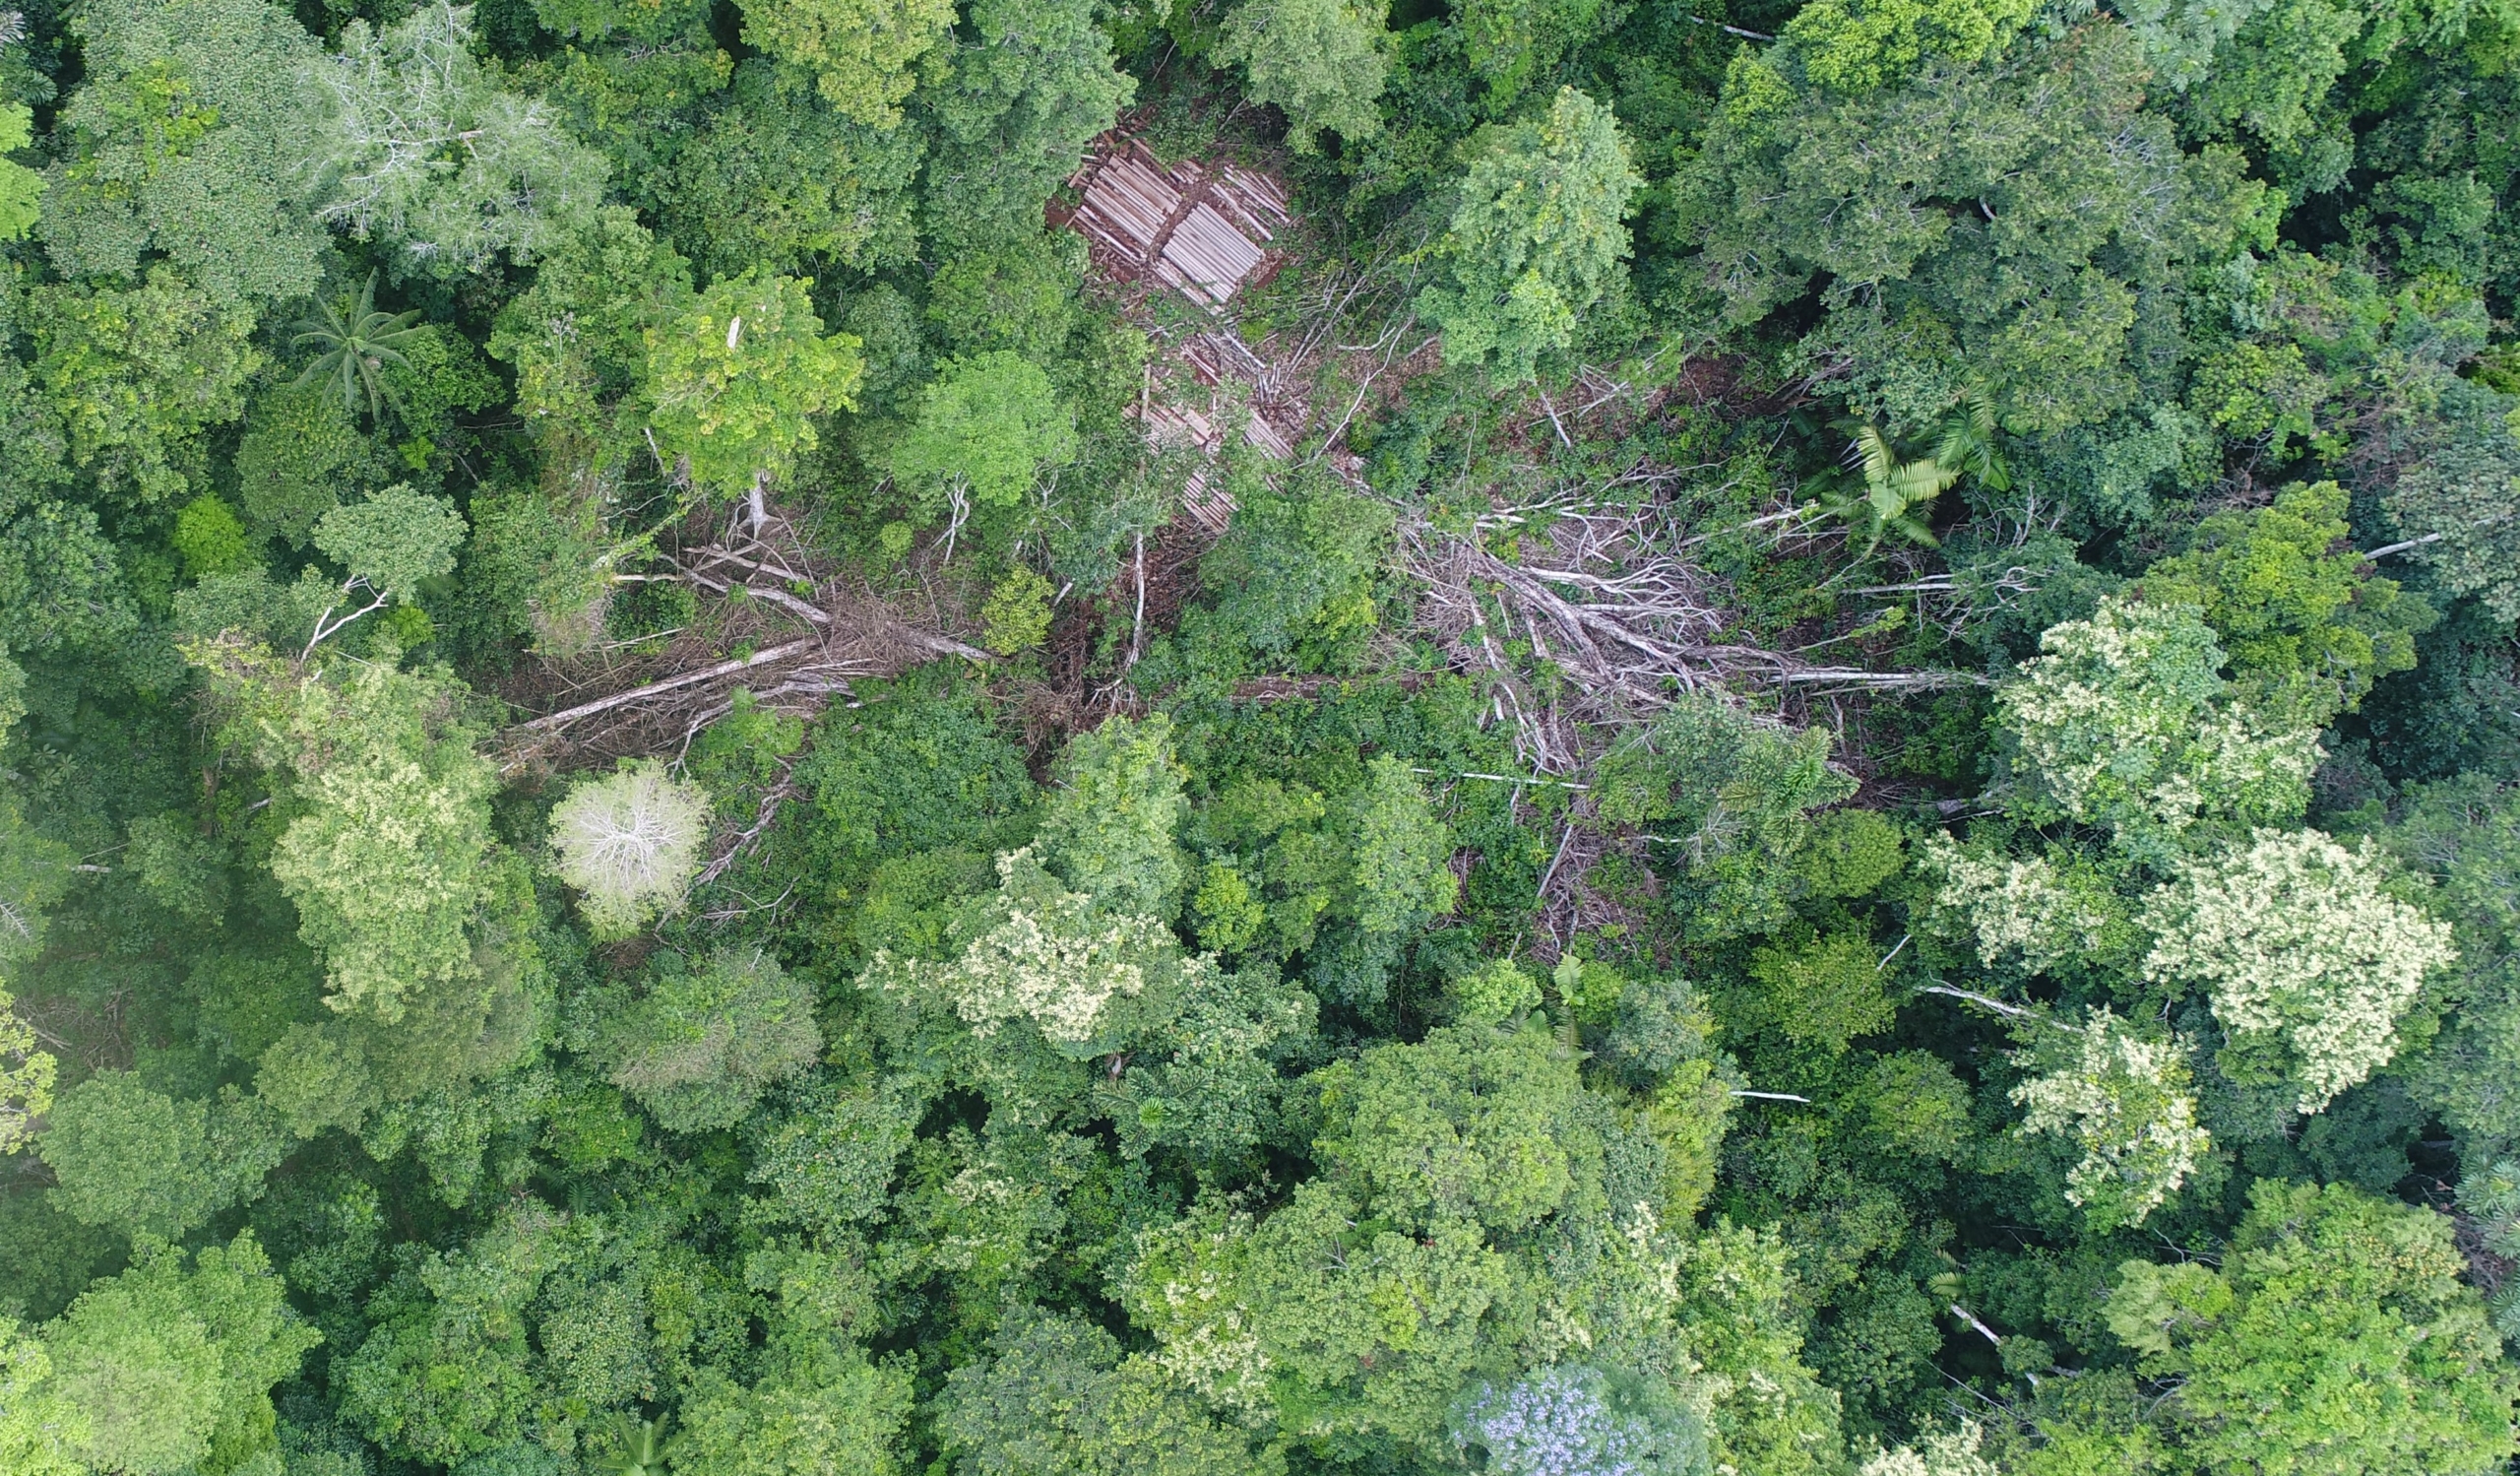
A. Illegal logging in the Los Amigos Conservation Concession

In October 2019, a patrol was carried out to investigate a threatened area within the Los Amigos Conservation Concession (the world’s first Conservation Consession). During the patrol, which included five drone flights, illegal logging was documented, including stumps with sawn trees , paths for the transfer of wood to a nearby river, and abandoned camps. The drone images were added as evidence in support of the previously filed criminal complaint to the FEMA in Madre de Dios. Below we present two striking images from the drone flights, clearly showing the illegal logging. Status of the Complaint: In Preliminary Investigation.

Case A. Illegal logging in the Los Amigos Conservation Concession, identified with drone overflight. Source: ACCA.

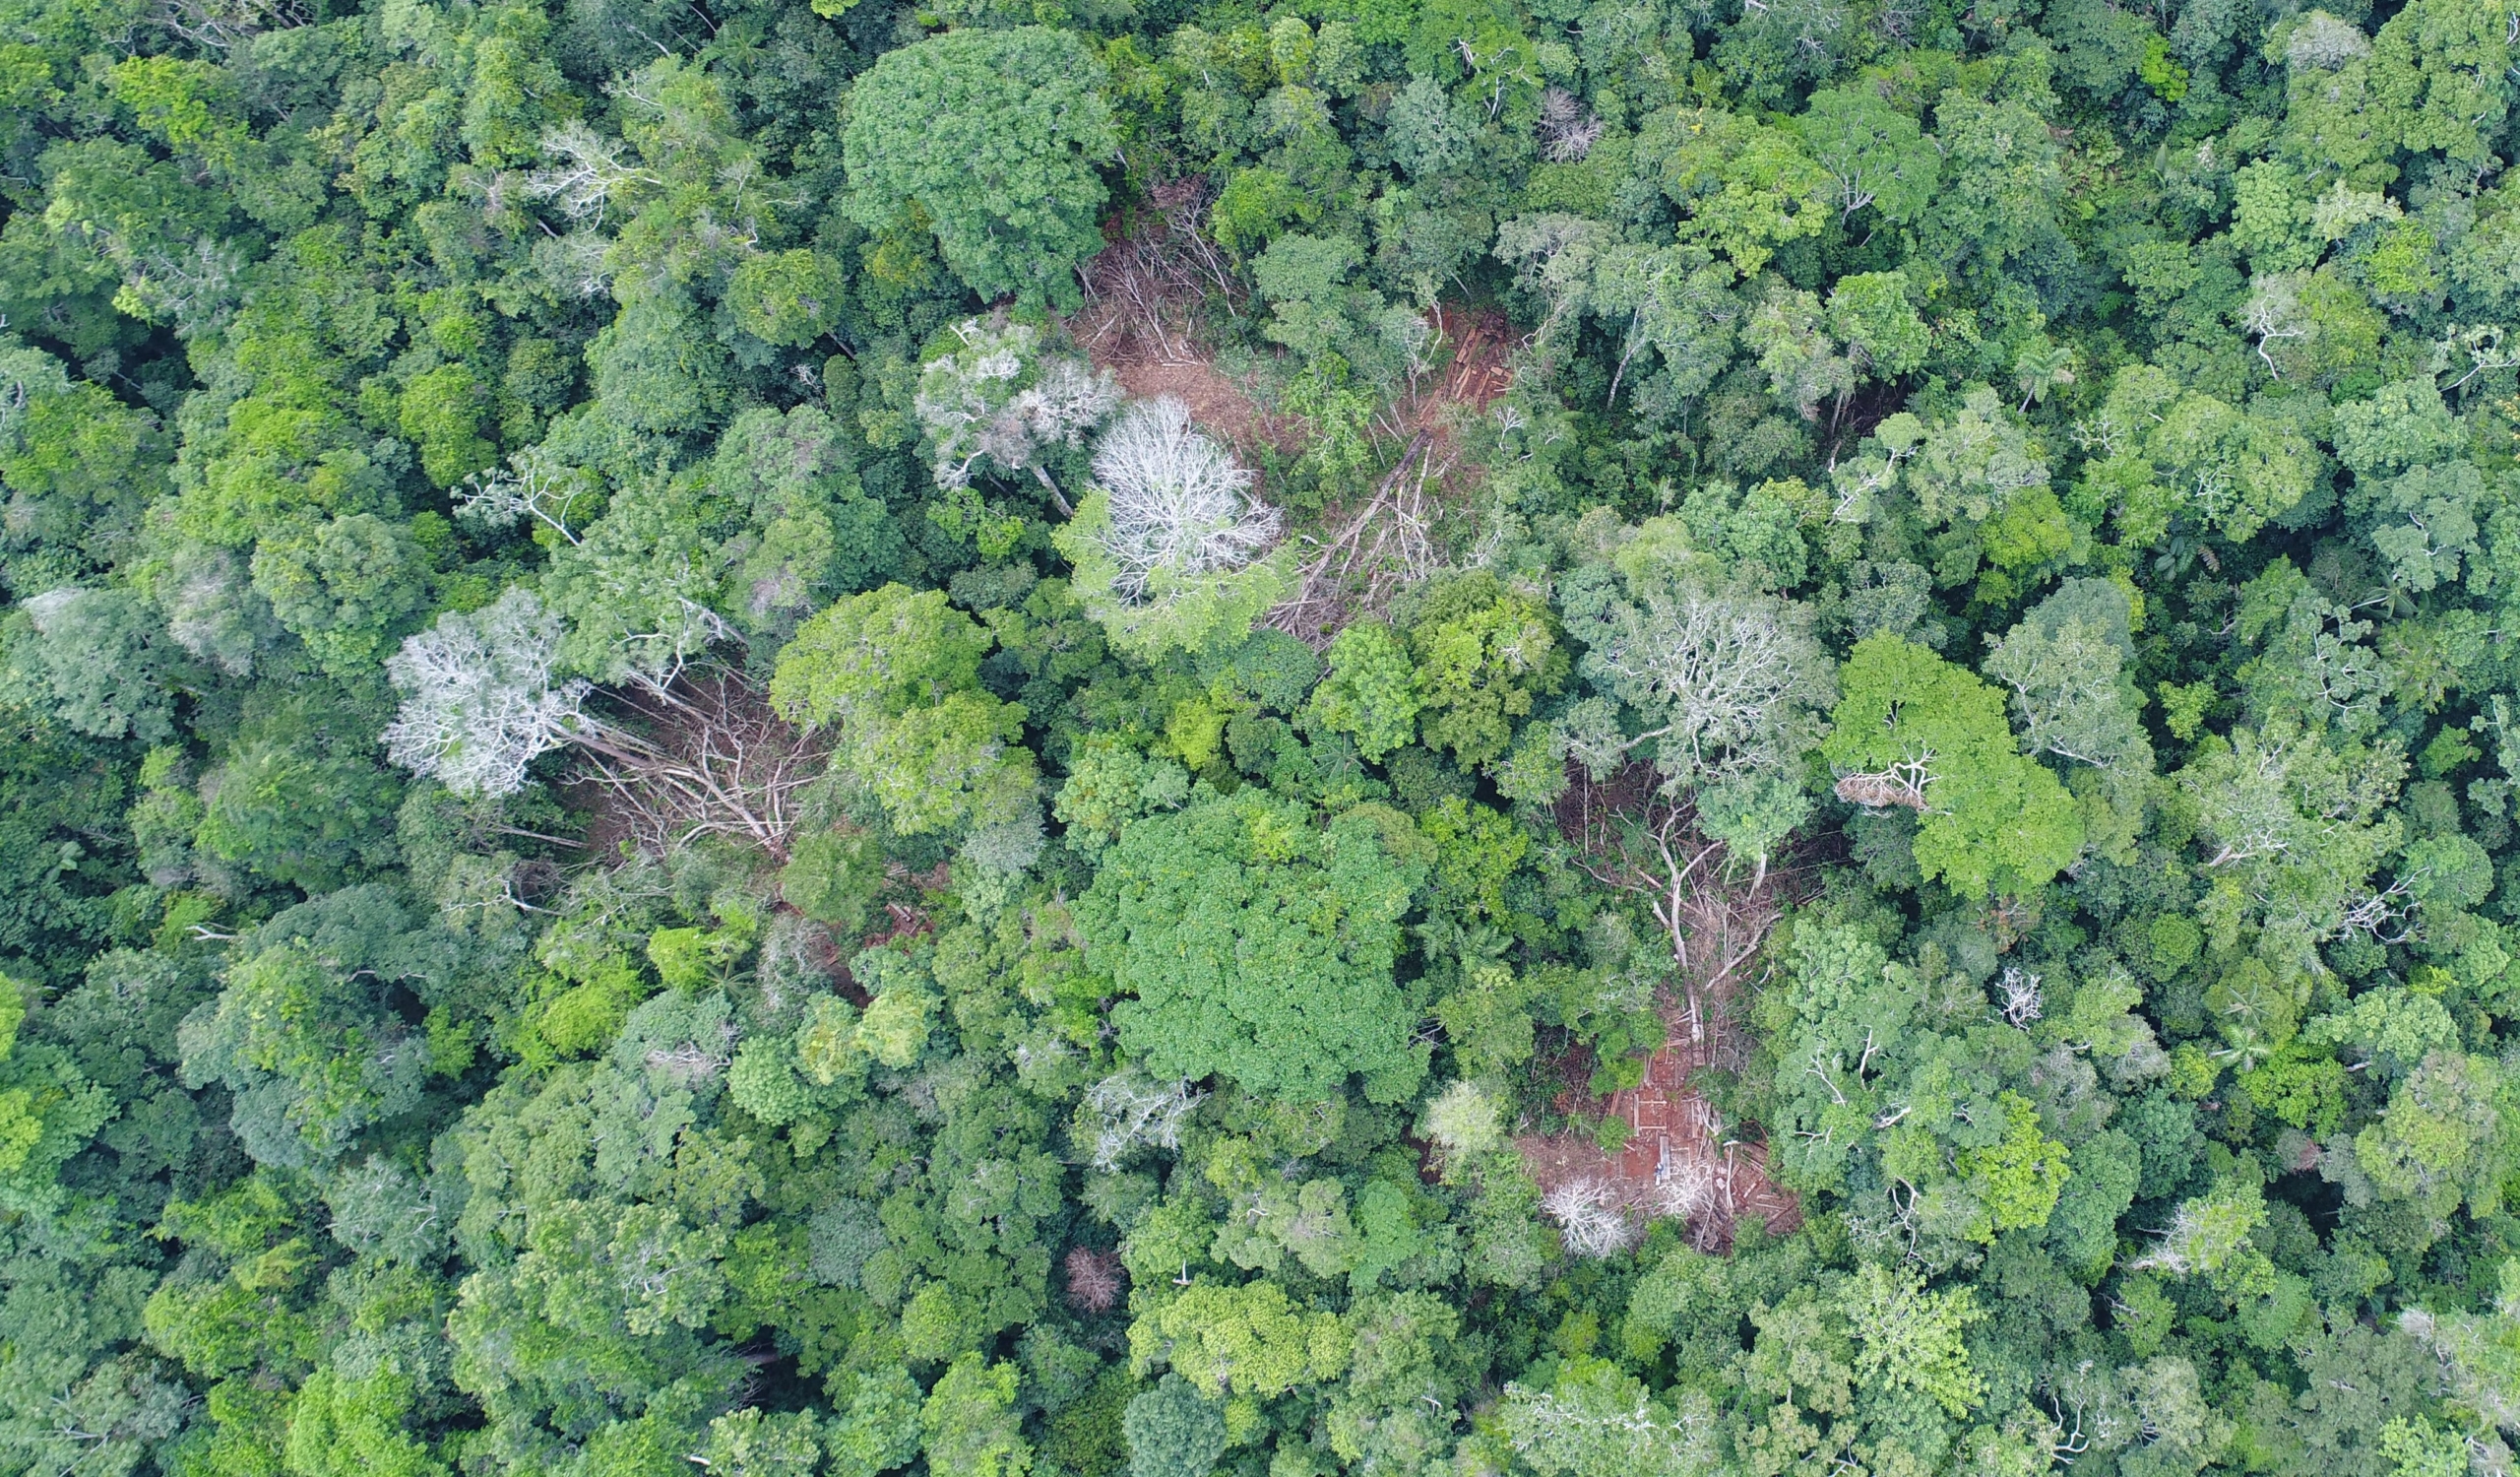
B. Ilegal Logging in the MADEFOL Forestry Concession

In May 2019, a field patrol was carried out to investigate a threatened area within the MADEFOL forestry concession. During the patrol, which included two drone flights, illegal logging was documented, including stumps with sawn trees, a recently abandoned camp, and an access road. With the drone images as evidence, a new criminal complaint was filed with the FEMA in Madre de Dios. Below is an image from the drone flights, clearly showing the evidence of illegal logging. Status of the complaint: In qualification.

Case B. Illegal logging in the “MADEFOL” forestry concession identified with drone overflight. Source: ACCA.

C. Illegal Gold Mining in a Conservation Concession

In May 2019, a field patrol was carried out in the “Inversiones Manu SAC” Conservation Concession to investigate an area that had previously been affected by illegal gold miners. During the patrol, which included two drone flights, illegal gold mining was documented in the Malinowski River. With the drone images as evidence, a new criminal complaint was filed with the FEMA in Madre de Dios. Below is a drone image clearly showing the evidence of illegal gold mining. Status of the complaint: Preliminary Investigation.

Caso C. Minería ilegal en la Concesión de Conservación “Inversiones Manu SAC,” identificada con sobrevuelo de dron. Fuente: ACCA.

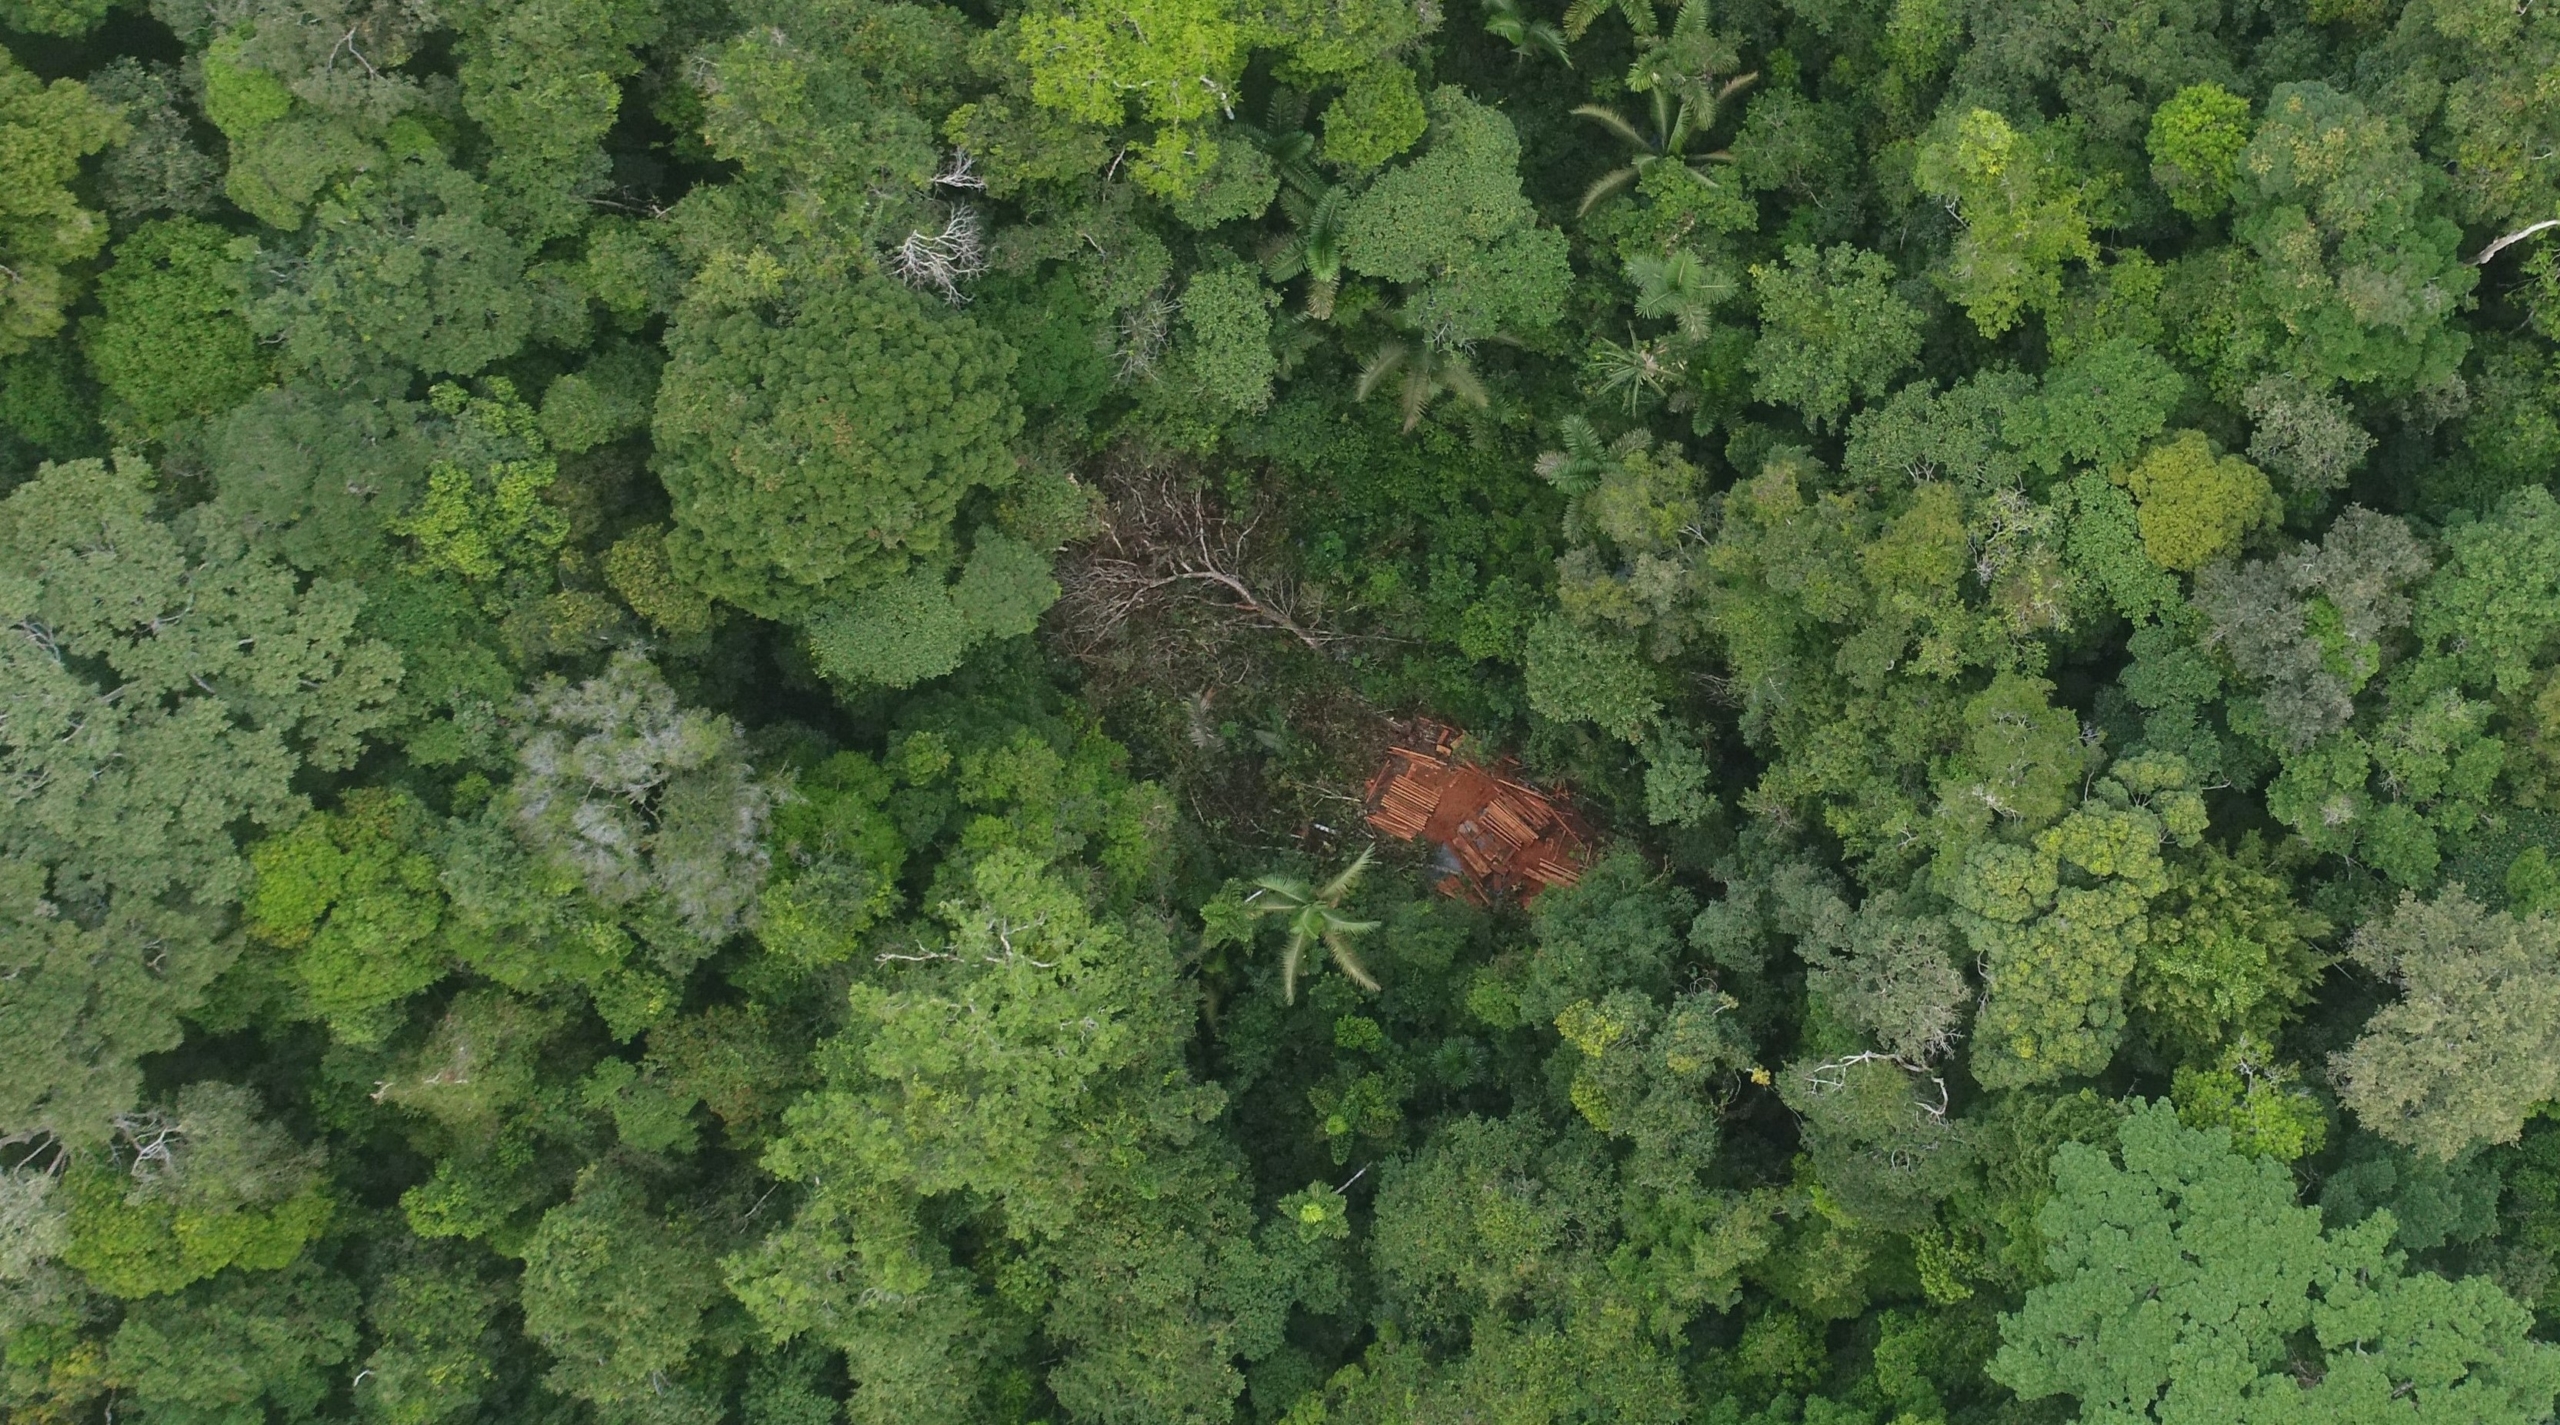
D. Deforestation in a Brazil Nut Concession

In October 2019, a patrol was carried out to investigate an early warning deforestation alert within the “Sara Hurtado Orozco B” Brazil nut concession.

During the patrol, which included one drone flight, the recent deforestation of five acres (two hectares) was documented. With the drone images, a new criminal complaint was filed with the FEMA of Madre de Dios. It should be noted that this concession was being investigated for a separate illegal deforestation event. Below is one of the images of the drone flight, clearly showing the illegal deforestation. Status of the complaint: In preliminary proceedings.

Caso D. Deforestación en la Concesión Forestal de Castaña “Sara Hurtado Orozco B”. Fuente: ACCA.

Importance of the “ACOMAT Model”

We have started using the term “Acomat model” to refer to the innovative use of the three elements described above (real-time monitoring, drone flights, and criminal complaints) by the ACOMAT concessionaires.

ACOMAT was created in 2012, and since 2017 has received crucial support from the organization Conservation Amazónica-ACCA, supported by funds from Norway’s International Climate and Forest Initiative (NICFI), led by the Norwegian Agency for Development Cooperation (NORAD).

This project has provided training on all three major aspects, satellite-based monitoring alerts, drones, and the legal process. Concessionaires now receive deforestation alerts to their phones, have the ability to organize and conduct field patrols, and some are trained to perform their own drone flights.

Acknowledgments

We thank R. Segura (DAI), M.E. Gutierrez (ACCA), D. Suarez (ACCA), H. Balbuena (ACCA), M. Silman (WFU), and G. Palacios for their helpful comments on this report.

This report was conducted with technical assistance from USAID, via the Prevent project. Prevent is an initiative that, over the next 5 years, will work with the Government of Peru, civil society, and the private sector to prevent and combat environmental crimes in Loreto, Ucayali and Madre de Dios, in order to conserve the Peruvian Amazon.

This publication is made possible with the support of the American people through USAID. Its content is the sole responsibility of the authors and does not necessarily reflect the views of USAID or the US government.

This work was also supported by NORAD (Norwegian Agency for Development Cooperation) and ICFC (International Conservation Fund of Canada).

Citation

Finer M, Castañeda C, Novoa S, Paz L (2020) Drones and Legal Action in the Peruvian Amazon. MAAP 126.


MAAP #124: Deforestation Hotspots 2020 in the Peruvian Amazon.

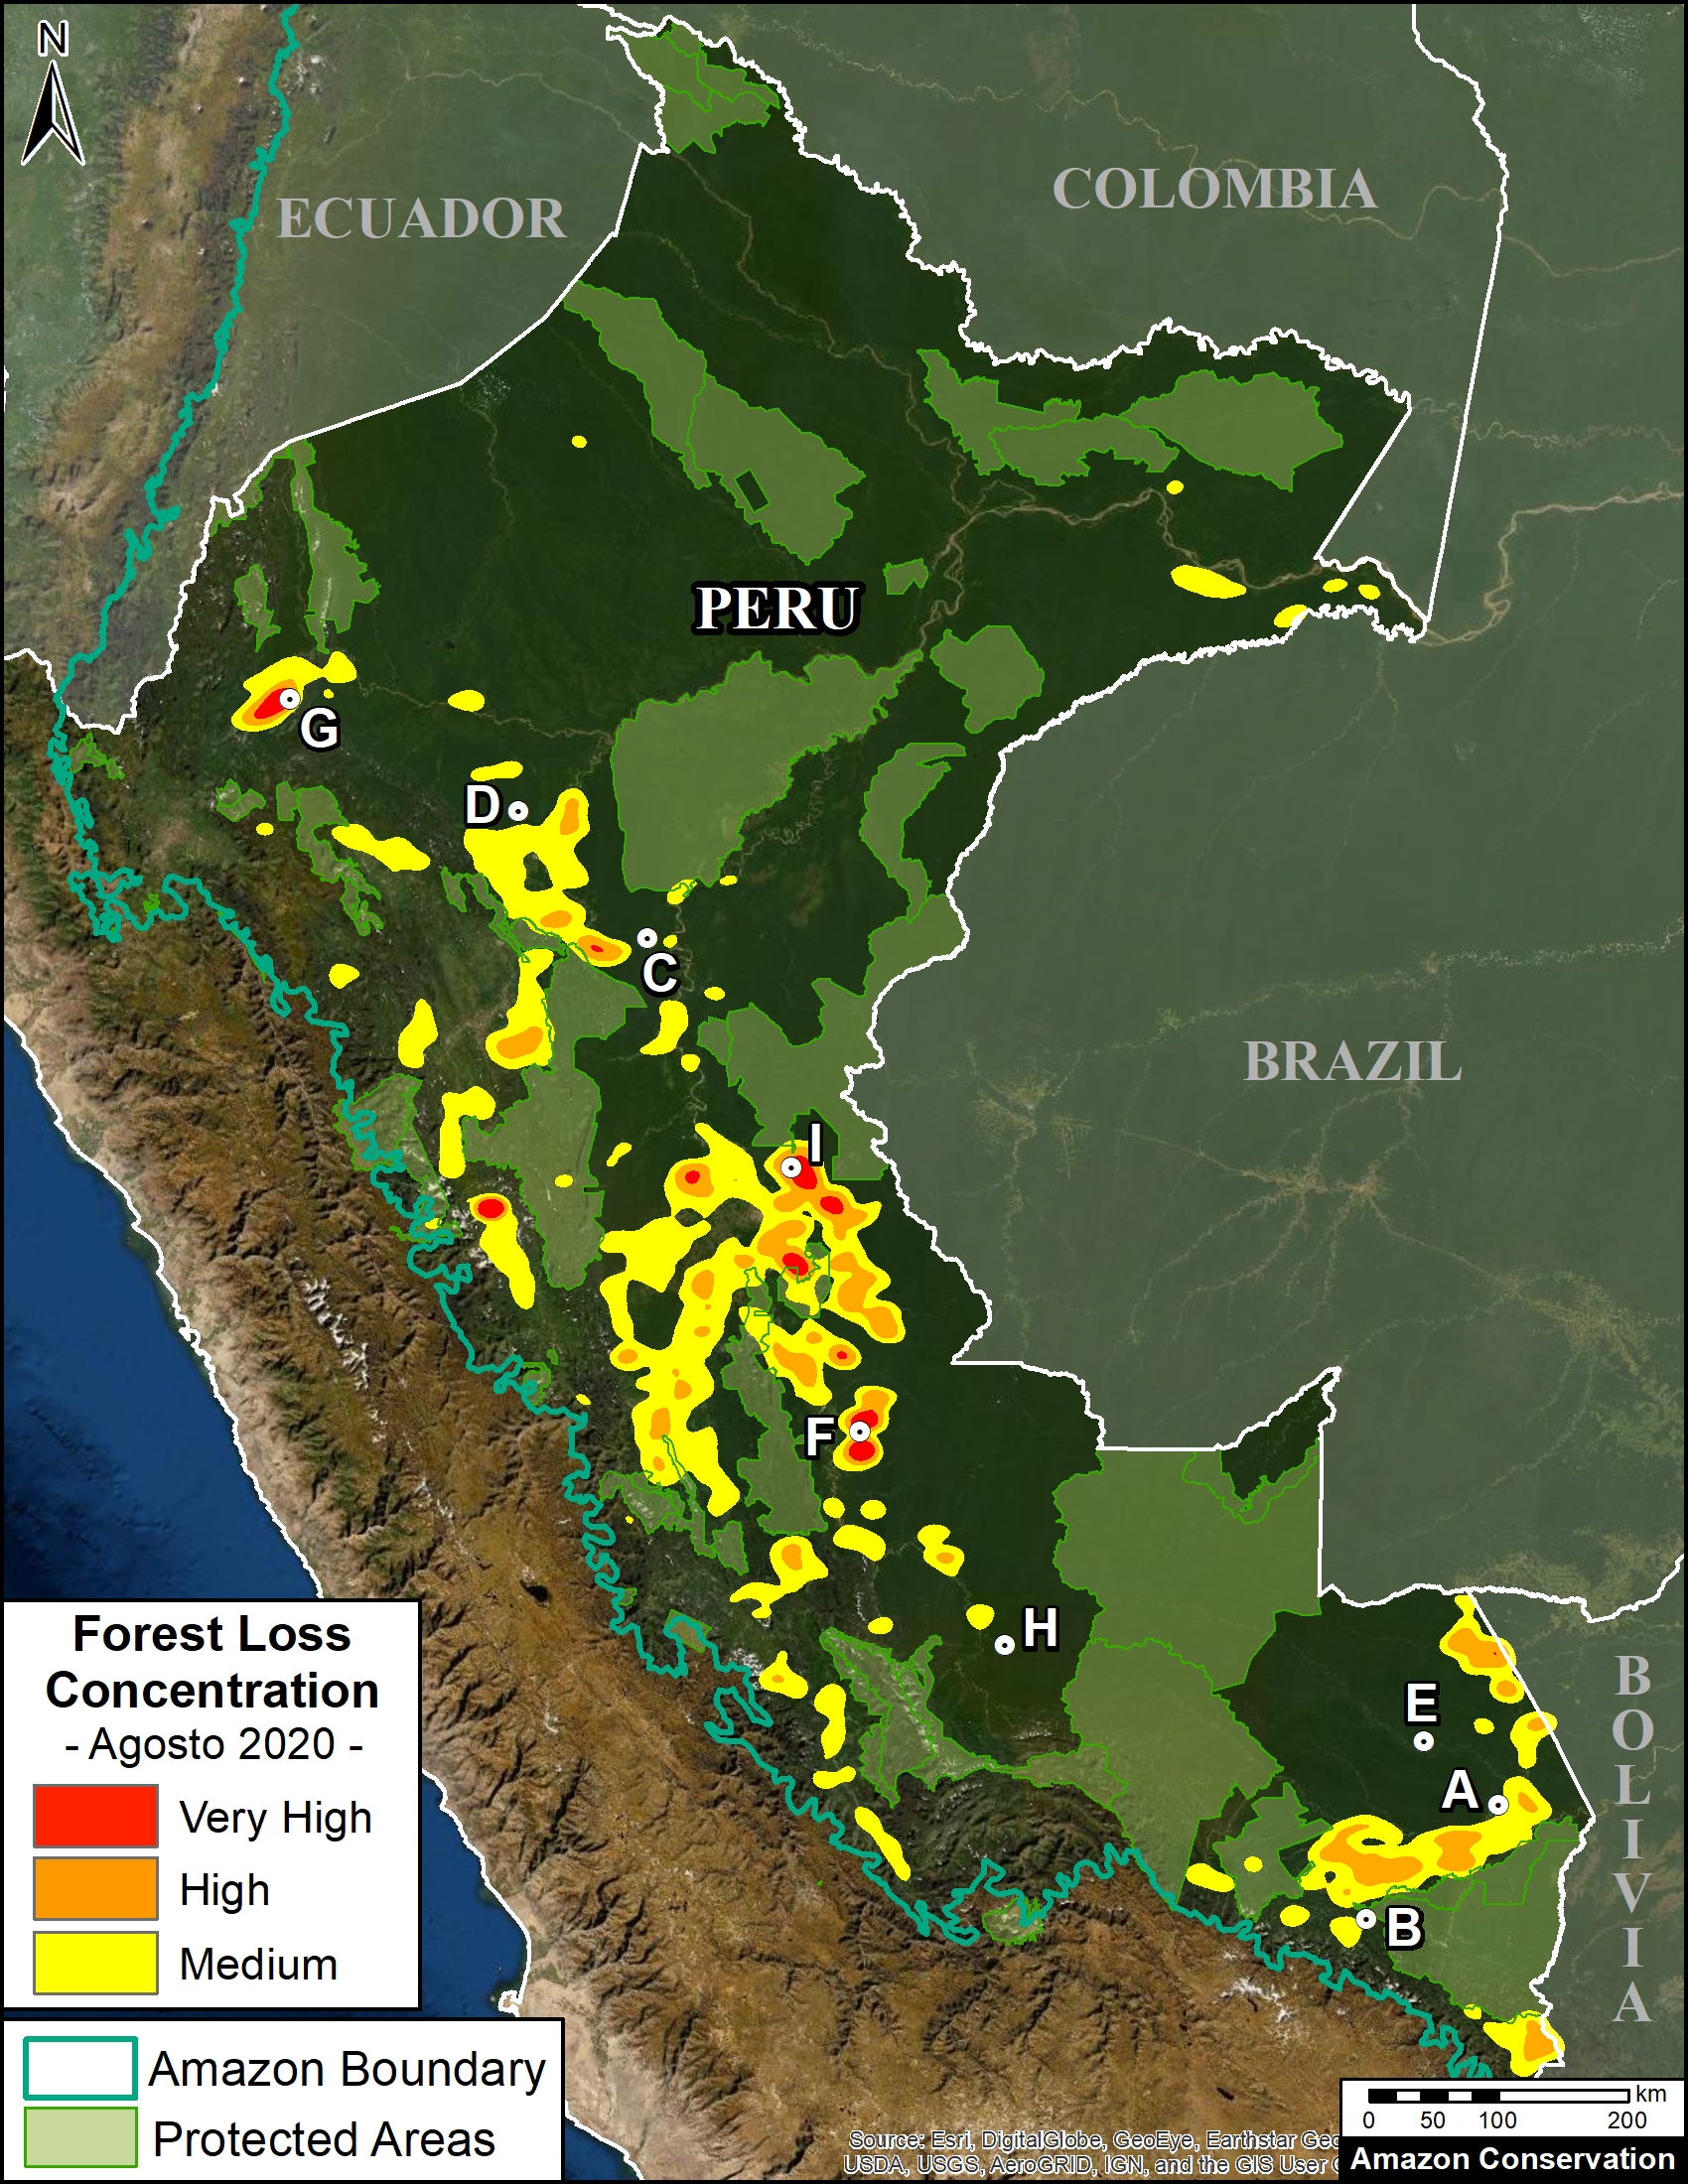
Base Map. 2020 Forest Loss Hotspots in the Peruvian Amazon. Data: UMD/GLAD, MAAP, SERNANP.

We have entered the peak deforestation season in the Peruvian Amazon, so it is also a critical time for real-time monitoring (MAAP’s specialty).

Here, we highlight the major deforestation events documented so far in 2020 (through August 23).

The Base Map shows the current forest loss hotspots, indicated by the colors yellow, orange and red.

Below, we present the most urgent deforestation cases, caused by gold mining and agriculture (both large and small scale), the current leading deforestation drivers in Peru.

The Letters A-I on the Base Map correspond to the location of the cases described below.

One of the key cases is the new illegal gold mining hotspot along the Pariamanu river (Letter A in the southern Peruvian Amazon).

Another important case is the expanding large-scale agriculture by a Mennonite colony that continues causing an alarming deforestation.

The other cases deal with small-scale agriculture, which cumulatively represent the main deforestation driver in Peru.

Urgent Deforestation Cases 2020

1. Gold Mining

In MAAP #121, we reported that, in general, gold mining deforestation has decreased in the southern Peruvian Amazon following the government’s Operation Mercury, but it does continue in several critical areas. The images below show two of these areas (Pariamanu and Araza) with alarming new deforestation in 2020.

A. Pariamanu

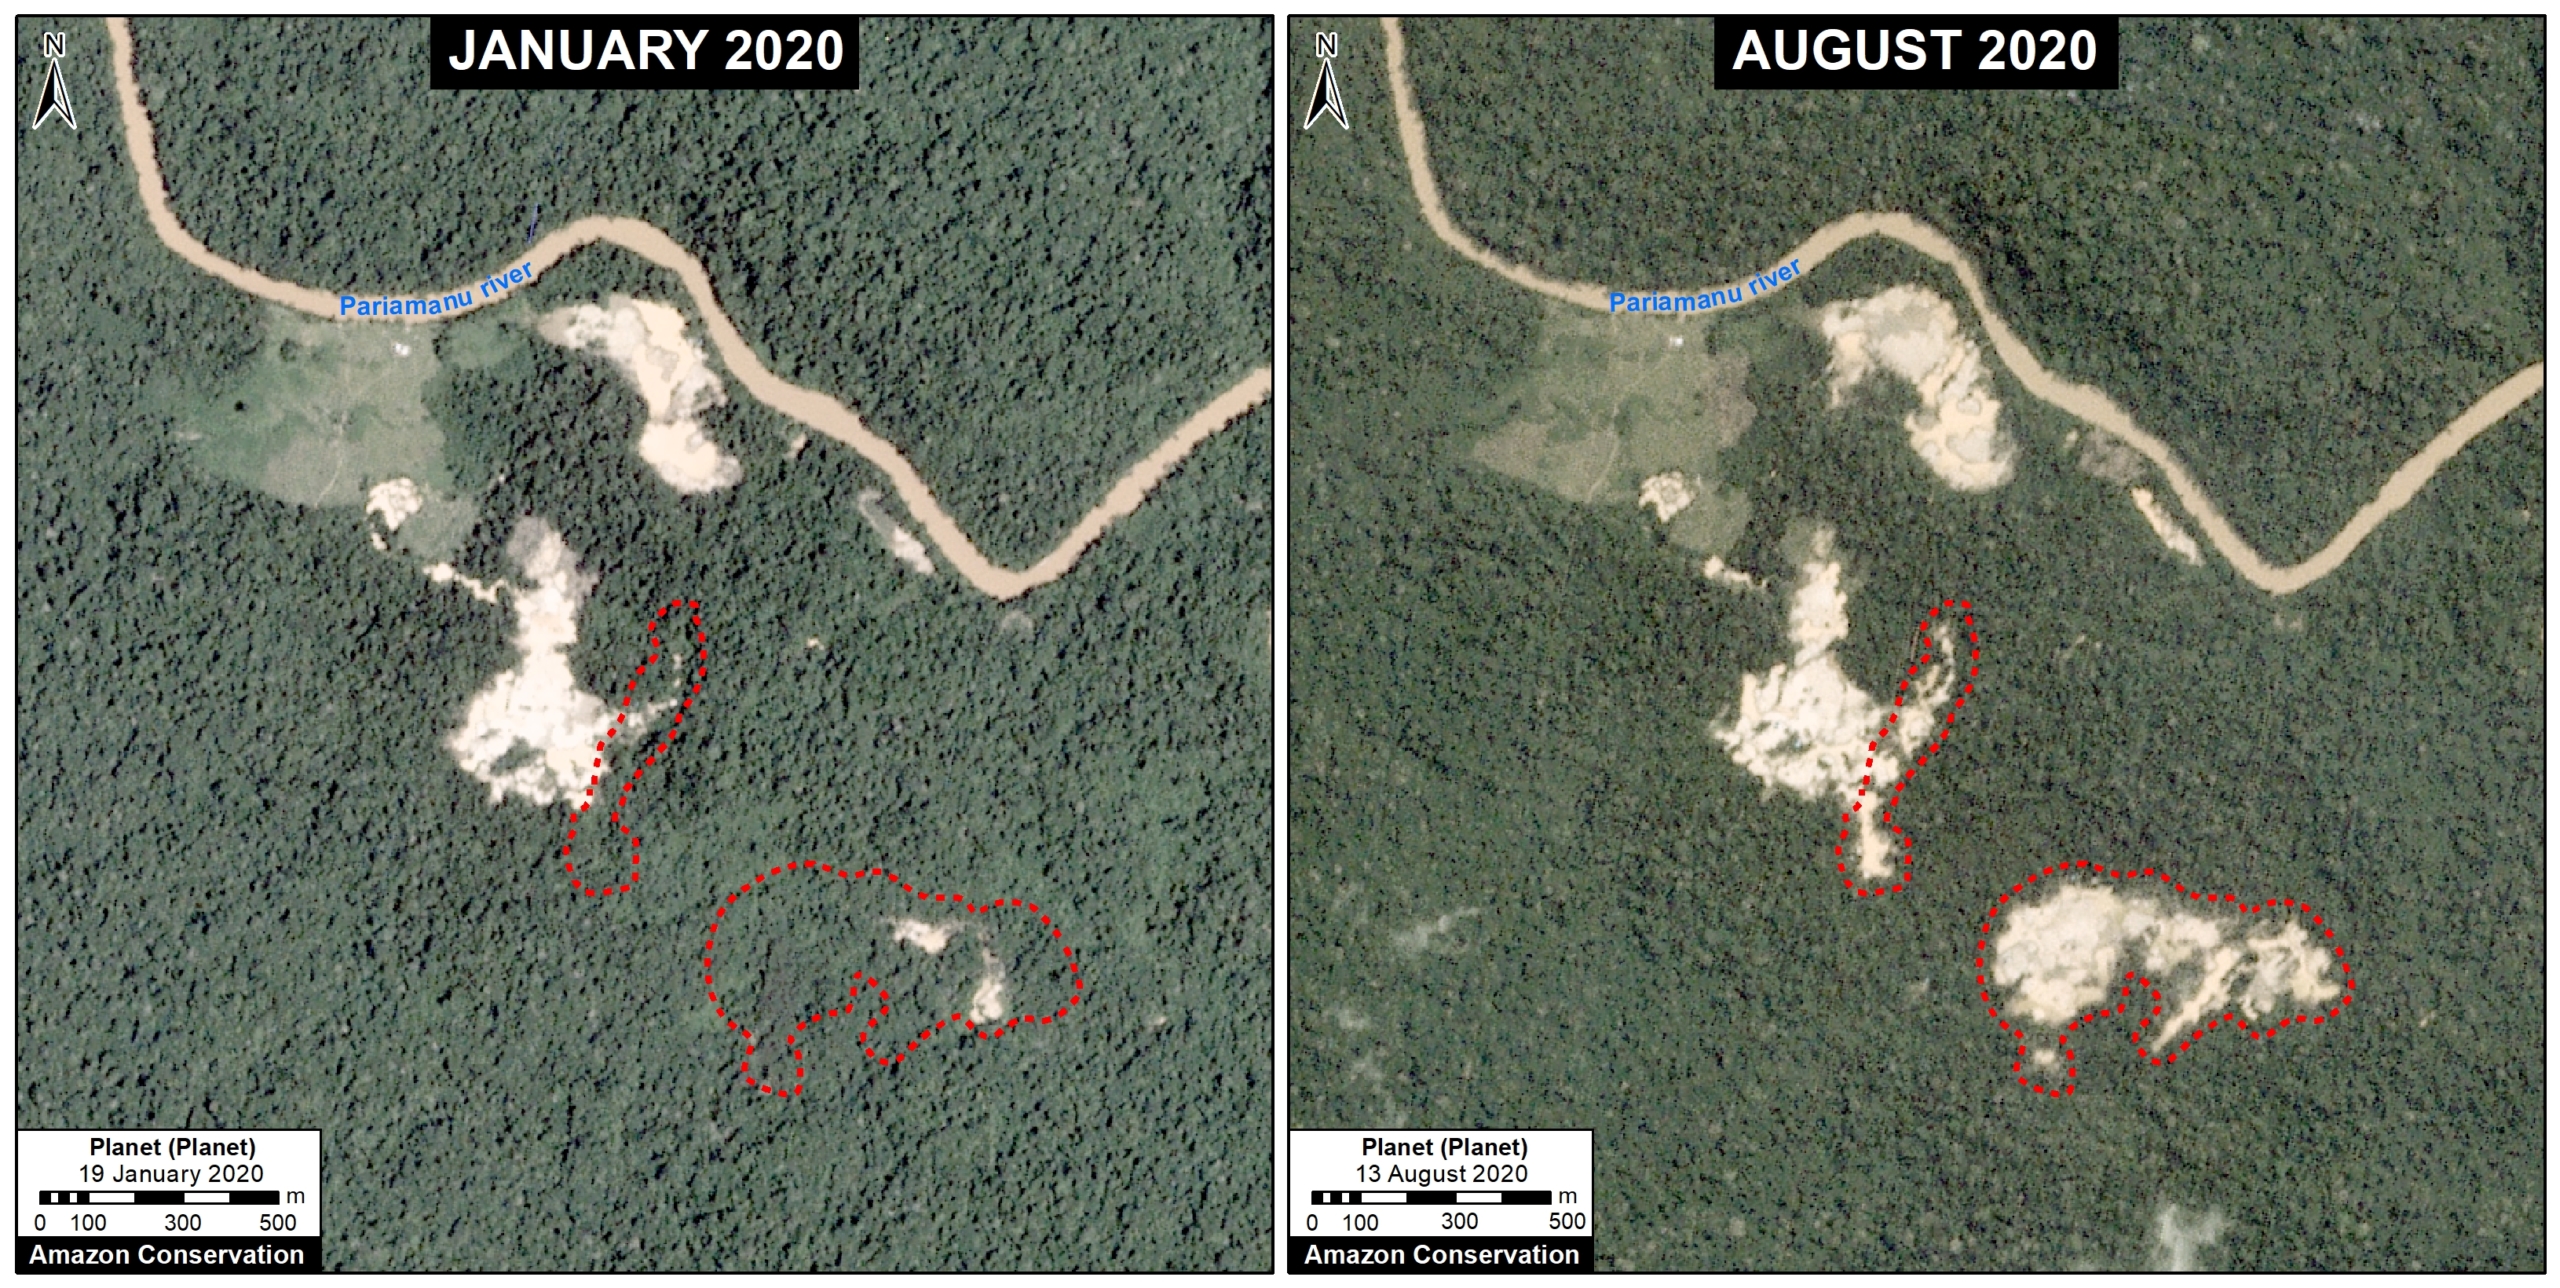
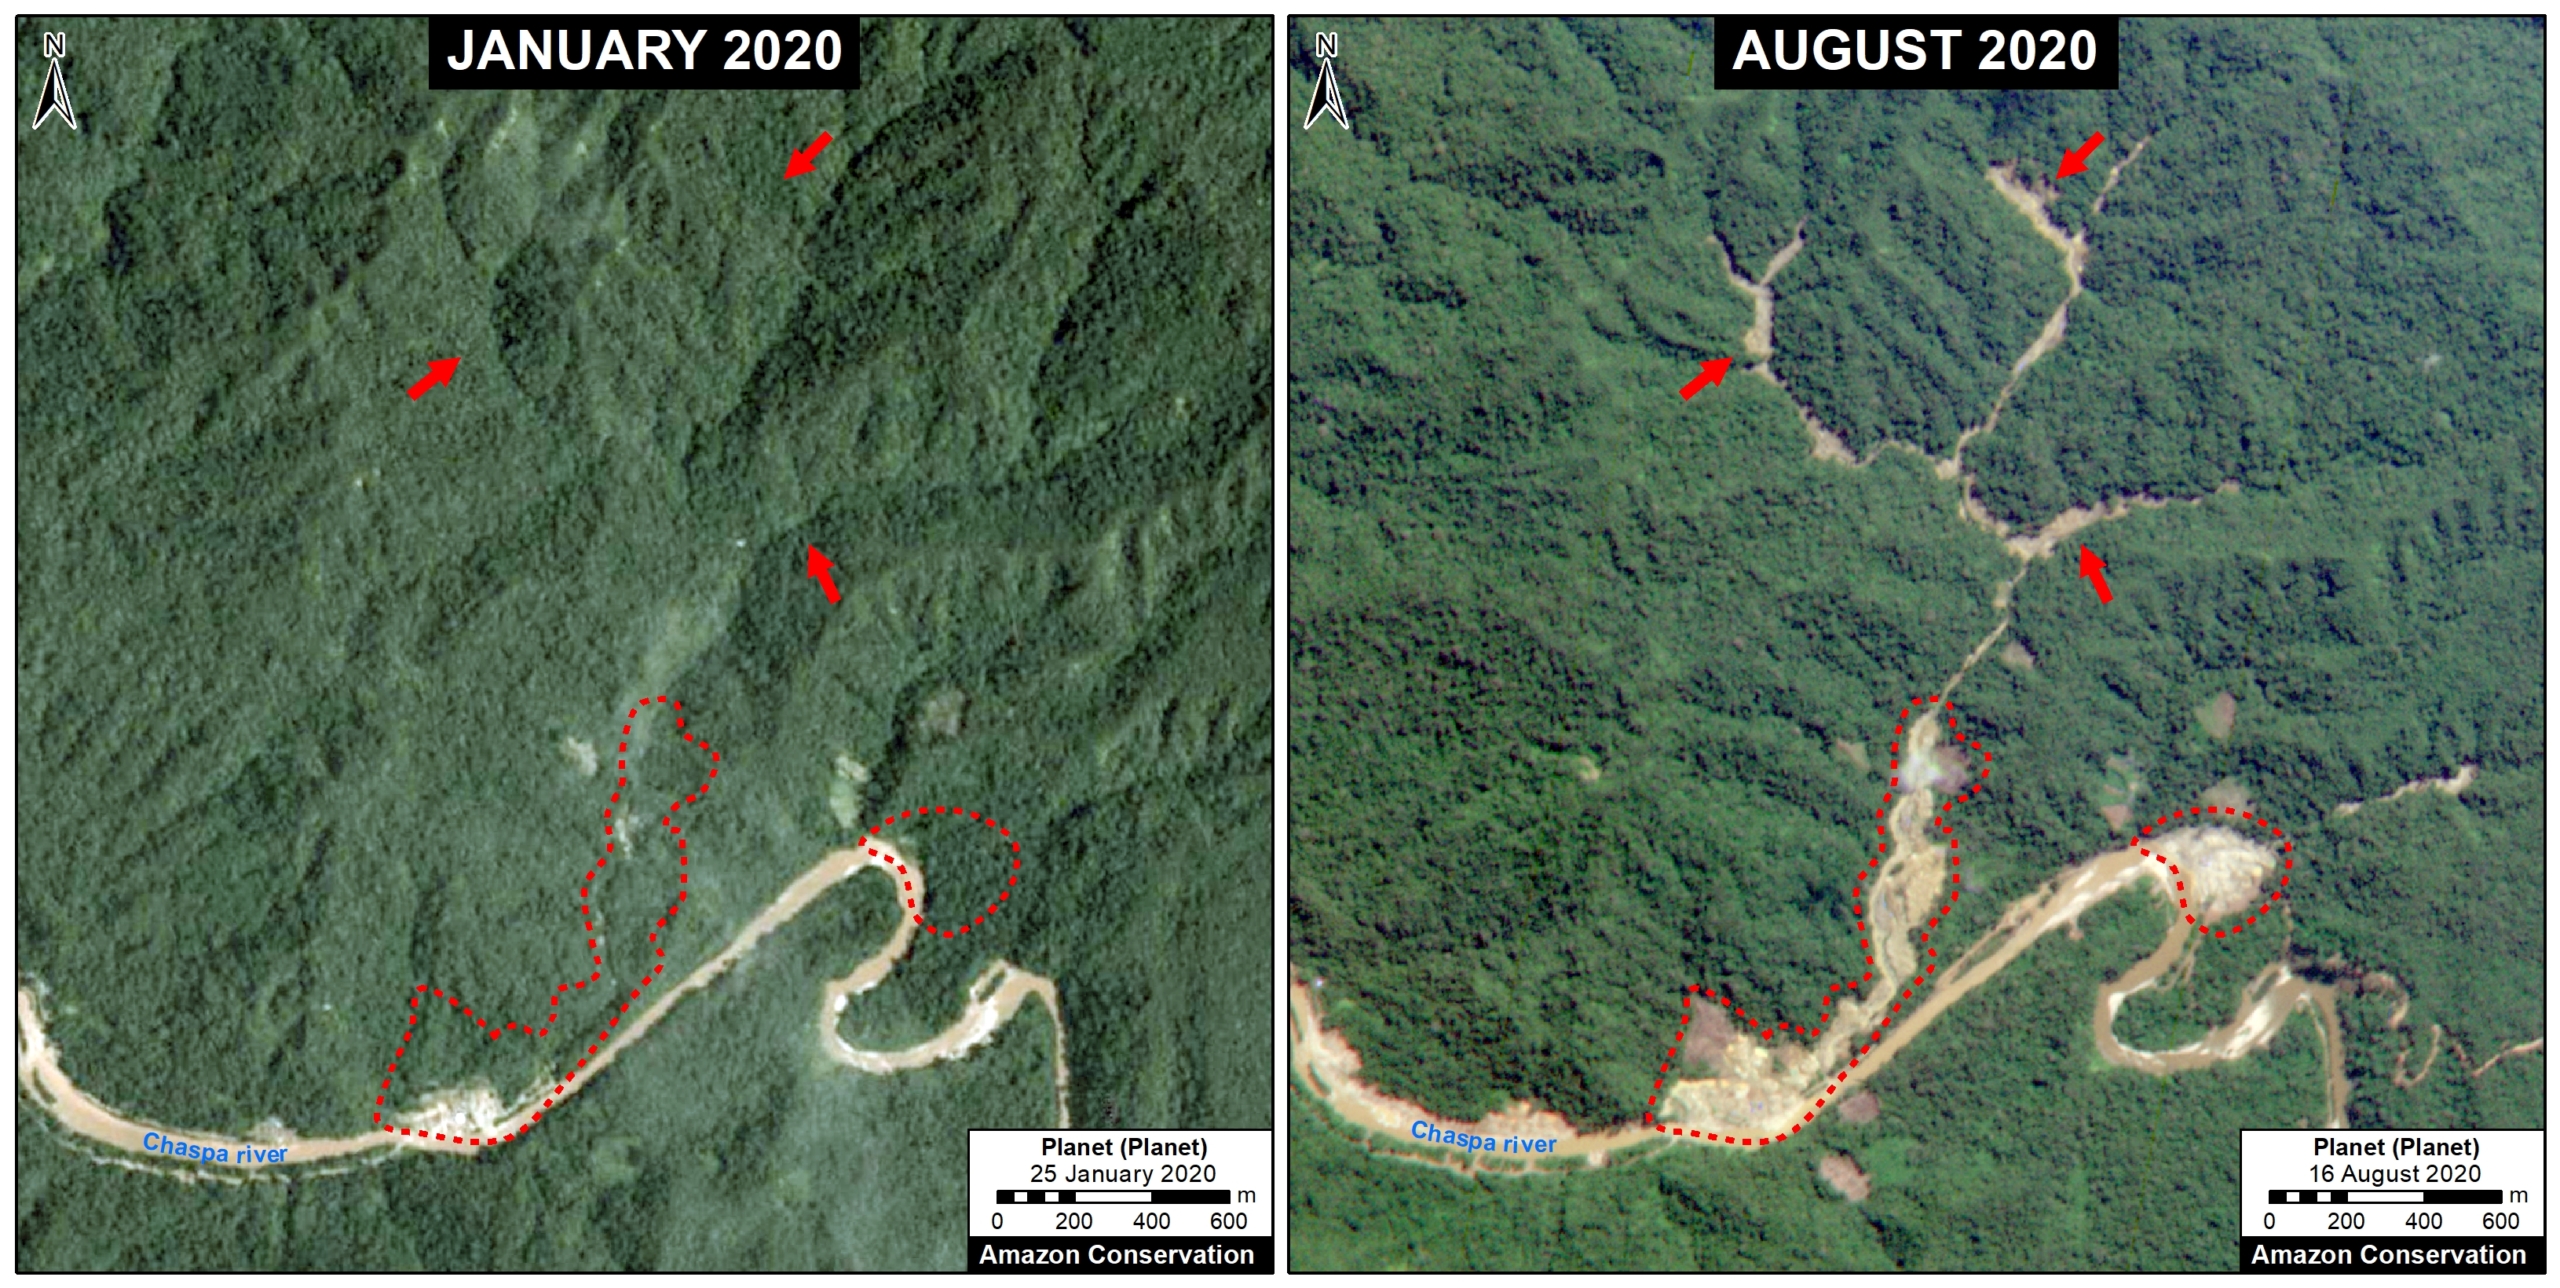
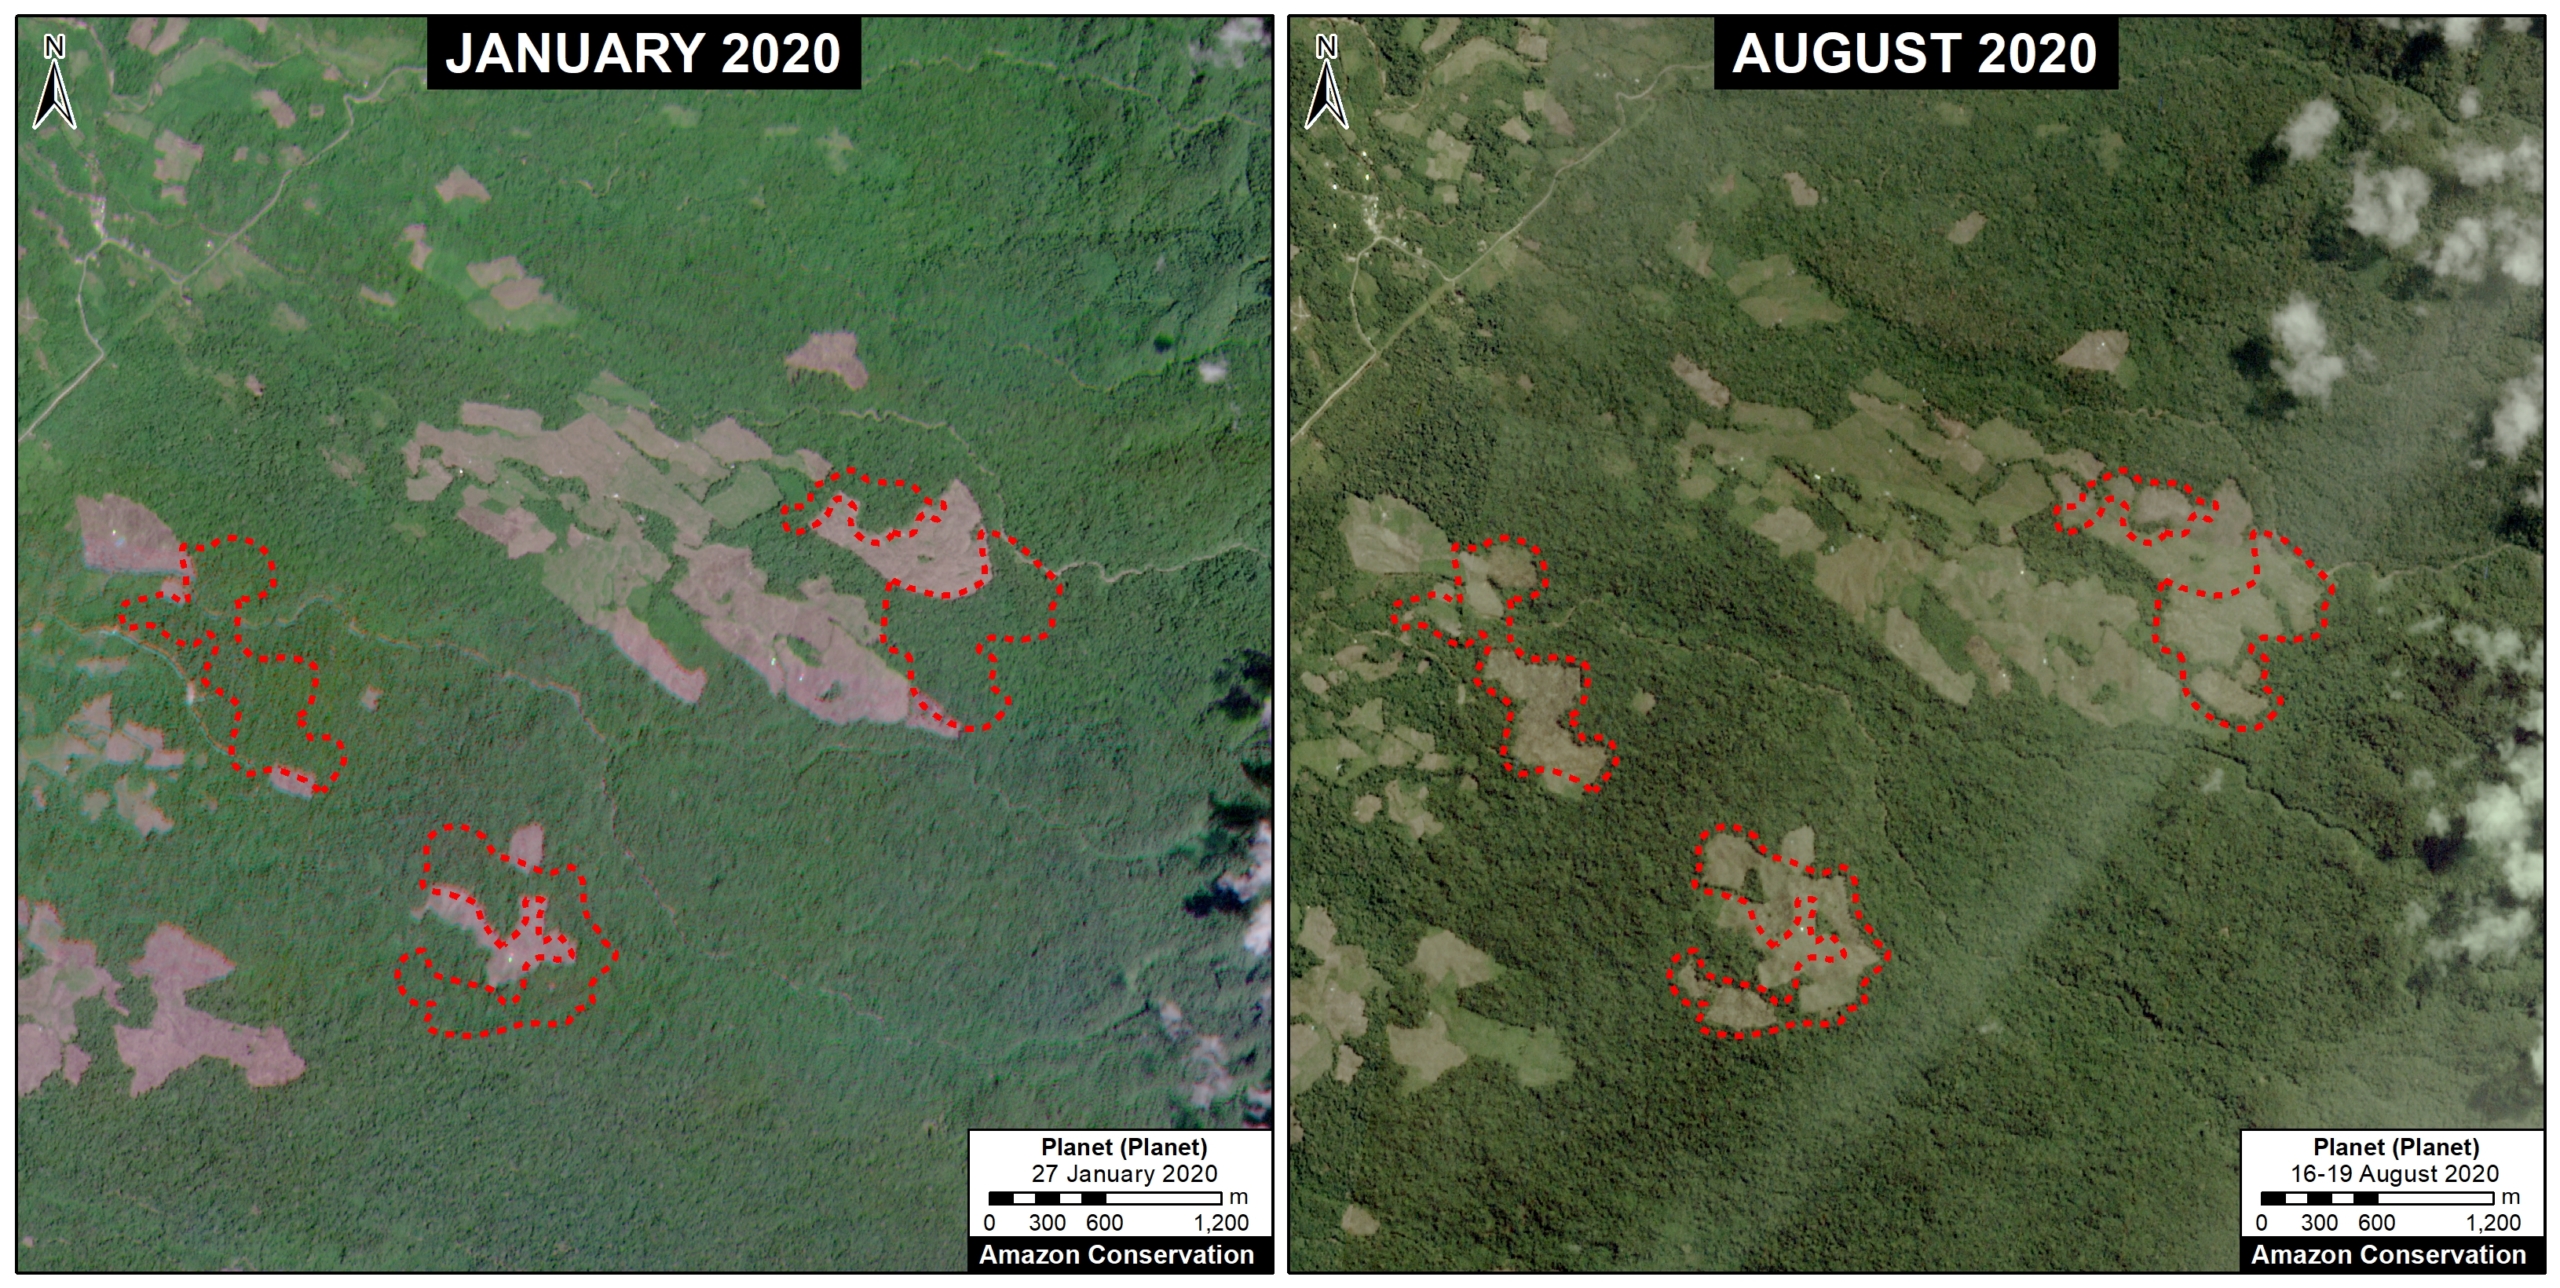
The following image shows the gold mining deforestation of 52 acres (21 hectares) of primary forest along the Pariamanu River in the southern Peruvian Amazon (Madre de Dios region) between January (left panel) and August (right panel) of 2020. We highlight that the Peruvian government has just carried out an operation against the illegal mining activity in this area.

Pariamanu case (illegal gold mining). Data: Planet, MAAP.

B. Araza

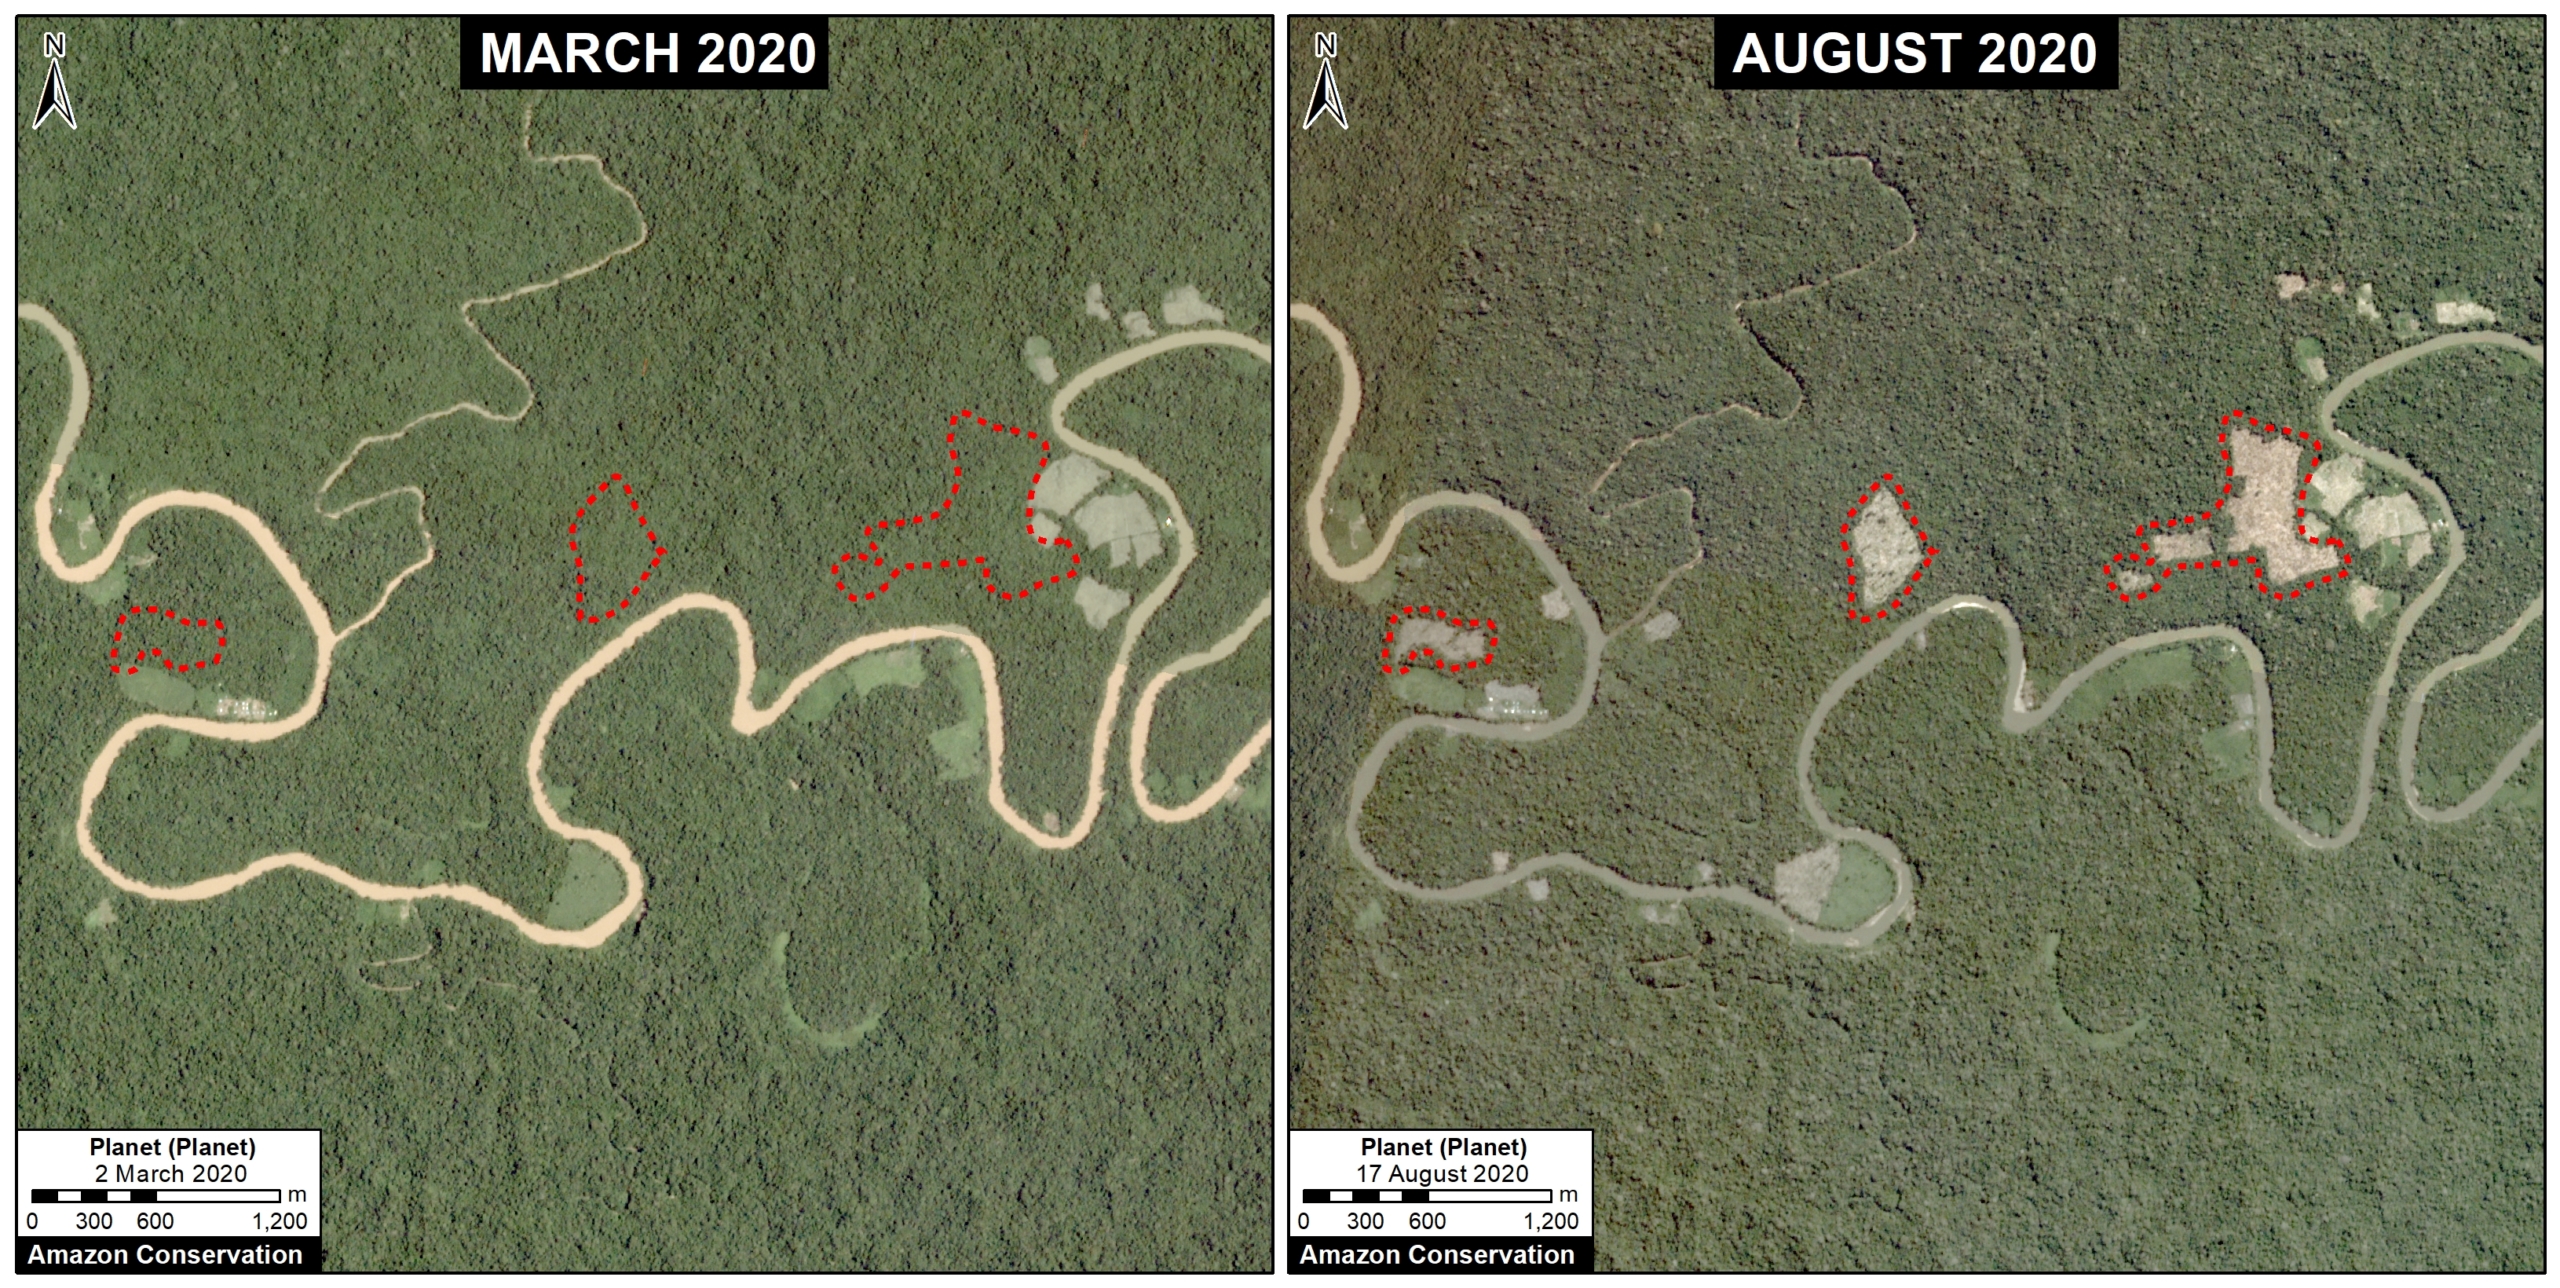
The following image shows the gold mining deforestation of 114 acres (46 hectares) along the Chaspa River in the Puno region, between January (left panel) and August (right panel) of 2020.

Araza case. Data: Planet, MAAP.

2. Large-scale Agriculture

C. Mennonite Colony (near Tierra Blanca)

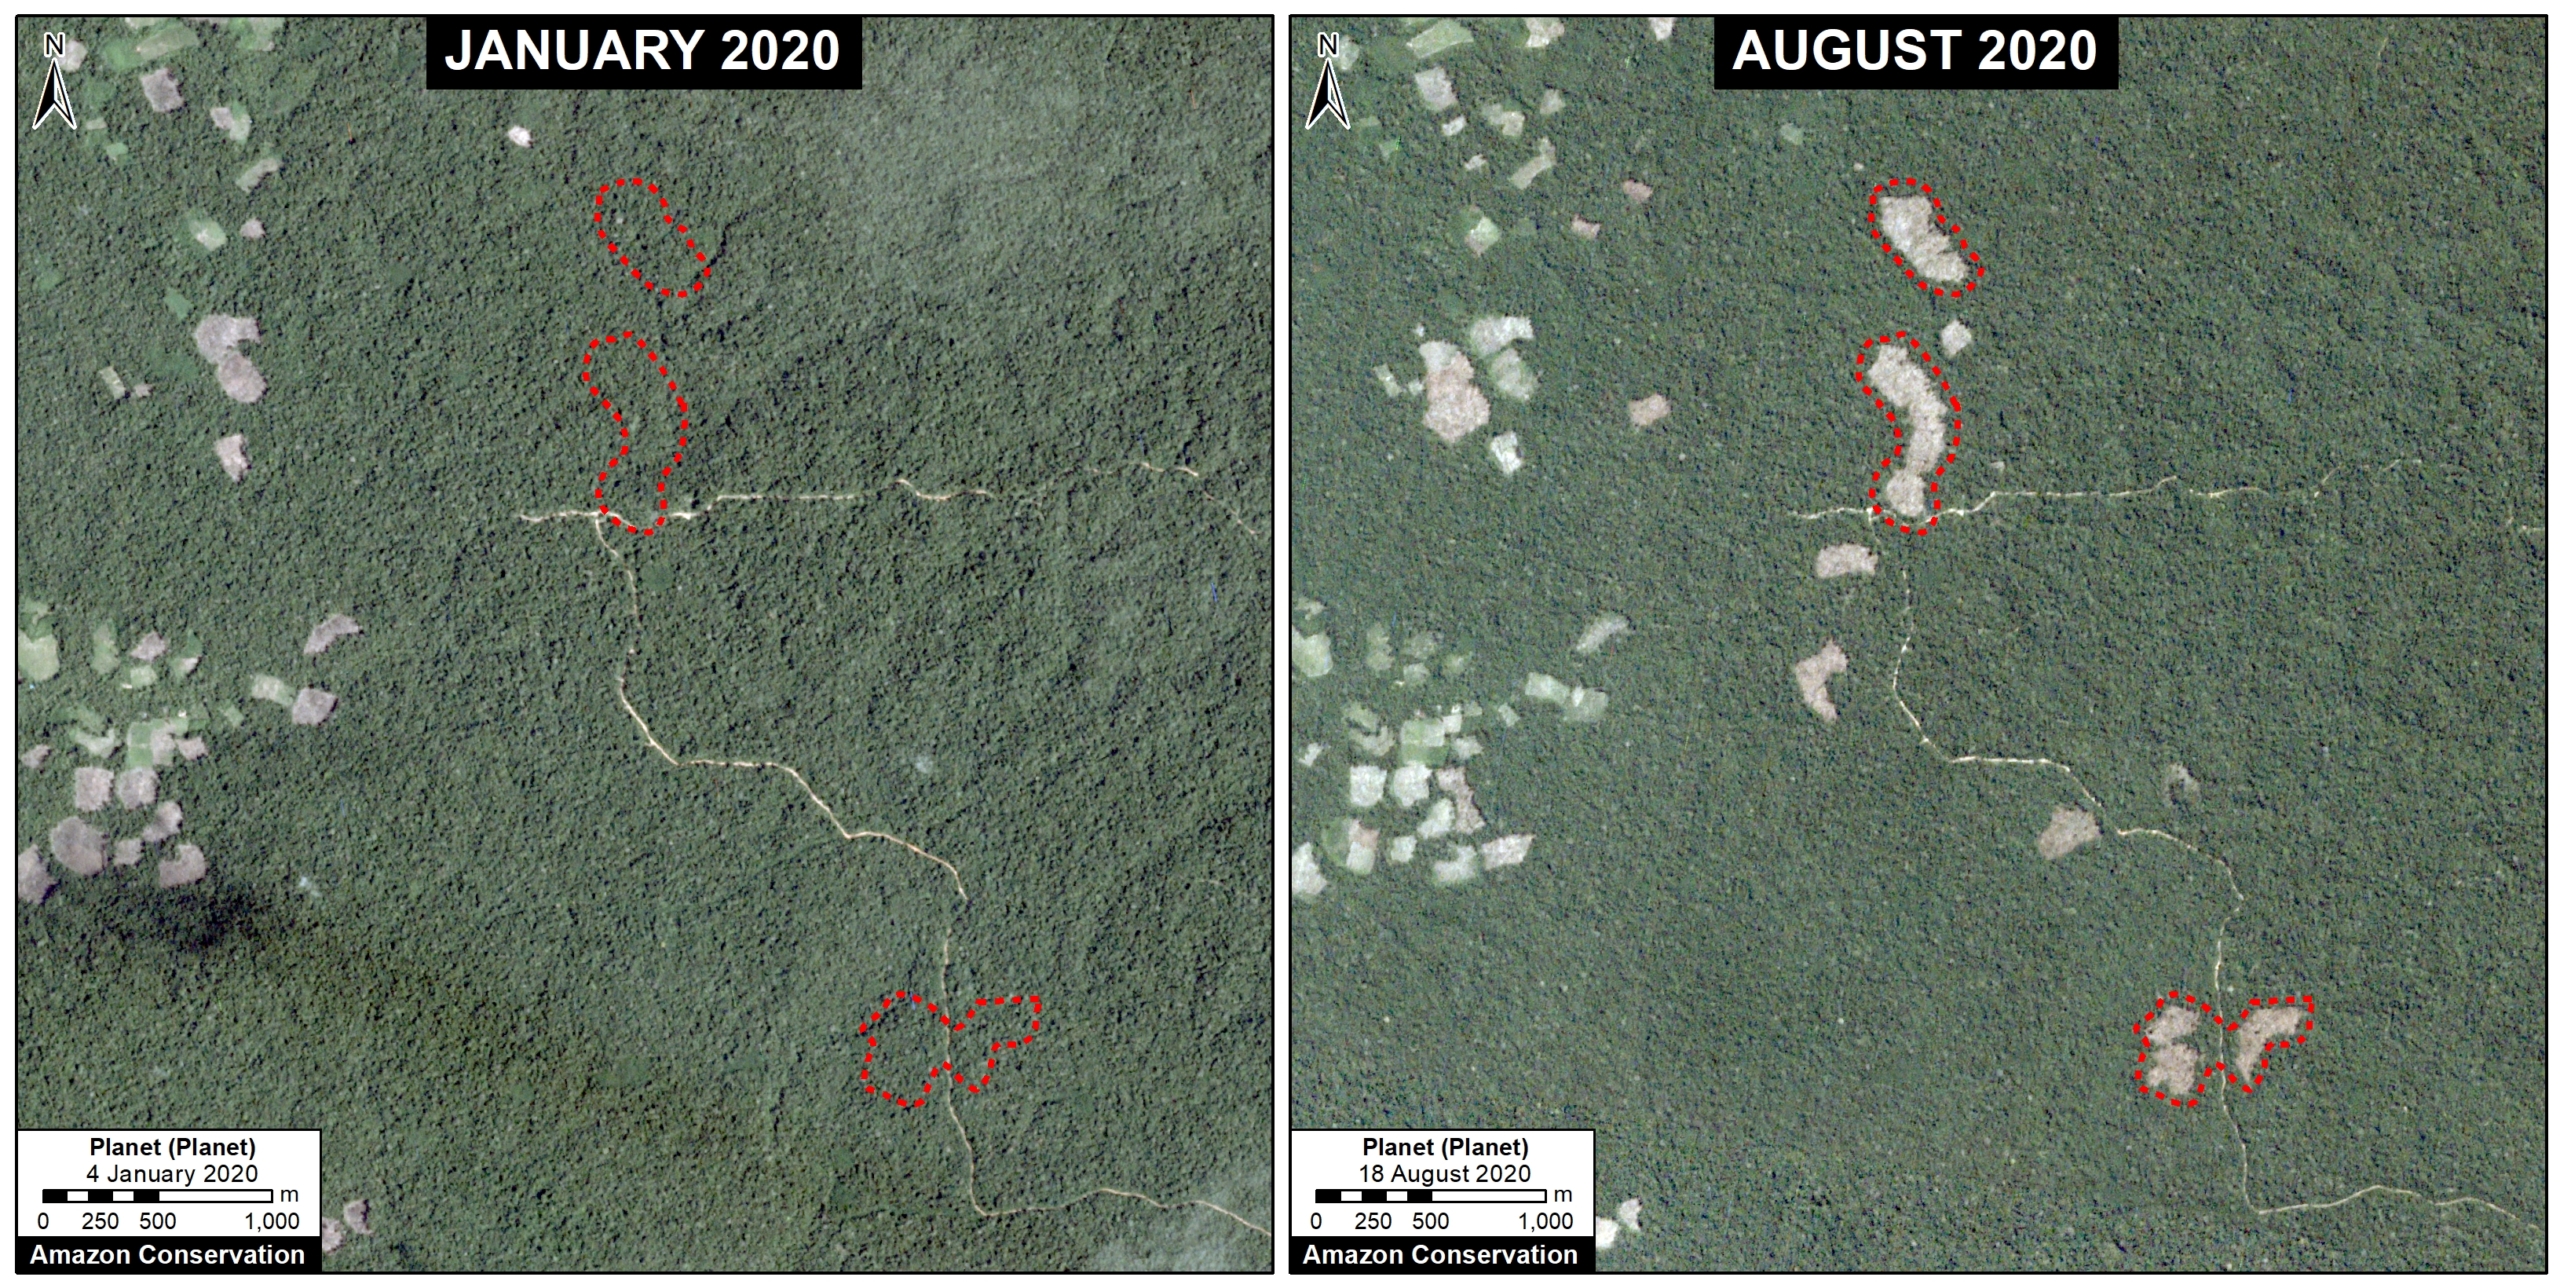
We reported last year that a new colony of Mennonites caused the deforestation of 4,200 acres (1,700 hectares) between 2017 and 2019 in the Loreto region (MAAP #112). The following image shows the additional deforestation of 820 acres (332 hectares) in 2020 between January (left panel) and August (right panel).

Mennonite case (near Tierra Blanca). Data: Planet, MAAP.

3. Small-scale Agriculture

D. Jeberos

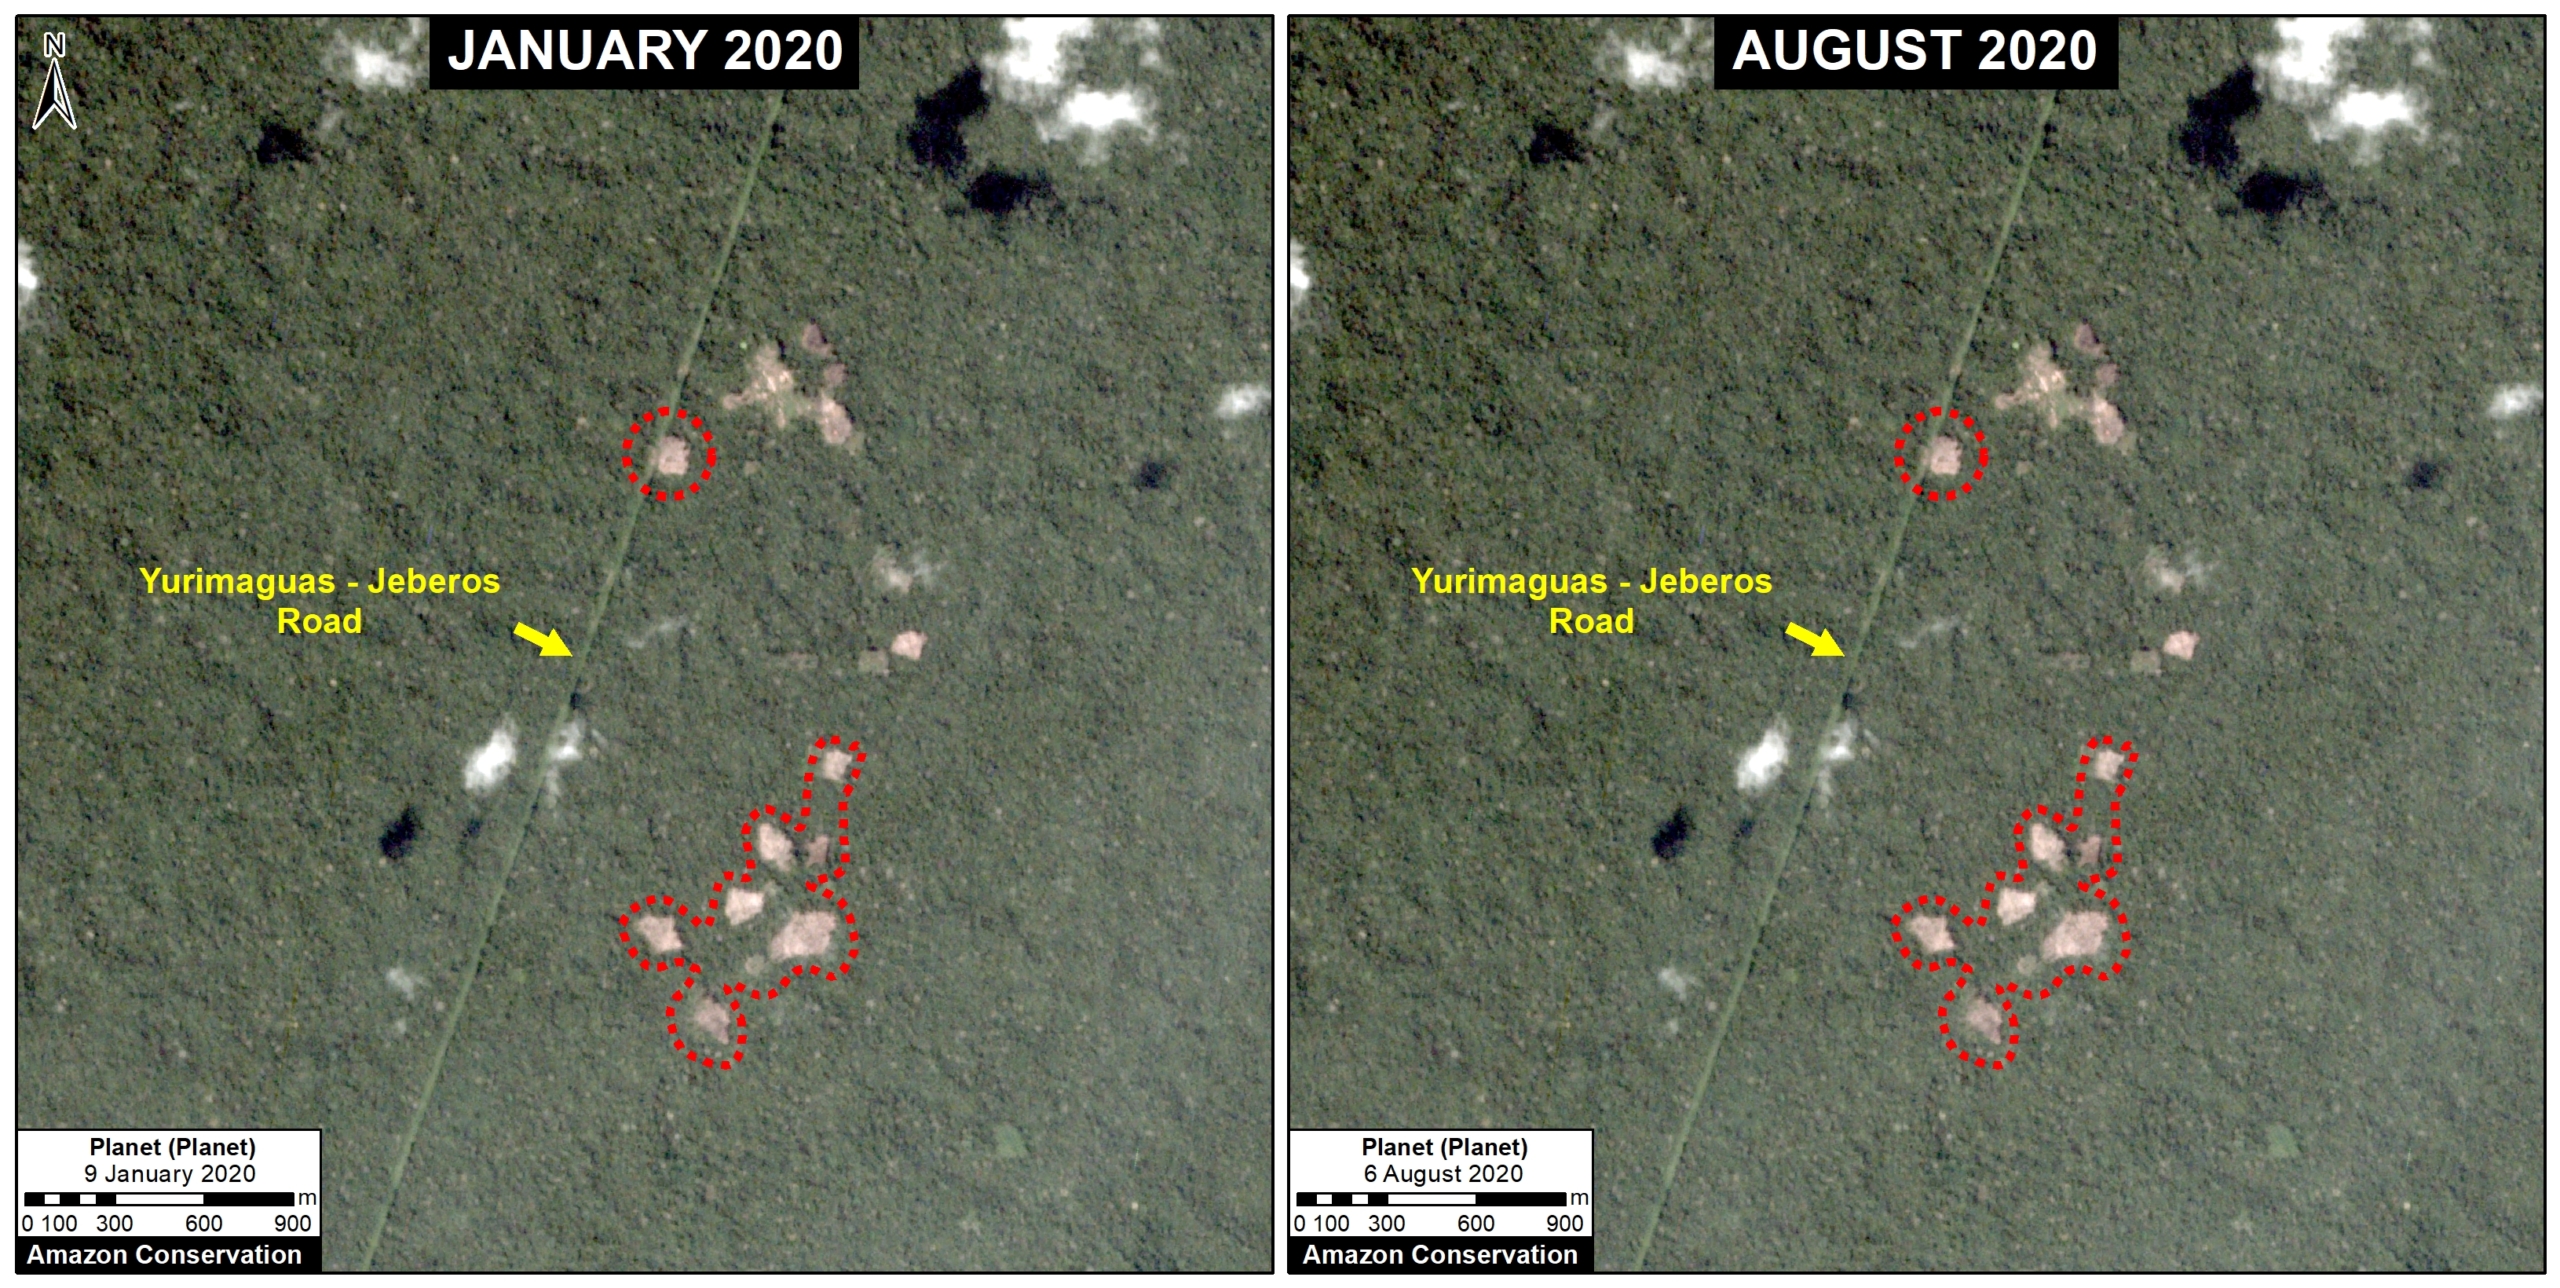
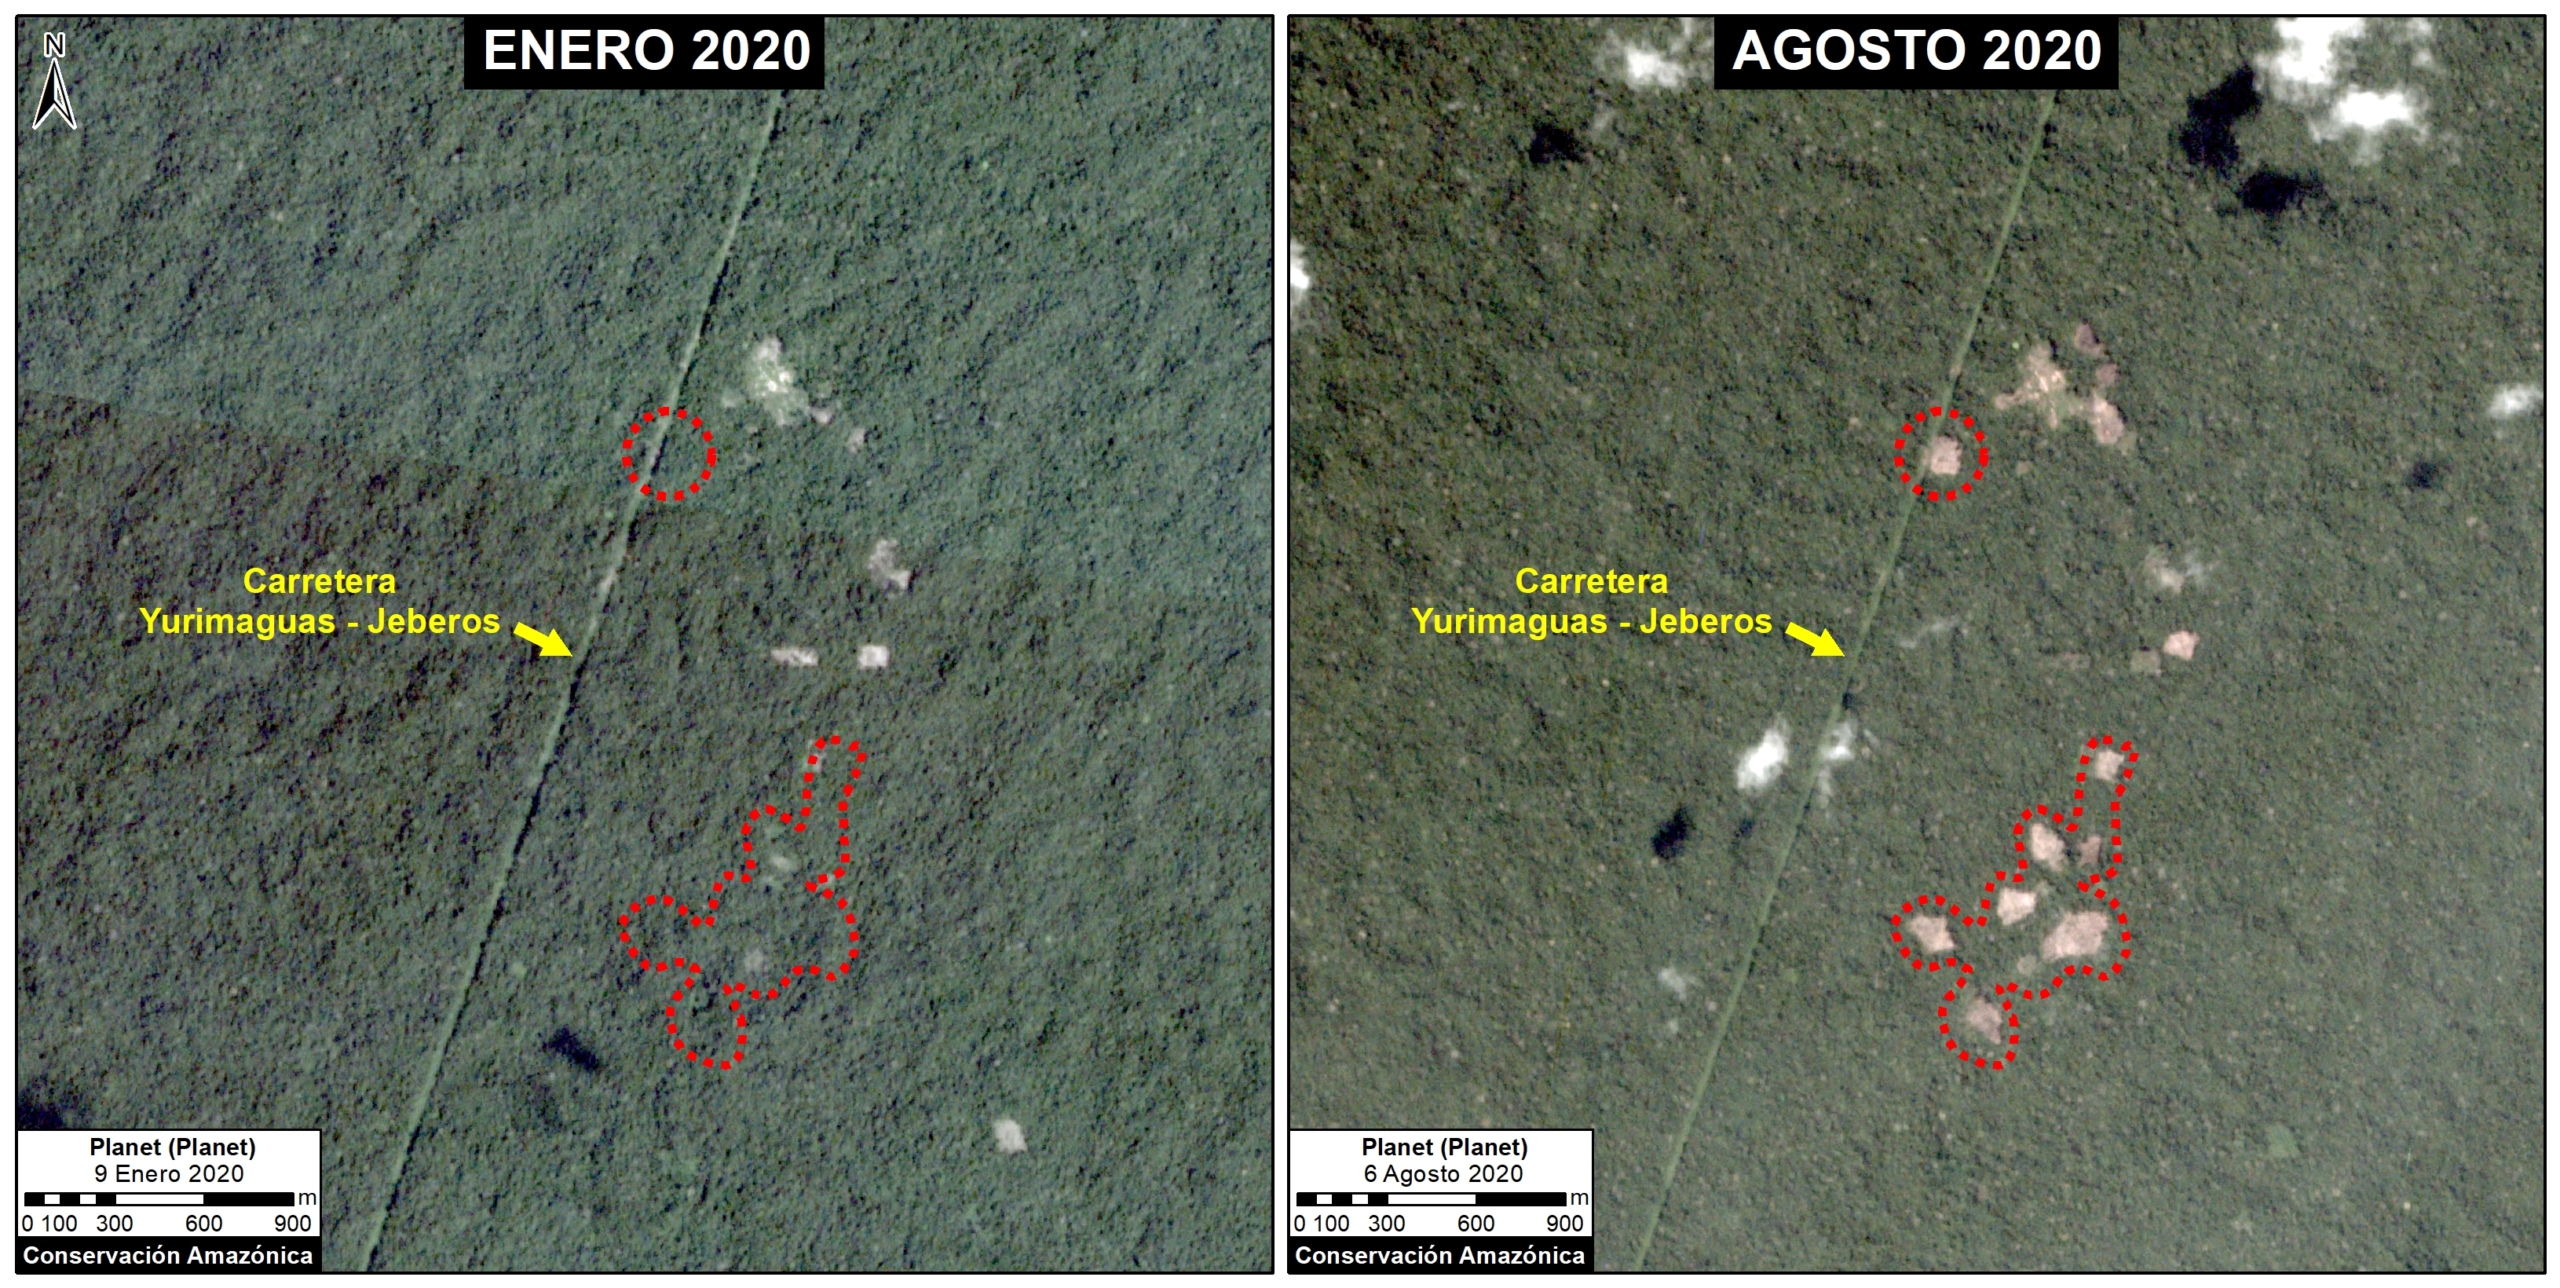
In 2018, we reported on the construction of a new road (65 km) cutting through primary forest in the Loreto region, between the city of Yurimaguas and the town of Jeberos (MAAP #84). The following image shows the deforestation of 40 acres (16 hectares) along the new road in 2020, between January (left panel) and August (right panel).

Jeberos case (near Tierra Blanca). Data: Planet, MAAP.

E. Las Piedras

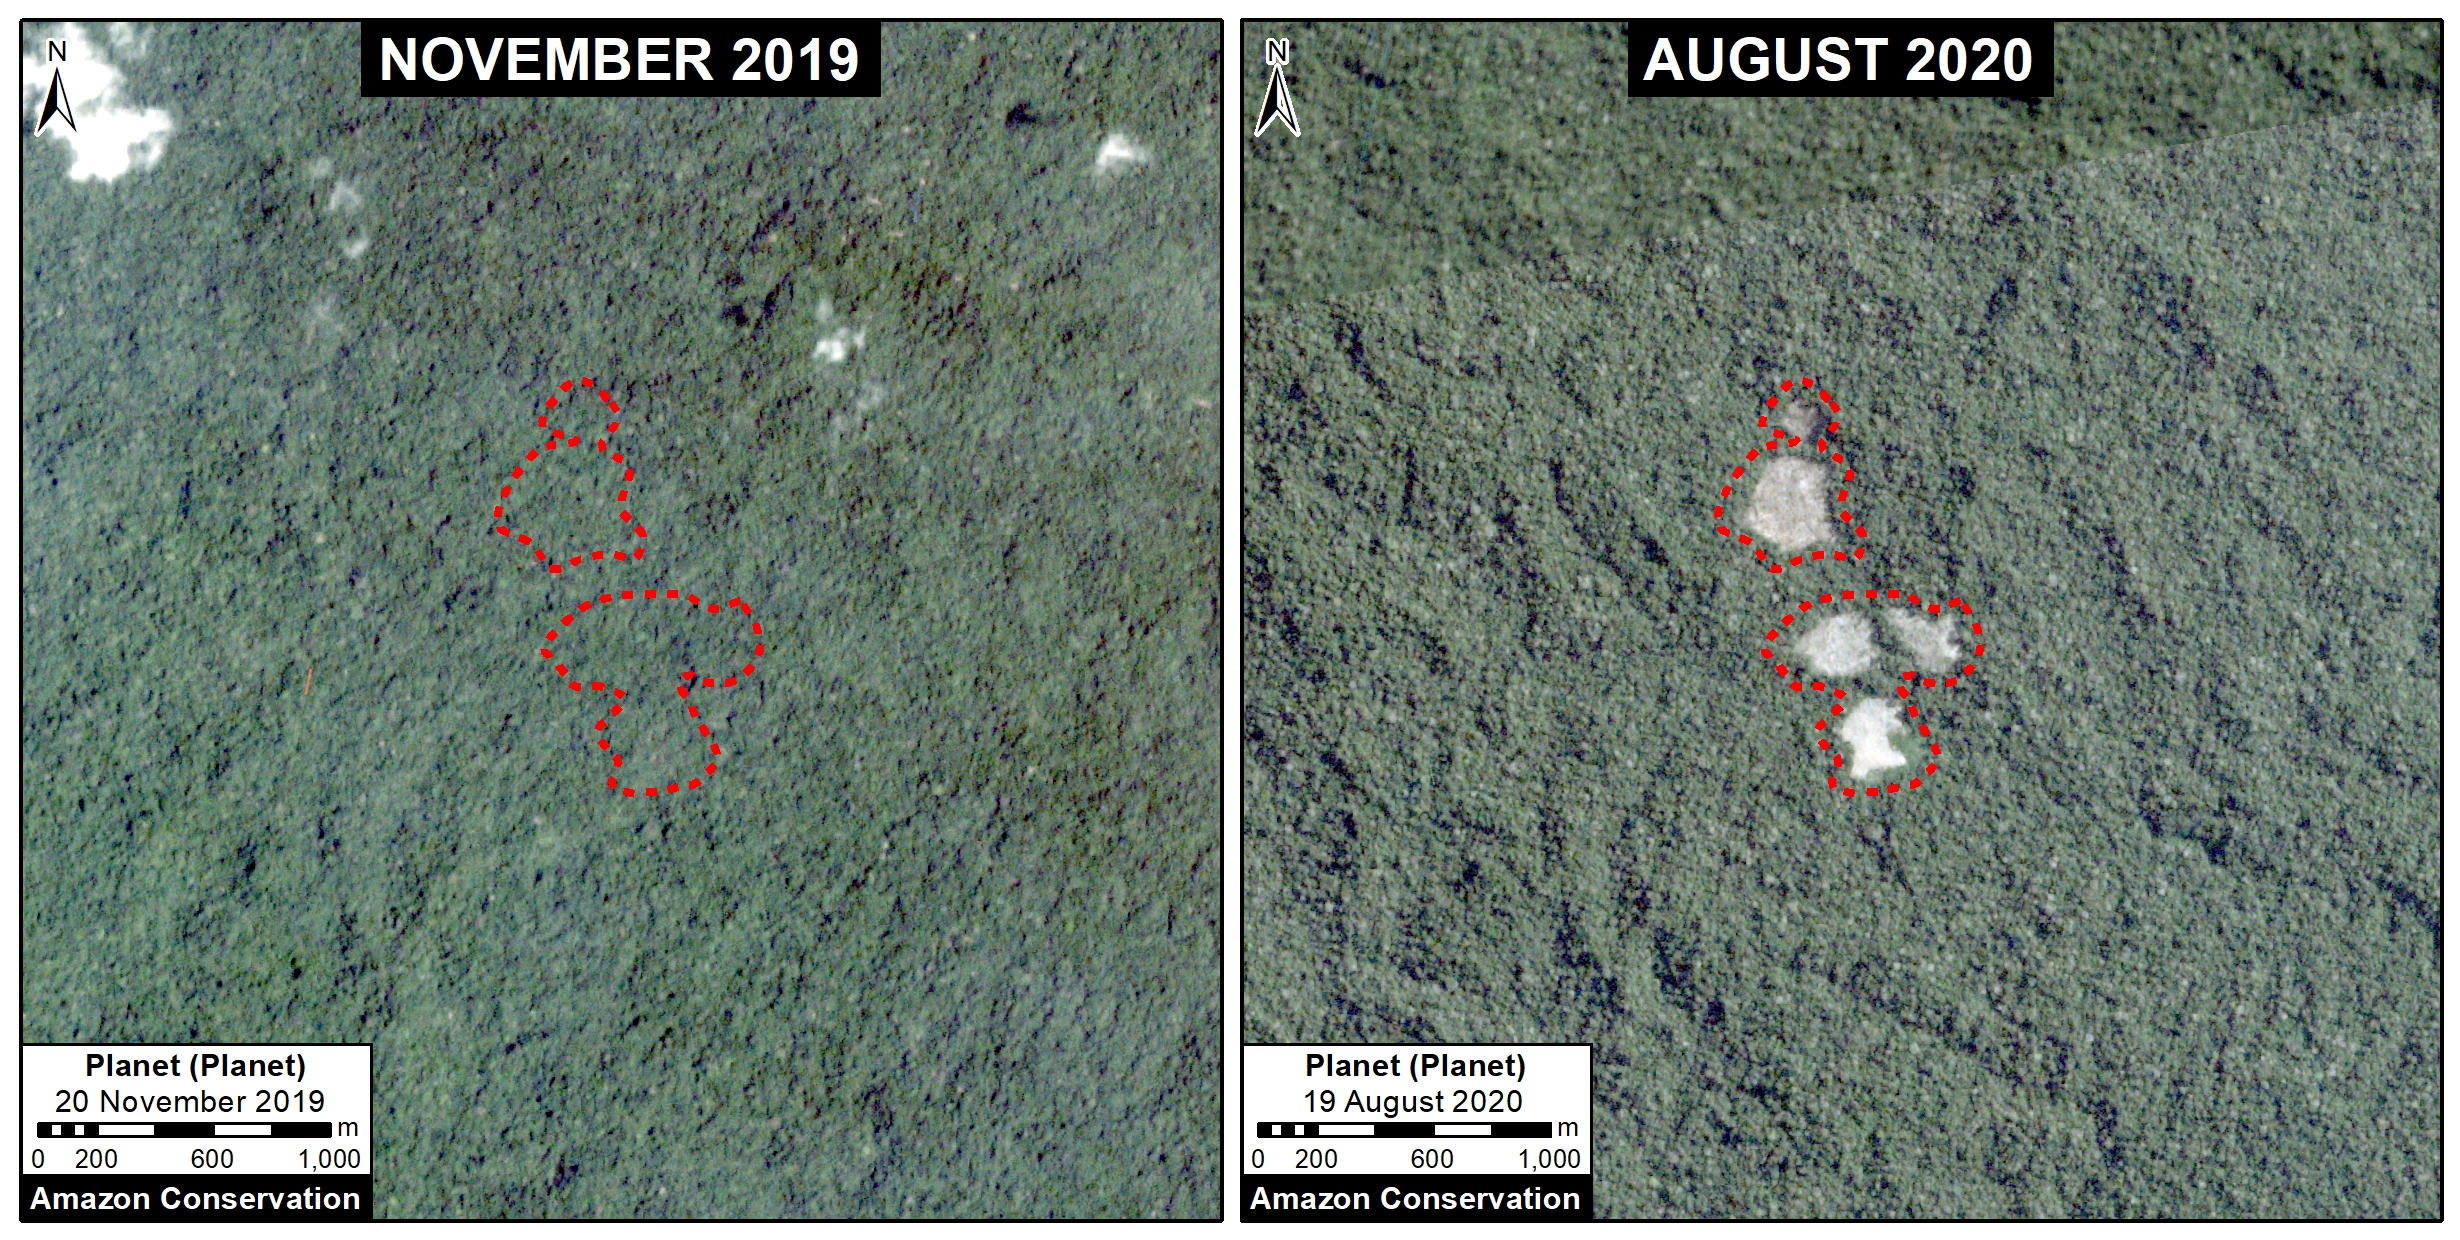
The following image shows the deforestation of 64 acres (26 hectares) of primary forest in a Brazil-nut concession along the Las Piedras River in the Madre de Dios region, between November 2019 (left panel) and August 2020 (right panel) .

Las Piedras case. Data: Planet, MAAP.

F. Bolognesi

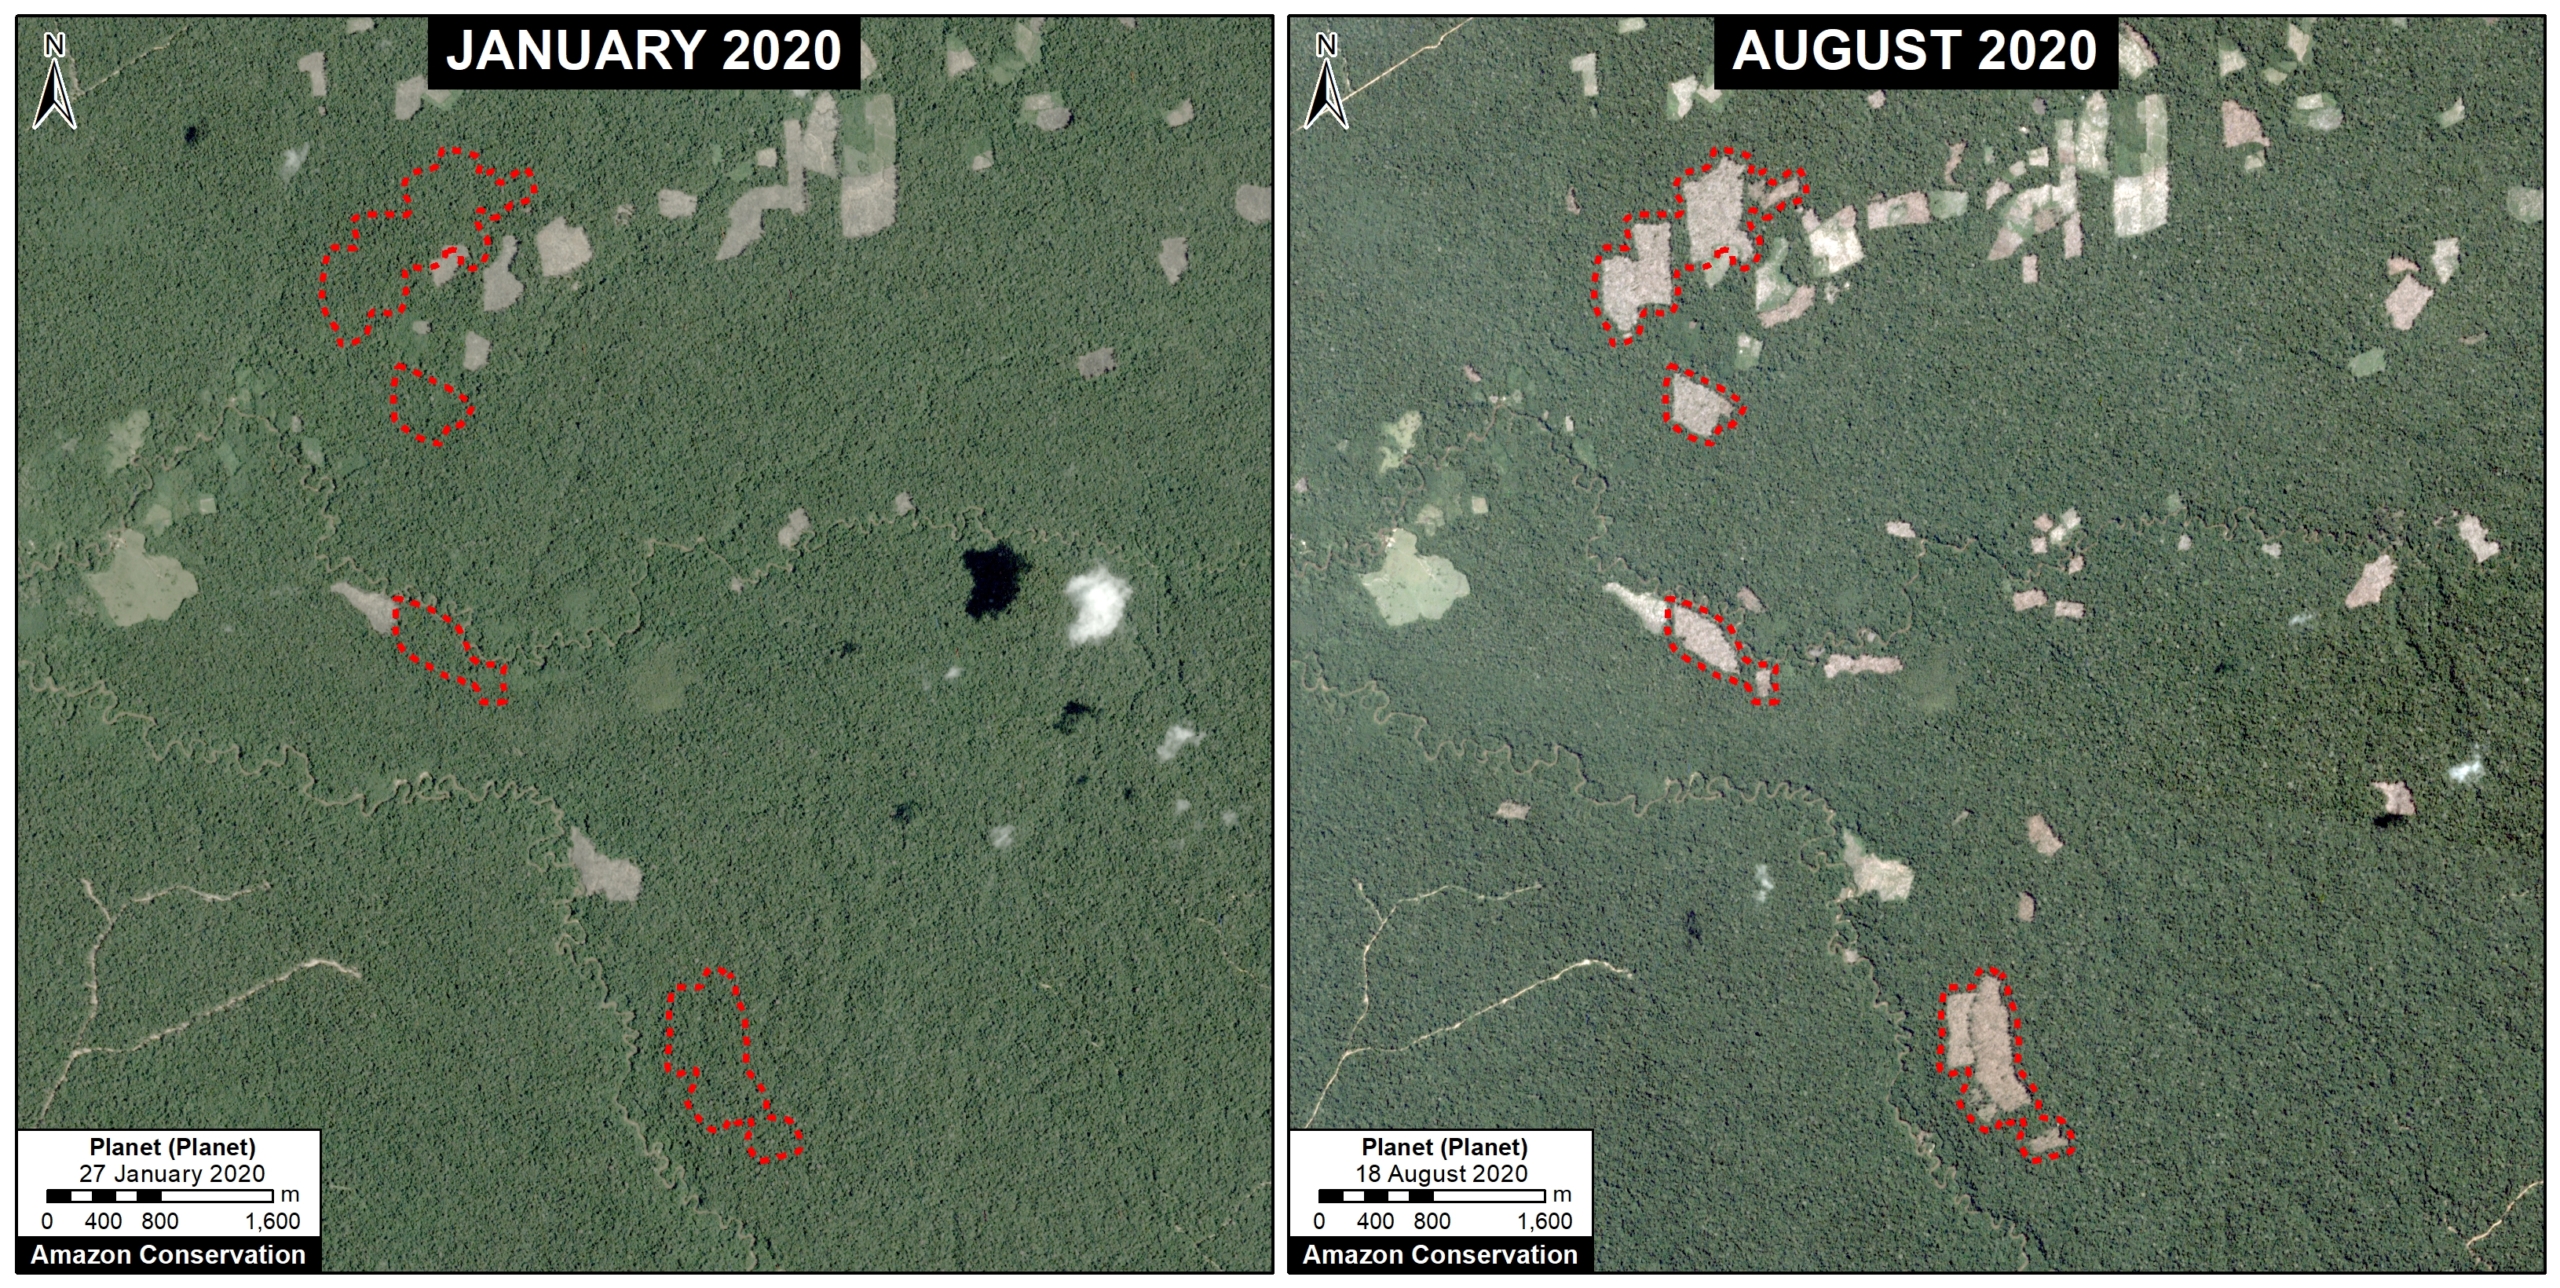
The following image shows an example of deforestation (580 acres or 235 hectares) in one of the areas with the highest concentration of forest loss, located in the Ucayali region.

Bolognesi case. Data: Planet, MAAP.

G. Santa Maria de Nieva

The following image shows an example of deforestation(346 acres or 140 hectares) in another one of the areas with the highest concentration of forest loss, located in the Amazonas region.

Santa Maria de Nieva case. Data: Planet, MAAP.

H. Mishahua River

The following image shows the recent deforestation of 168 acres (68 hectares) along the Mishahua River, in the Ucayali region. Just to the north, we documented extensive deforestation along the Sepahua River in 2019, where it also appears to be starting up again in 2020.

Mishahua case. Data: Planet, MAAP.

I. South of Sierra del Divisor National Park

The following image shows an example of deforestation (166 acres or 67 hectares) in another one of the areas with the highest concentration of forest loss, located south of the Sierra del Divisor National Park in the Ucayali region.

Mishahua case. Data: Planet, MAAP.


Metodology

The analysis was based on early warning GLAD alerts from the Universidad de Maryland and Global Forest Watch.

To identify the deforestation hotspots, we conducted a kernel density estimate. This type of analysis calculates the magnitude per unit area of a particular phenomenon, in this case forest cover loss. We conducted this analysis using the Kernel Density tool from Spatial Analyst Tool Box of ArcGIS. We used the following parameters:

Search Radius: 15000 layer units (meters)
Kernel Density Function: Quartic kernel function
Cell Size in the map: 200 x 200 meters (4 hectares)
Everything else was left to the default setting.

For the Base Map, we used the following concentration percentages: Medium: 7-10%; High: 11-20%; Very High: >20%.

Acknowledgements

We thank S. Novoa and G. Palacios for helpful comments to earlier versions of this report.

This work was supported by the following major funders: Erol Foundation, Norwegian Agency for Development Cooperation (NORAD), and International Conservation Fund of Canada (ICFC).

Citation

Finer M, Mamani N (2020) Deforestation Hotspots 2020 in the Peruvian Amazon. MAAP: 124.

MAAP #124: Deforestation Hotspots 2020 in the Peruvian Amazon

Base Map. 2020 Forest Loss Hotspots in the Peruvian Amazon. Data: UMD/GLAD, MAAP, SERNANP.

We have entered the peak deforestation season in the Peruvian Amazon, so it is also a critical time for real-time monitoring (MAAP’s specialty).

Here, we highlight the major deforestation events documented so far in 2020 (through August 23).

The Base Map shows the current forest loss hotspots, indicated by the colors yellow, orange and red.

Below, we present the most urgent deforestation cases, caused by gold mining and agriculture (both large and small scale), the current leading deforestation drivers in Peru.

The Letters A-I on the Base Map correspond to the location of the cases described below.

One of the key cases is the new illegal gold mining hotspot along the Pariamanu river (Letter A in the southern Peruvian Amazon).

Another important case is the expanding large-scale agriculture by a Mennonite colony that continues causing an alarming deforestation.

The other cases deal with small-scale agriculture, which cumulatively represent the main deforestation driver in Peru.


Urgent Deforestation Cases 2020

1. Gold Mining

In MAAP #121, we reported that, in general, gold mining deforestation has decreased in the southern Peruvian Amazon following the government’s Operation Mercury, but it does continue in several critical areas. The images below show two of these areas (Pariamanu and Araza) with alarming new deforestation in 2020.

A. Pariamanu

The following image shows the gold mining deforestation of 52 acres (21 hectares) of primary forest along the Pariamanu River in the southern Peruvian Amazon (Madre de Dios region) between January (left panel) and August (right panel) of 2020. We highlight that the Peruvian government has just carried out an operation against the illegal mining activity in this area.

Pariamanu case (illegal gold mining). Data: Planet, MAAP.

B. Araza

The following image shows the gold mining deforestation of 114 acres (46 hectares) along the Chaspa River in the Puno region, between January (left panel) and August (right panel) of 2020.

Araza case. Data: Planet, MAAP.

2. Large-scale Agriculture

C. Mennonite Colony (near Tierra Blanca)

We reported last year that a new colony of Mennonites caused the deforestation of 4,200 acres (1,700 hectares) between 2017 and 2019 in the Loreto region (MAAP #112). The following image shows the additional deforestation of 820 acres (332 hectares) in 2020 between January (left panel) and August (right panel).

Mennonite case (near Tierra Blanca). Data: Planet, MAAP.

3. Small-scale Agriculture

D. Jeberos

In 2018, we reported on the construction of a new road (65 km) cutting through primary forest in the Loreto region, between the city of Yurimaguas and the town of Jeberos (MAAP #84). The following image shows the deforestation of 40 acres (16 hectares) along the new road in 2020, between January (left panel) and August (right panel).

Jeberos case (near Tierra Blanca). Data: Planet, MAAP.


E. Las Piedras

The following image shows the deforestation of 64 acres (26 hectares) of primary forest in a Brazil-nut concession along the Las Piedras River in the Madre de Dios region, between November 2019 (left panel) and August 2020 (right panel) .

Las Piedras case. Data: Planet, MAAP.

F. Bolognesi

The following image shows an example of deforestation (580 acres or 235 hectares) in one of the areas with the highest concentration of forest loss, located in the Ucayali region.

Bolognesi case. Data: Planet, MAAP.

G. Santa Maria de Nieva

The following image shows an example of deforestation(346 acres or 140 hectares) in another one of the areas with the highest concentration of forest loss, located in the Amazonas region.

Santa Maria de Nieva case. Data: Planet, MAAP.

H. Mishahua River

The following image shows the recent deforestation of 168 acres (68 hectares) along the Mishahua River, in the Ucayali region. Just to the north, we documented extensive deforestation along the Sepahua River in 2019, where it also appears to be starting up again in 2020.

Mishahua case. Data: Planet, MAAP.

I. South of Sierra del Divisor National Park

The following image shows an example of deforestation (166 acres or 67 hectares) in another one of the areas with the highest concentration of forest loss, located south of the Sierra del Divisor National Park in the Ucayali region.

Mishahua case. Data: Planet, MAAP.


Metodology

The analysis was based on early warning GLAD alerts from the Universidad de Maryland and Global Forest Watch.

To identify the deforestation hotspots, we conducted a kernel density estimate. This type of analysis calculates the magnitude per unit area of a particular phenomenon, in this case forest cover loss. We conducted this analysis using the Kernel Density tool from Spatial Analyst Tool Box of ArcGIS. We used the following parameters:

Search Radius: 15000 layer units (meters)
Kernel Density Function: Quartic kernel function
Cell Size in the map: 200 x 200 meters (4 hectares)
Everything else was left to the default setting.

For the Base Map, we used the following concentration percentages: Medium: 7-10%; High: 11-20%; Very High: >20%.

Acknowledgements

We thank S. Novoa and G. Palacios for helpful comments to earlier versions of this report.

This work was supported by the following major funders: Erol Foundation, Norwegian Agency for Development Cooperation (NORAD), and International Conservation Fund of Canada (ICFC).

Citation

Finer M, Mamani N (2020) Deforestation Hotspots 2020 in the Peruvian Amazon. MAAP: 124.

MAAP #123: Detecting Illegal Logging in the Peruvian Amazon

Image 1. Example of a 2019 logging road with signs of illegality. Data: Planet.

In the Peruvian Amazon, the widespread illegal logging is difficult to detect with satellites because it is selective for high-value species (not clearcutting).

It is possible, however, to detect the associated logging roads.

In this report, we present a novel technique to identify illegal logging: analyze new logging roads in relation to detailed land use data available from government agencies.

Thus, our new method detects the crime in real-time and preventive action is still possible. This is important because when an intervention against illegal logging normally occurs, stopping a boat or truck with illegal timber, the damage is done.

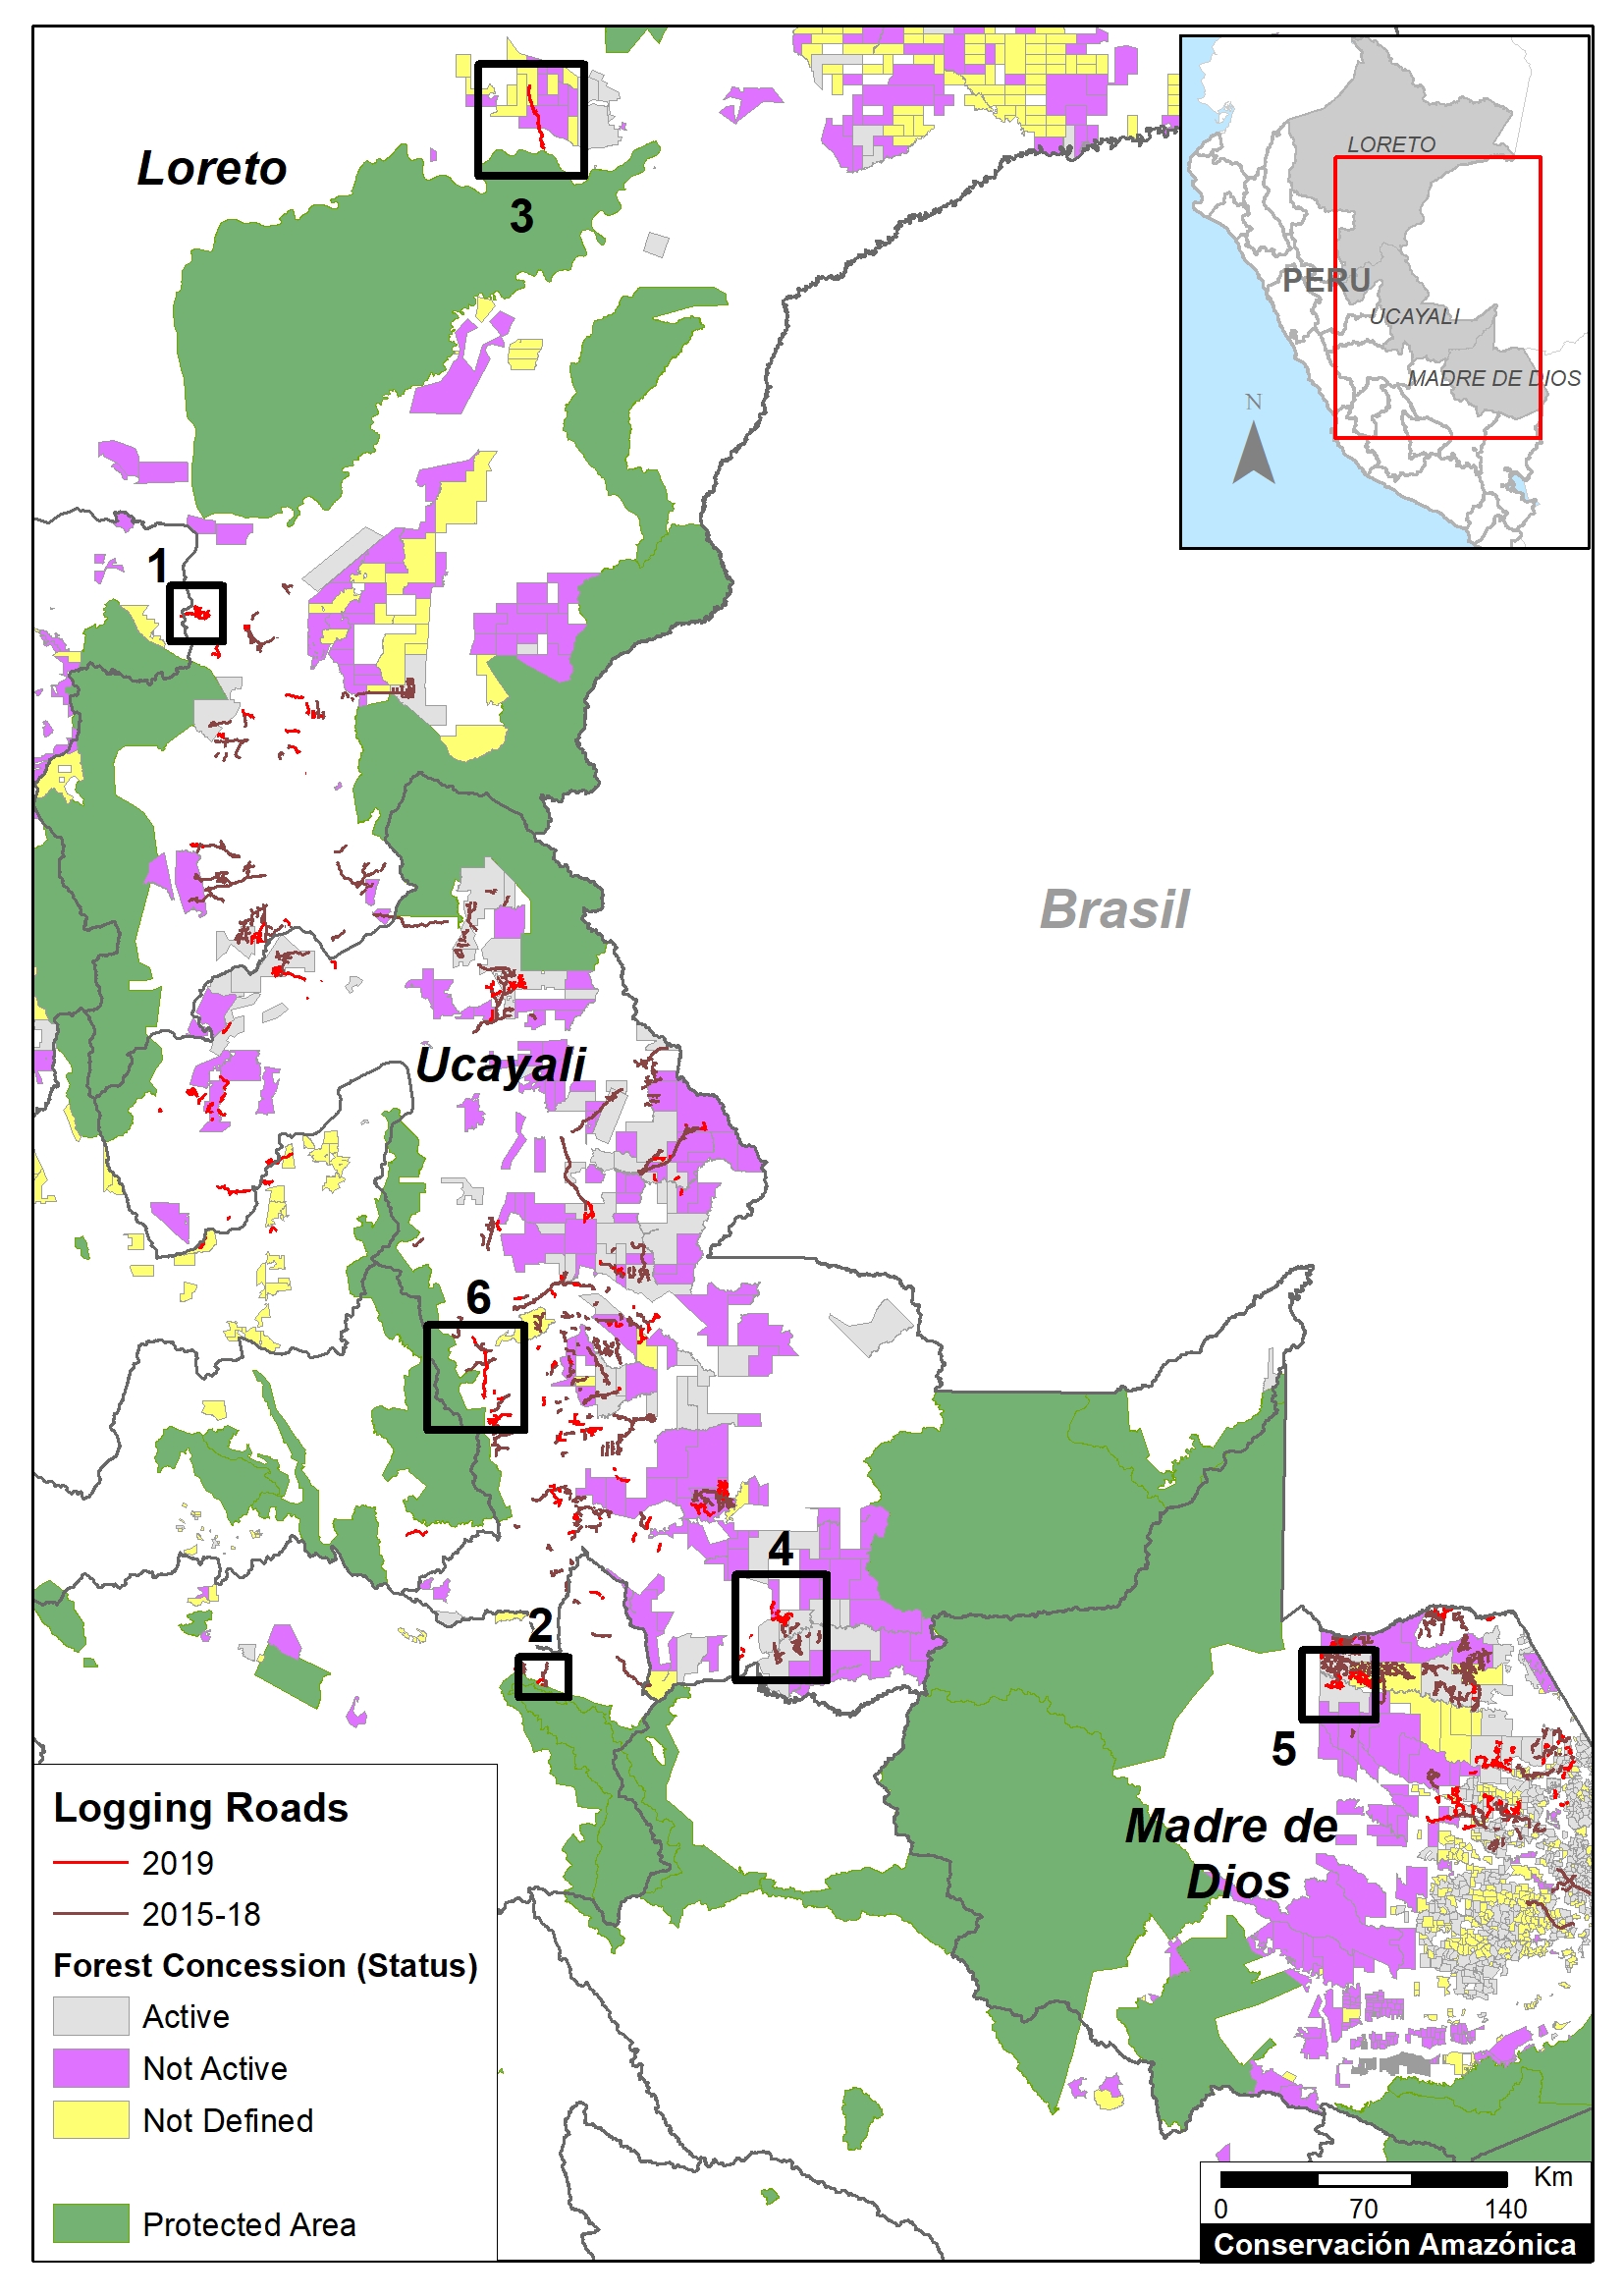
This analysis has two parts. First, we identified the new logging roads built in the Peruvian Amazon during 2019, updating our previous work for 2015-18 (see Base Map).

Second, we analyzed the new logging road data in relation to governmental land use information in order to identify possible illegality.

This data is from 2019, but we are now applying this technique in real time during 2020.

Base Map. 2019 Logging roads, in relation to 2015-18 logging roads. Data: MAAP.

Logging Roads 2019

The Base Map illustrates the location of logging roads built in the Peruvian Amazon during the last 5 years.

Previously (MAAP #99), we documented the construction of 3,300 kilometers of logging roads between 2015 and 2018.

Here, we estimate the construction of an additional 1,500 kilometers in 2019 (see red).

Note that forest roads are mainly concentrated in the Ucayali, Madre de Dios and Loreto regions.

Below, we show three types of possible illegality that detected in 2019:

  • Logging roads in areas without forestry concessions or permits (Cases 1-2).
    .
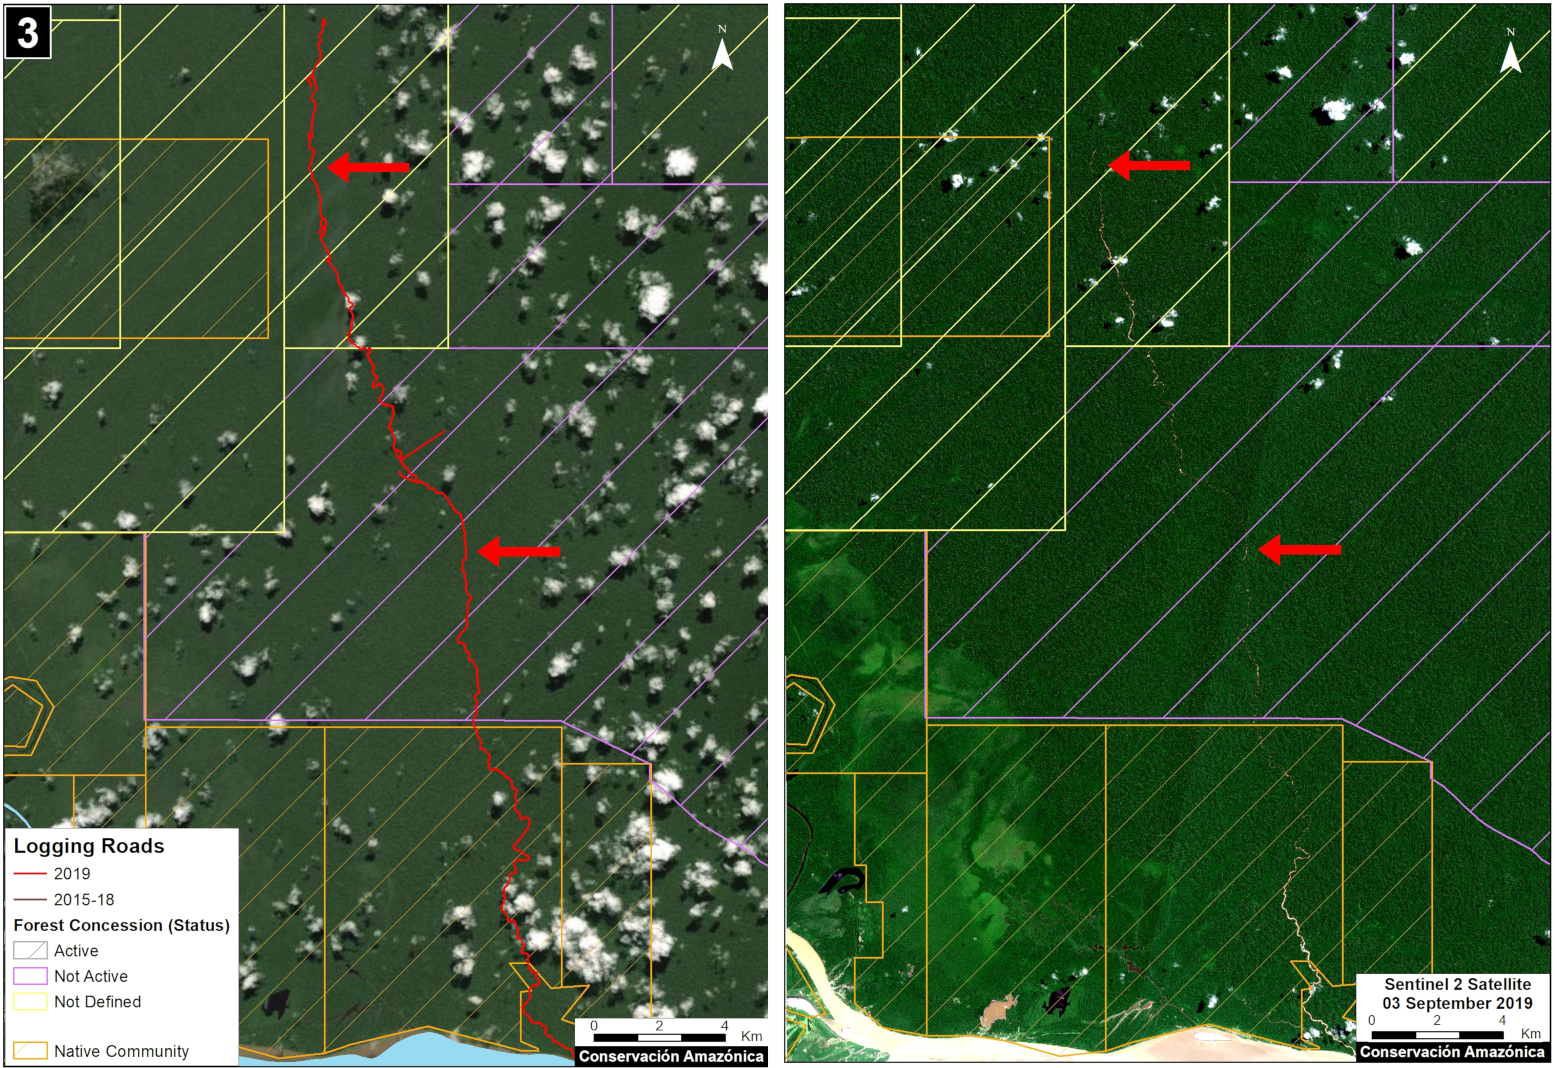
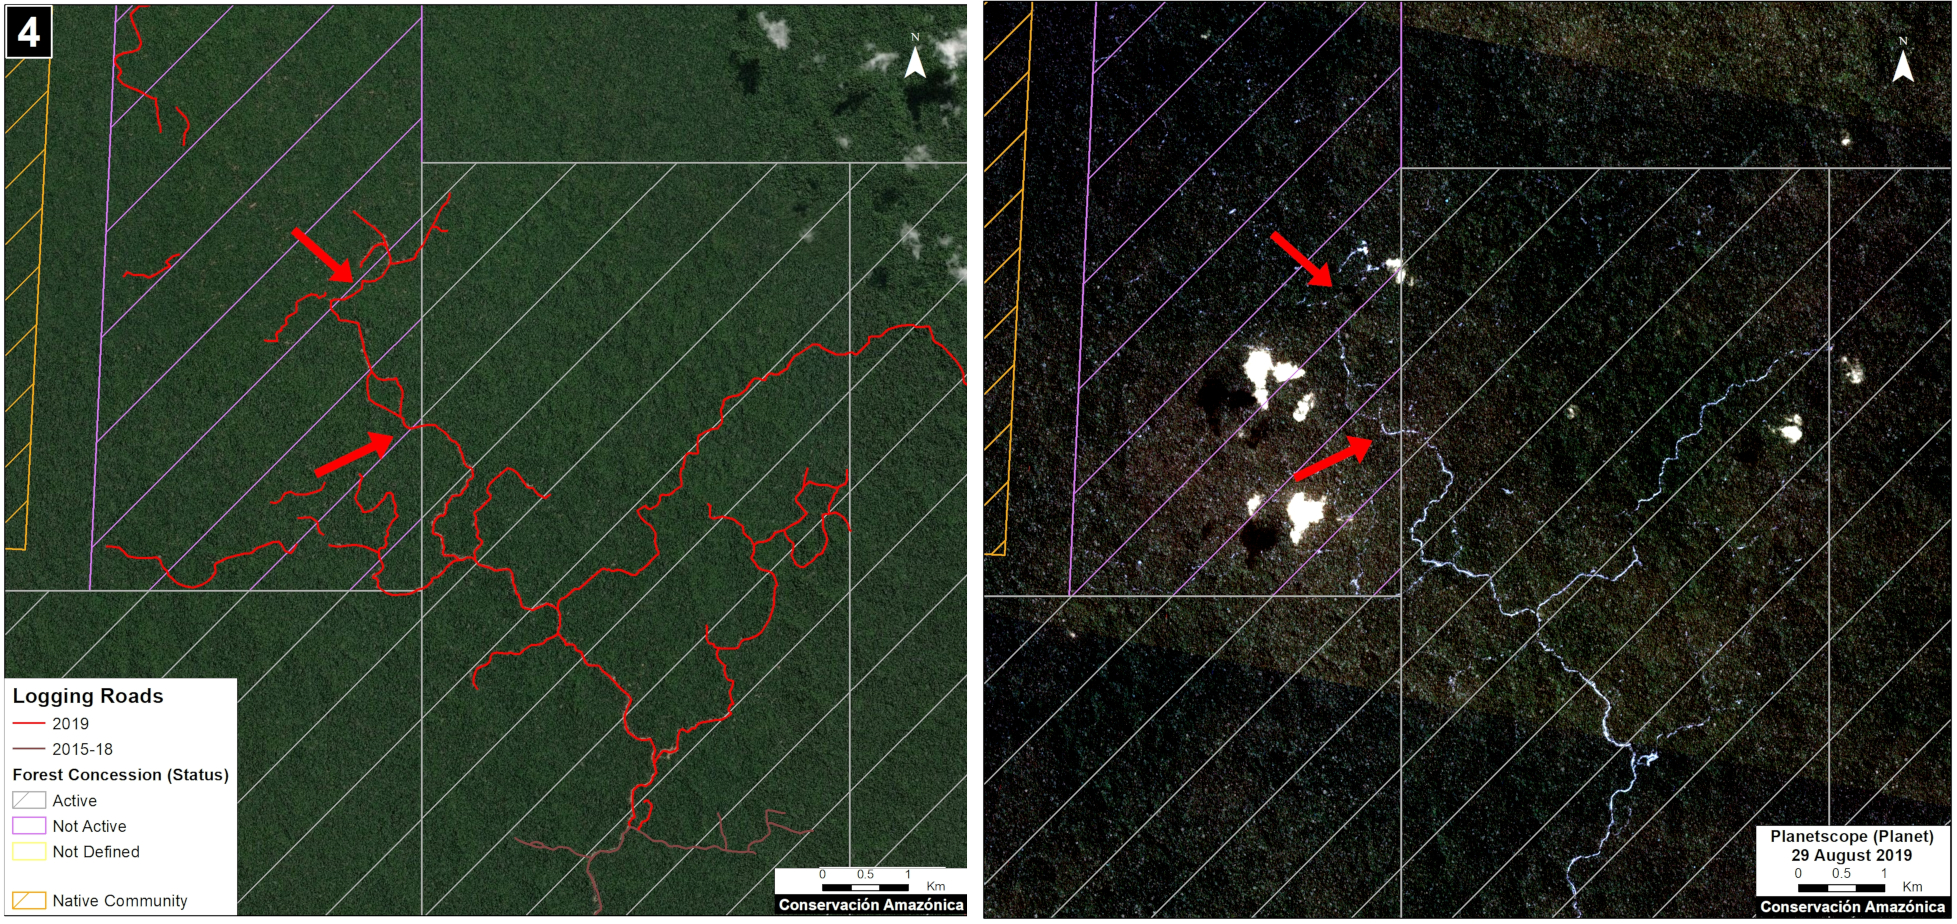
  • Logging roads in existing forest concessions, but whose current status is defined as “Non-Active or Undefined” (Cases 3-5).
    .
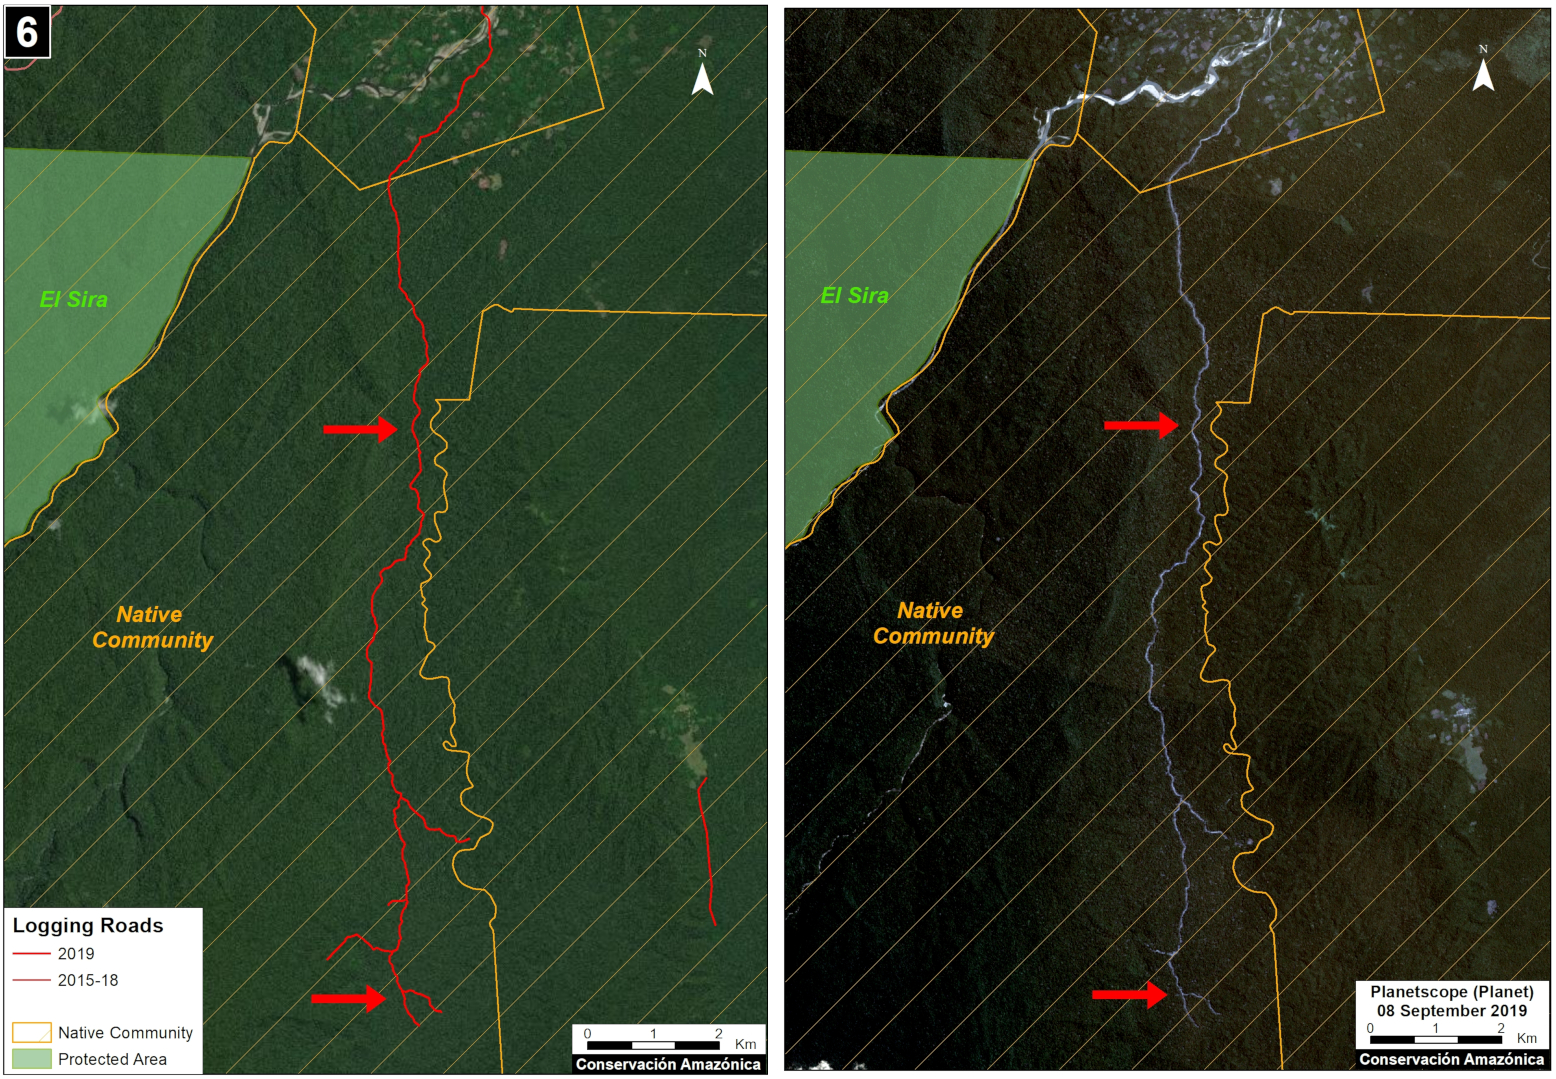
  • Logging roads in Native Communities (Case 6).

Cases of Possible Illegality

Logging roads in areas without forestry concessions or permits

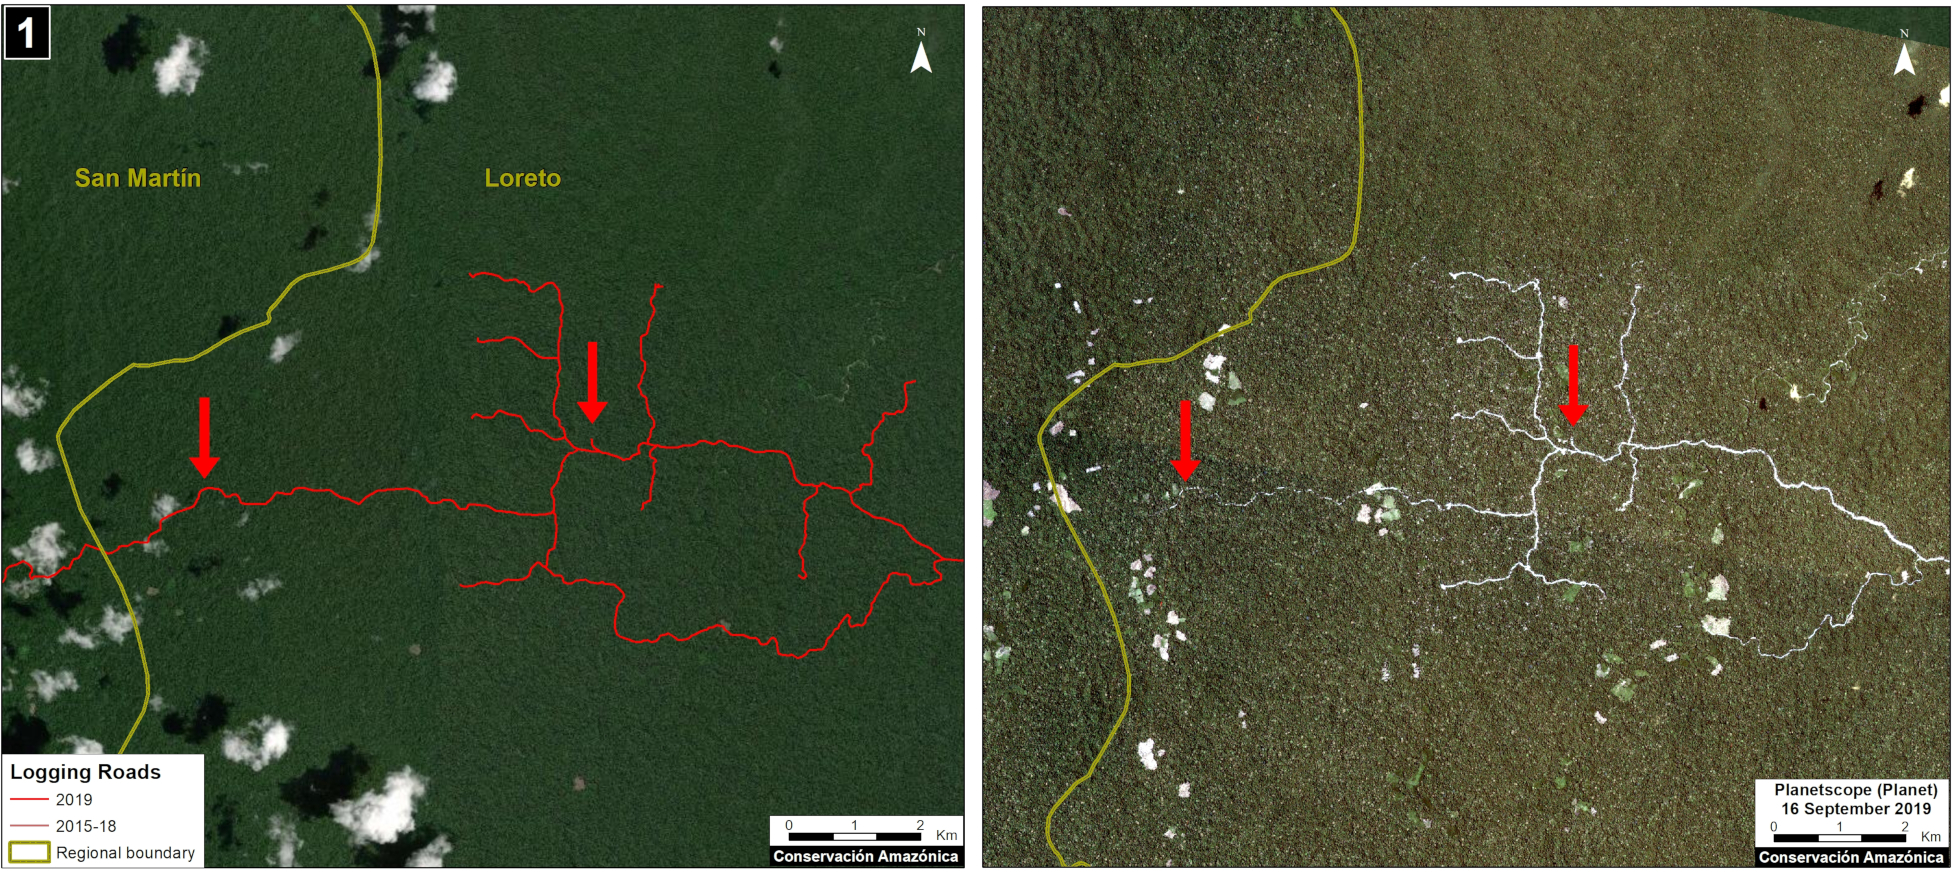
Case 1. We detected the opening of a new logging road network (55 km) in an area without forestry concessions or permits, between the limits of the Loreto and San Martín regions. The image shows the digitized logging roads (red, left panel), and non-digitized satellite image (right panel). The arrows provide reference points between panels.

Case 1. Data: MAAP, Planet. Click to enlarge.

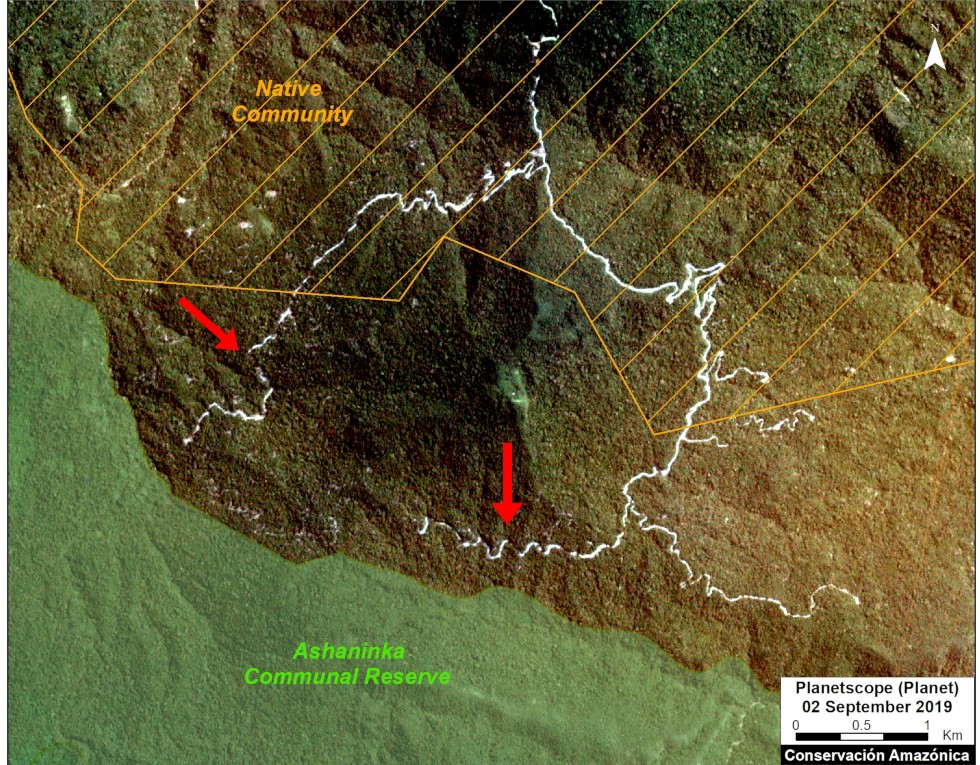
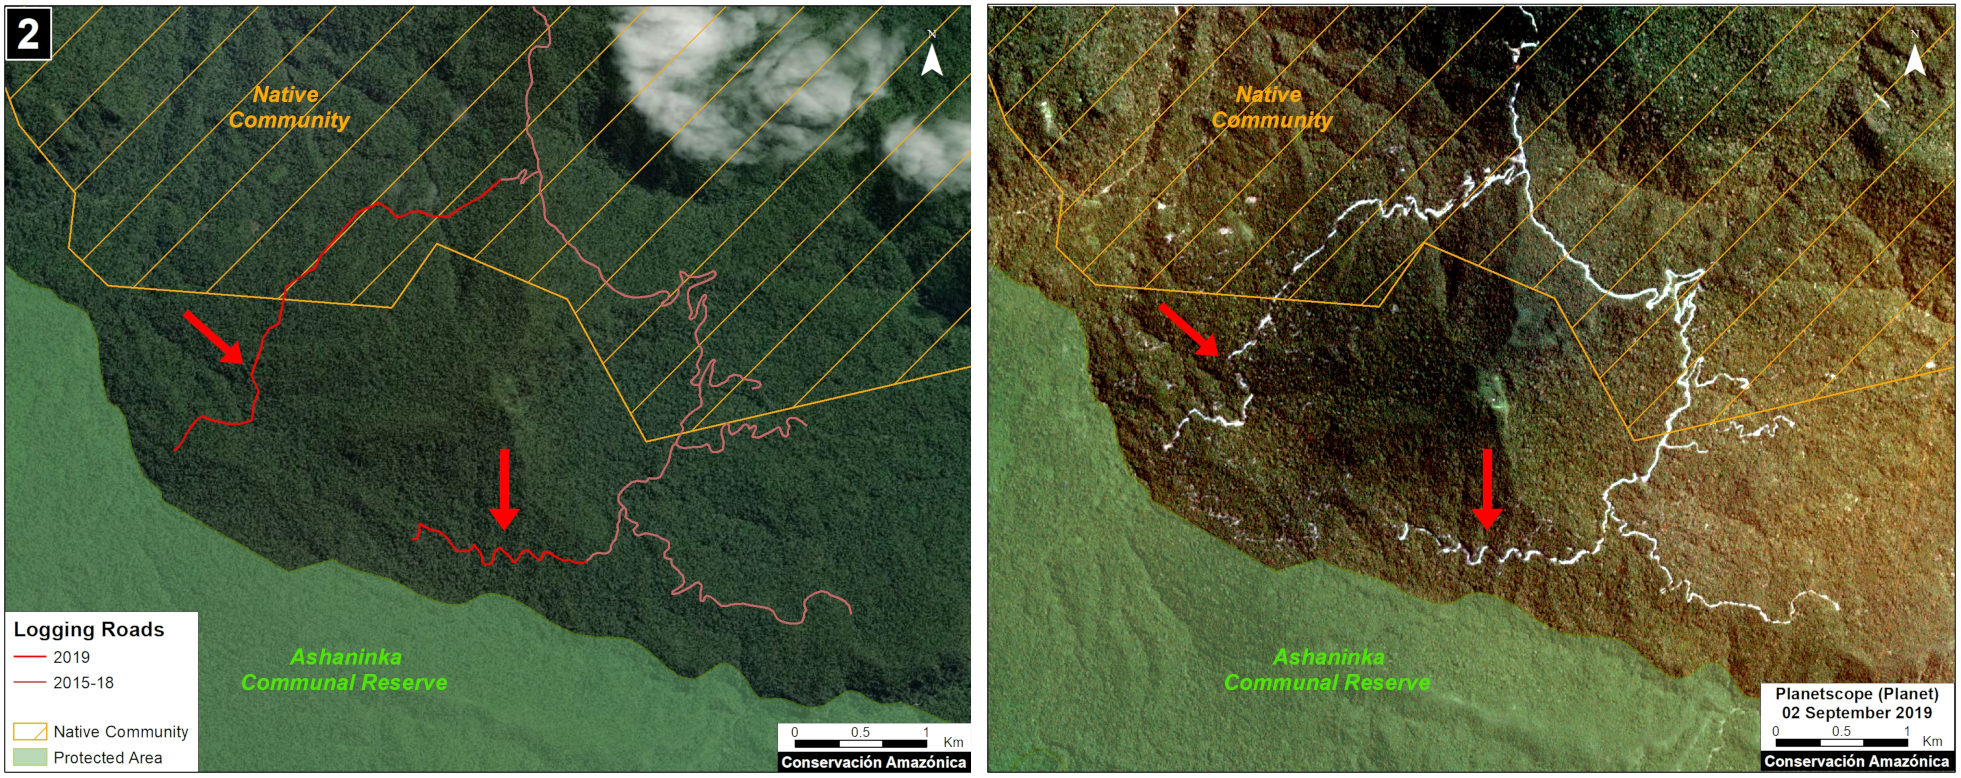
Case 2. We detected the construction of a new logging road network (5.8 km) in the buffer zone of Asháninka Communal Reserve, reaching only 300 meters from the protected area. The image shows the digitized logging roads (red, left panel), and non-digitized satellite image (right panel). The arrows provide reference points between panels.

Case 2. Data: MAAP, Planet, IBC, SERNANP. Click to enlarge.

Logging roads in existing forest concessions, but whose current state is labelled as “Non-Active or Undefined” 

Case 3. We detected the construction of a new logging road (45.3 km) that crosses a native community and reaches a forest concession whose status is defined as “Undefined,” in the Loreto region just north of Pacaya Samiria National Reserve. The image shows the digitized logging roads (red, left panel), and non-digitized satellite image (right panel). The arrows provide reference points between panels.

Case 3. Data: MAAP, ESA, IBC, SERFOR. Click to enlarge.

Case 4. We detected the construction of a new logging road network (53.2 km), of which nearly half (21.4 km) crosses a forest concession whose status is defined is “Non Active”, near the town of Sepahua in the Ucayali region. The image shows the digitized logging roads (red, left panel), and non-digitized satellite image (right panel). The arrows provide reference points between panels.

Case 4. Data: MAAP, Planet, IBC, SERFOR. Click to enlarge.

Case 5. We detected the construction of a new logging road (17.7 km) in a forestry concession whose current status is defined as “Non Active,” in the Madre de Dios region. The image shows the digitized logging roads (red, left panel), and non-digitized satellite image (right panel). The arrows provide reference points between panels.

Case 5. Data: MAAP, ESA, IBC, SERFOR. Click to enlarge.

Logging roads in Native Communities

Case 6. We detected the construction of a logging road (23.4 km) within an indigenous community in the Ucayali region. We did not find evidence of a permit for this activity. The image shows the digitized logging roads (red, left panel), and non-digitized satellite image (right panel). The arrows provide reference points between panels.

Case 6. Data: MAAP, Planet, SERNANP, IBC, SERFOR. Click to enlarge.

Methodology

Our analysis included two main steps:

The first step consisted of evaluating linear patterns in the 2019 early warning and final forest loss data, available from Global Forest Watch (data from the University of Maryland) and Geobosques (data from the Peruvian Ministry of the Environment). From the linear patterns, we distinguished between logging access roads and other types of roads and highways. Logging roads tend to have linear patterns that branch into the interior of the forest where the commercial timber is found. Other types of roads have a more defined destination, such as towns or farms. Once logging roads were identified, we downloaded the associated high-resolution imagery (3 meters) from Planet Explorer and digitized the roads in ArcGIS. During this process, additional logging roads detected in the high resolution images were also digitized.

The second step focused on the legality analysis. The new logging road data were overlaid with other types of land use information, such as forestry concessions on the GeoSERFOR portal (SERFOR), permits and concessions on the SISFOR portal (OSINFOR), indigenous communities (IBC 2019), protected areas (SERNANP), population centers (INEI 2019), and official road networks (MTC 2018). For example, as shown above, this process identified logging roads near protected areas, within indigenous communities, and within non-active forest concessions.

We analyzed information on several websites now available from national and regional authorities, such as SISFOR (OSINFOR), GEOSERFOR (SERFOR), and IDERs (Spatial Data Infrastructure of Regional governments). These new resources provide valuable information, however may have limitations in ability to constantly update information on the status of concessions and forest permits, especially from regional governments.

Annex – Logging road data per region

REGION, Logging Roads (Km)

LORETO, 231.2
MADRE DE DIOS, 477.8
UCAYALI, 720.0
HUANUCO, 45.5
JUNÍN, 19.8
PASCO, 15.1
SAN MARTIN, 2.4

TOTAL, 1511.7

References

Planet Team (2017). Planet Application Program Interface: In Space for Life on Earth. San Francisco, CA. https://api.planet.com

Acknowledgments

We thank R. Valle (OSINFOR), A. Felix (DAI), D. Suarez (ACCA), and G. Palacios for their helpful comments on this report.

This report was conducted with technical assistance from USAID, via the Prevent project. Prevent is an initiative that, over the next 5 years, will work with the Government of Peru, civil society, and the private sector to prevent and combat environmental crimes in Loreto, Ucayali and Madre de Dios, in order to conserve the Peruvian Amazon.

This publication is made possible with the support of the American people through USAID. Its content is the sole responsibility of the authors and does not necessarily reflect the views of USAID or the US government.

Citation

Finer M, Paz L, Novoa S, Villa L (2020) Detecting Illegal Logging in the Peruvian Amazon. MAAP: 123.

Amazon Fire Tracker 2020: Over 200 Major Fires as of Aug 10

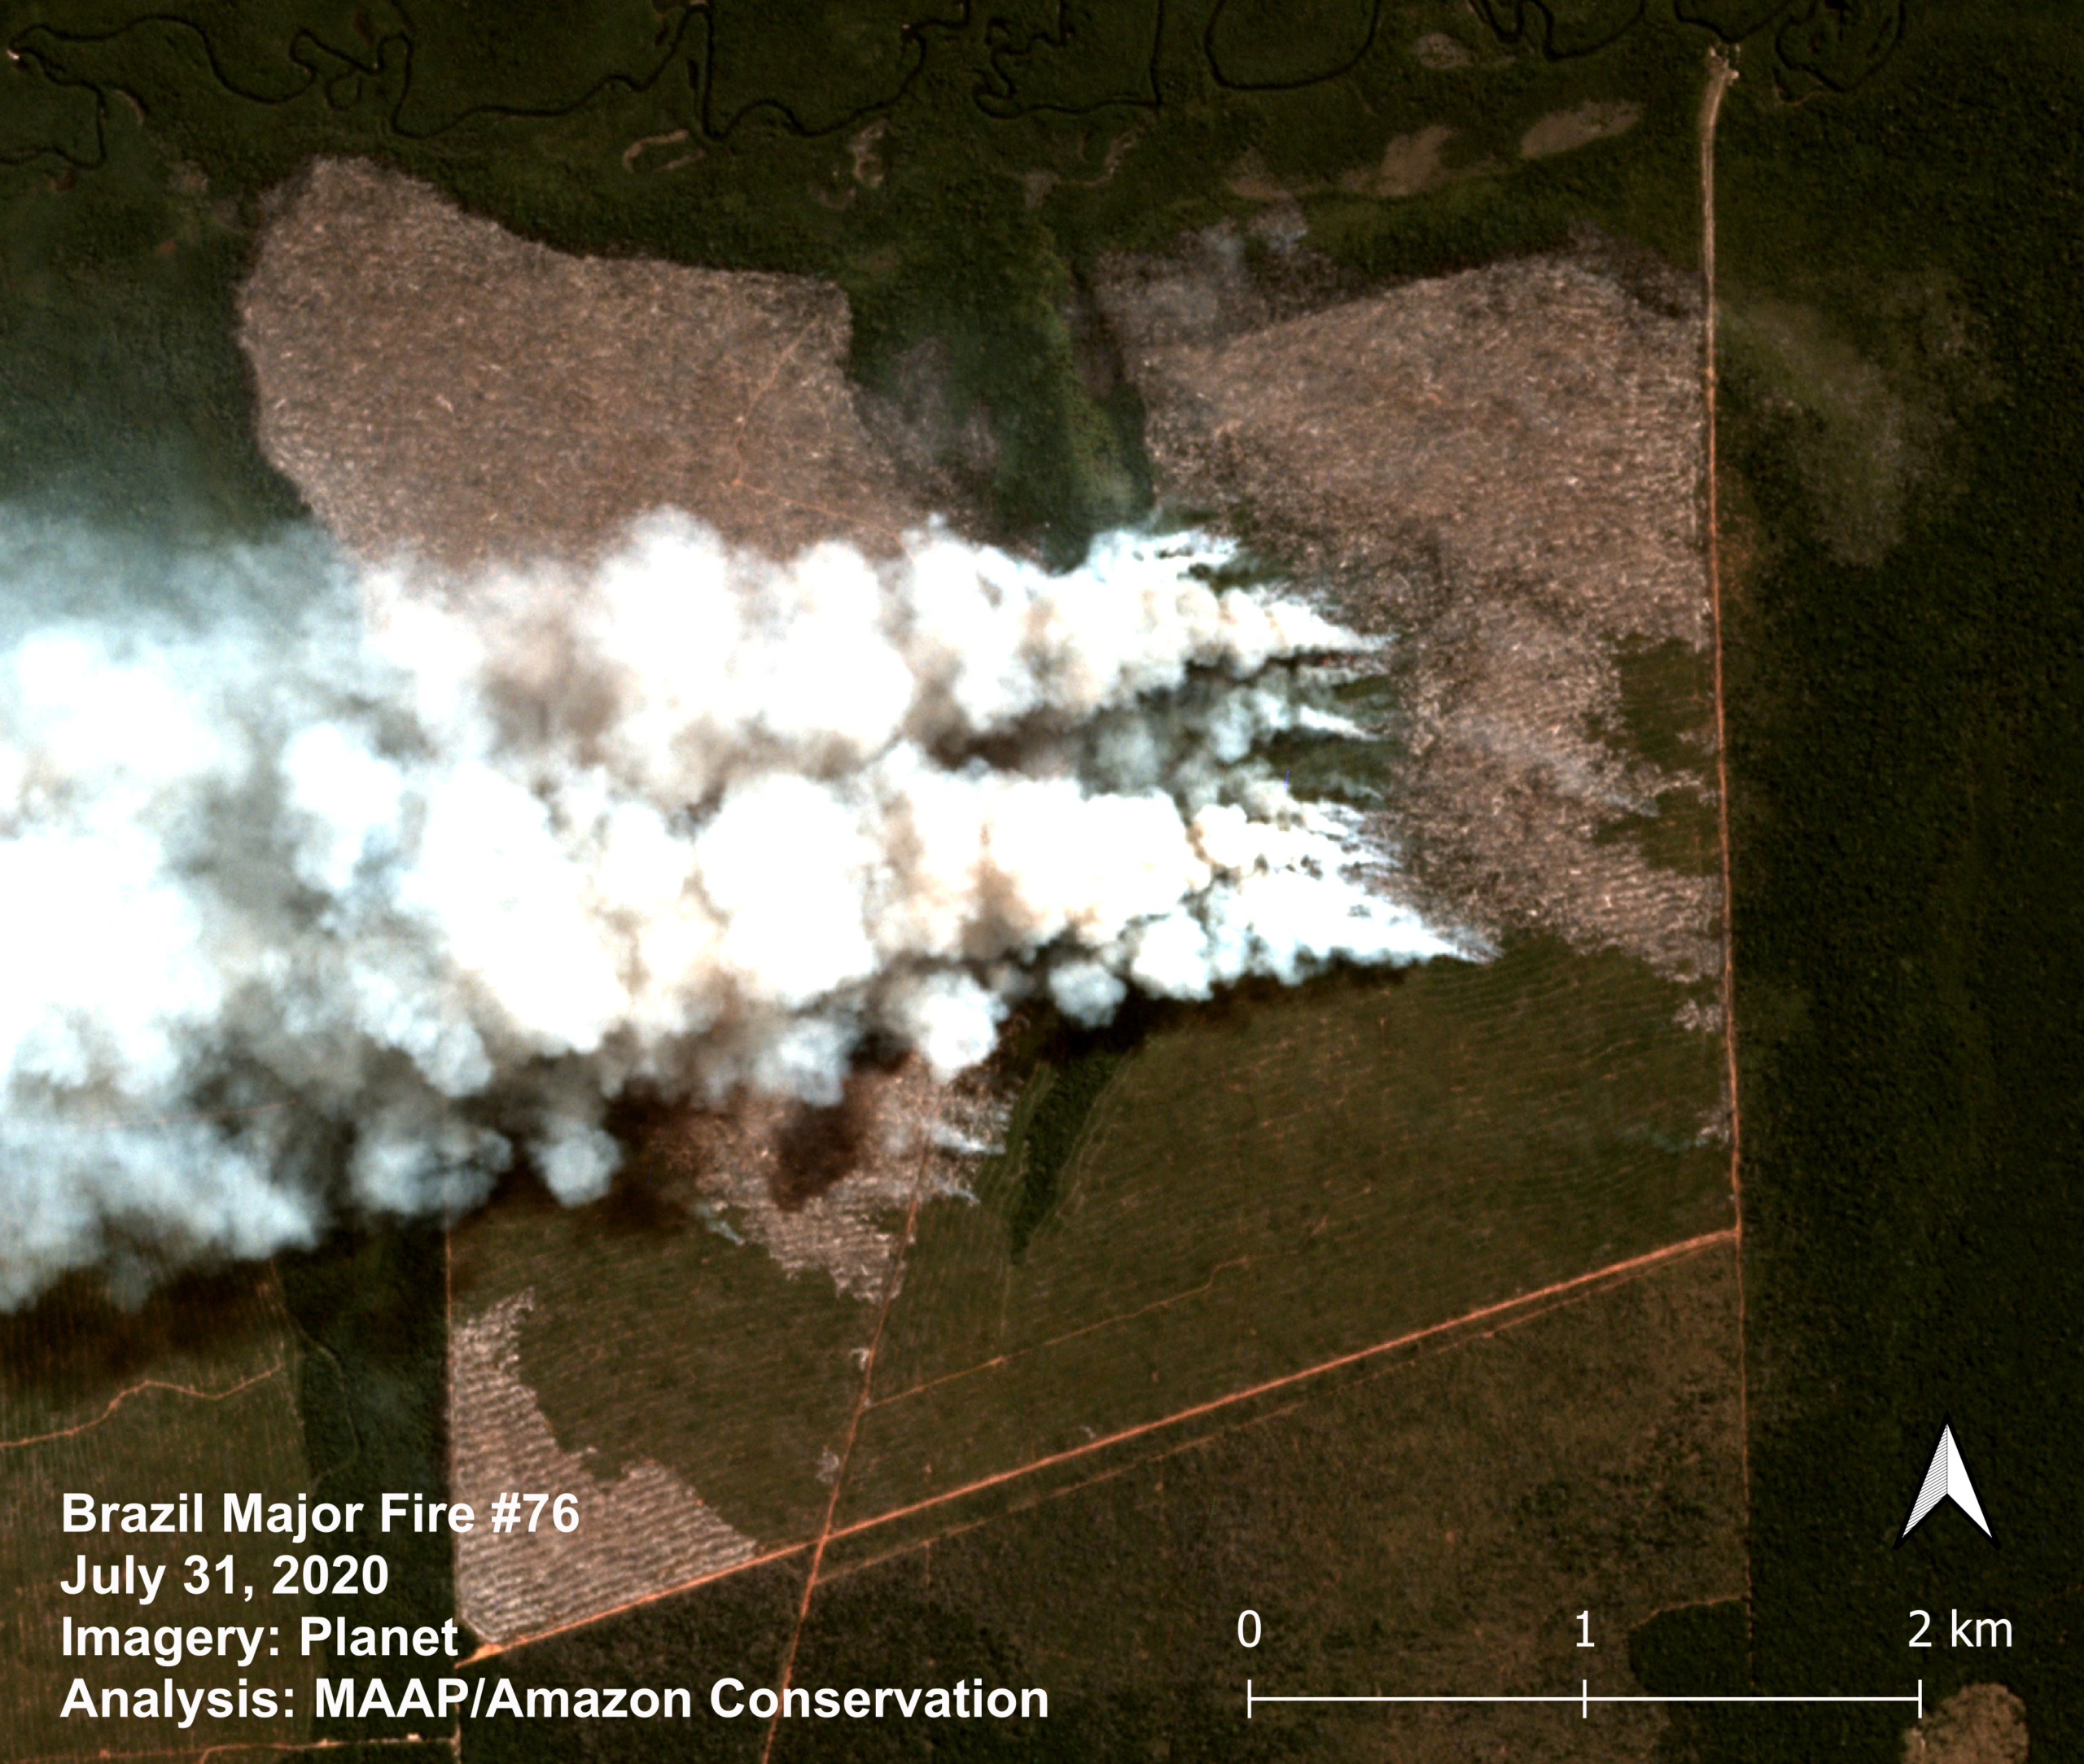
Brazilian Amazon Fire #76, July 2020. Imagery: Planet. Click to Enlarge.

Our innovative new app for Real-time Amazon Fire Monitoring has detected over 200 major fires in 2020.

The app specializes in filtering out thousands of the traditional heat-based fire alerts to prioritize only those burning large amounts of biomass (defined here as a major fire).*

Our key findings include:

  • We have detected 227 major Amazon fires (Brazil 220, Bolivia 6; Peru 1), as of August 10.
    ,
  • The vast majority of major fires have been in the Brazilian Amazon, where a strikingly high number (85%) have burned recently deforested areas. Thus, the fires are actually a smoking indicator of the rampant deforestation now in Brazil.
    k
  • In Brazil, we have detected two forest fires, but this risk increases as we get deeper into the dry season. The rest of the fires have been on older fields.
    l
  • In Brazil, the vast majority (94%) of the major fires have been illegal, in violation of the state and national fire moratoriums established in July. In fact, despite the moratoriums, the number of major fires is accelerating: 143 so far in August following 77 in May through July.
    m
  • In Brazil, 14 of the fires have been in Protected Areas.
    k
  • In the Bolivian and Peruvian Amazon, we have recently started detecting fires in the drier ecosystems (savannahs and grasslands).

See below for a more detailed breakdown of the results.

Additional Results

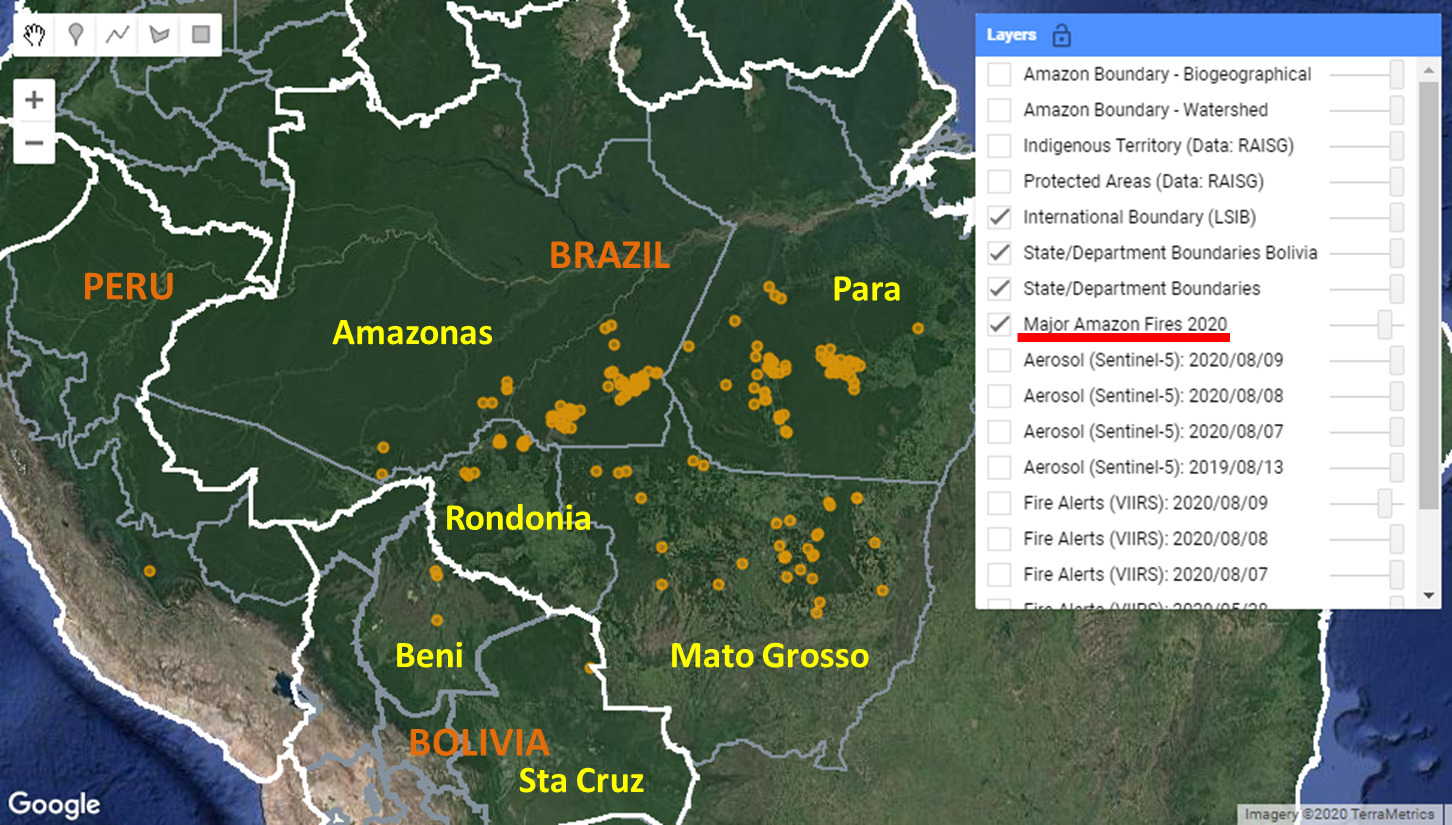
The Base Map is a screen shot of the app’s “Major Amazon Fires 2020” layer.

Base Map. Major Fires 2020. Data: MAAP.


The vast majority of the fires have been in the Brazilian Amazon: Pará (37%) and Amazonas (39%), followed by Mato Grosso (17%) and Rondônia (8%).

Importantly, the vast majority of the major fires in the Brazilian Amazon (85%) have burned recently deforested areas (cleared between 2018 and 2020) covering 280,000 acres (113,000 hectares). Thus, we argue that the central issue is actually deforestation and the fires are actually a smoking indicator of this forest loss.

We have detected the first two forest fires, burning 388 acres (1,447 hectares) in Mato Grosso and Para.

The rest of the major fires have been on older cattle or agricultural lands (deforested prior to 2018).

The most impacted protected areas are Jamanxim and Altamira National Forests in Pará. We emphasize, however, that these fires were burning recently deforested areas (not forest fires) and so, again, the primary issue is deforestation.

In Brazil, the vast majority of the major fires (94%) appear to be illegal as they violate the state and national government mandated fire moratoriums established in July. In fact, despite the moratoriums, the number of major fires is accelerating: 143 so far in August, following 64 in July, 12 in June, and the first one in May.

In the Bolivian Amazon, we have recently started detecting fires in the savannahs in the department of Beni. We also detected one fire in a recently deforested area in the Santa Cruz department.

In the Peruvian Amazon, we have recently started detecting fires in the upper elevation grasslands. The biggest one was actually within a protected area (Otishi National Park). There have also been smaller grassland fires near the buffer zone of upper Manu National Park.

Key Examples of 2020 Fires

Overall our key finding is that most major Brazilian Amazon fires are burning recently deforested areas, and not raging forest fires. Below is a series of satellite image time-lapse videos showing examples of recent deforestation followed by a major 2020 fire.

Brazilian Amazon Fire #54, July 2020


Brazilian Amazon Fire #59, July 2020


Brazilian Amazon Fire #76, July 2020


Brazilian Amazon Fire #110, August 2020

*Notes and Methodology

In a novel approach, the app combines data from the atmosphere (aerosol emissions in smoke) and the ground (heat anomaly alerts) to effectively detect and visualize major Amazon fires.

When fires burn, they emit gases and aerosols. A new satellite (Sentinel-5P from the European Space Agency) detects these aerosol emissions. Thus, the major feature of the app is detecting elevated aerosol emissions which in turn indicate the burning of large amounts of biomass. For example, the app distinguishes small fires clearing old fields (and burning little biomass) from larger fires burning recently deforested areas or standing forest (and burning lots of biomass).

We define “major fire” as one showing elevated aerosol emission levels on the app, thus indicating the burning of elevated levels of biomass. This typically translates to an aerosol index of >1 (or cyan-green to red on the app). To identify the exact source of the elevated emissions, we reduce the intensity of aerosol data in order to see the underlying terrestrial heat-based fire alerts. Typically for major fires, there is a large cluster of alerts. The major fires are then confirmed, and burn areas estimated, using high-resolution satellite imagery from Planet Explorer.

See MAAP #118 for additional details.

No fires permitted in the Brazilian state of Mato Grosso after July 1, 2020. No fires permitted in all of Brazilian Amazon after July 15, 2020. Thus, we defined “illegal” as any major fires detected after these respective dates.

There was no available Sentinel-5 aerosol data on July 4, 15, and 26.

Acknowledgements

This analysis was done by Amazon Conservation in collaboration with SERVIR Amazonia.

Citation

Finer M, Nicolau A, Villa L (2020) 200 Major Amazon Fires in 2020: Tracker Analysis. MAAP.