MAAP #124: Deforestation Hotspots 2020 in the Peruvian Amazon

Base Map. 2020 Forest Loss Hotspots in the Peruvian Amazon. Data: UMD/GLAD, MAAP, SERNANP.

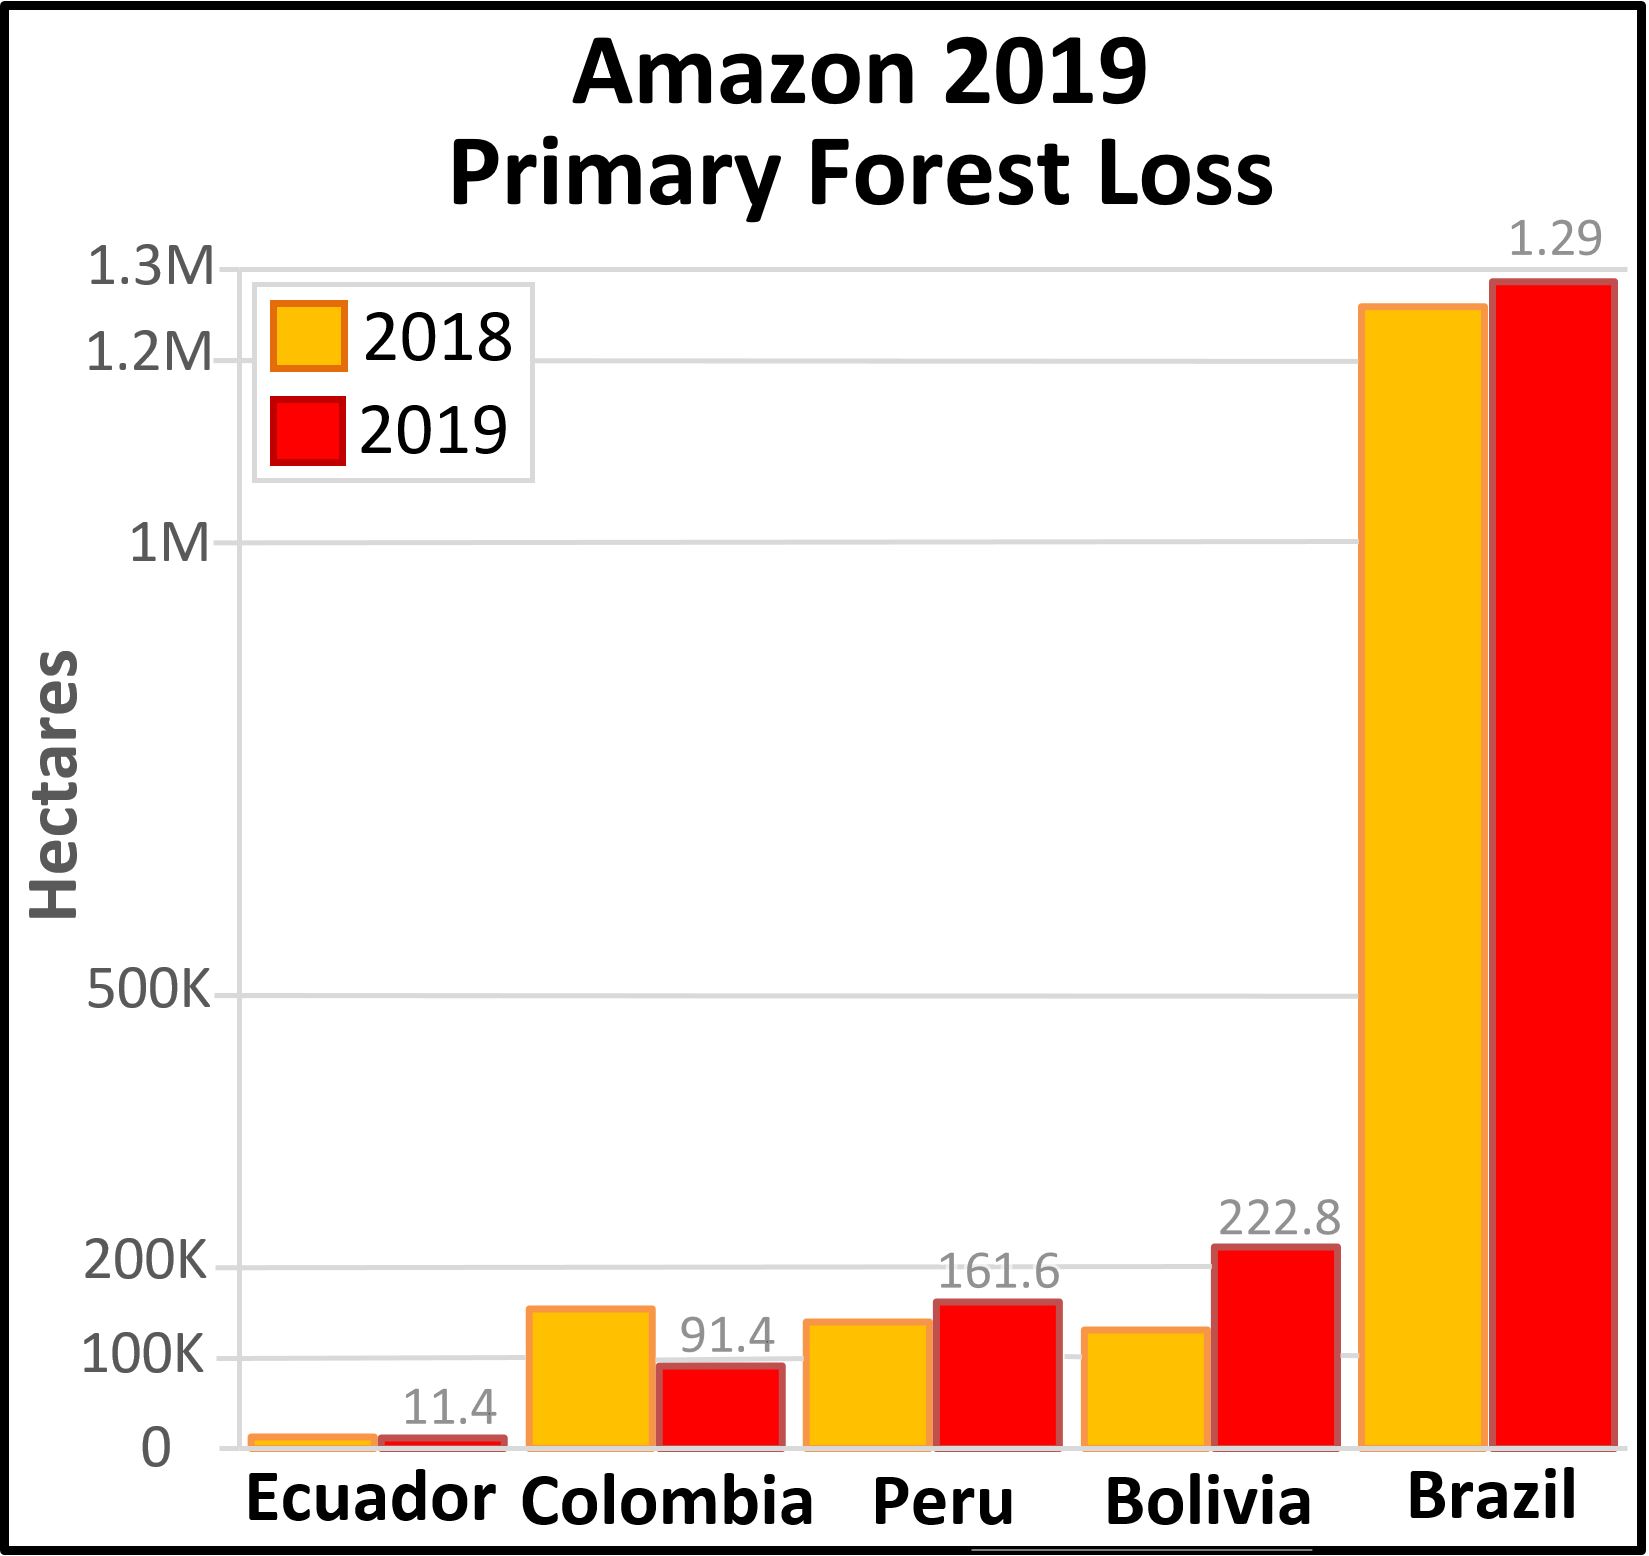
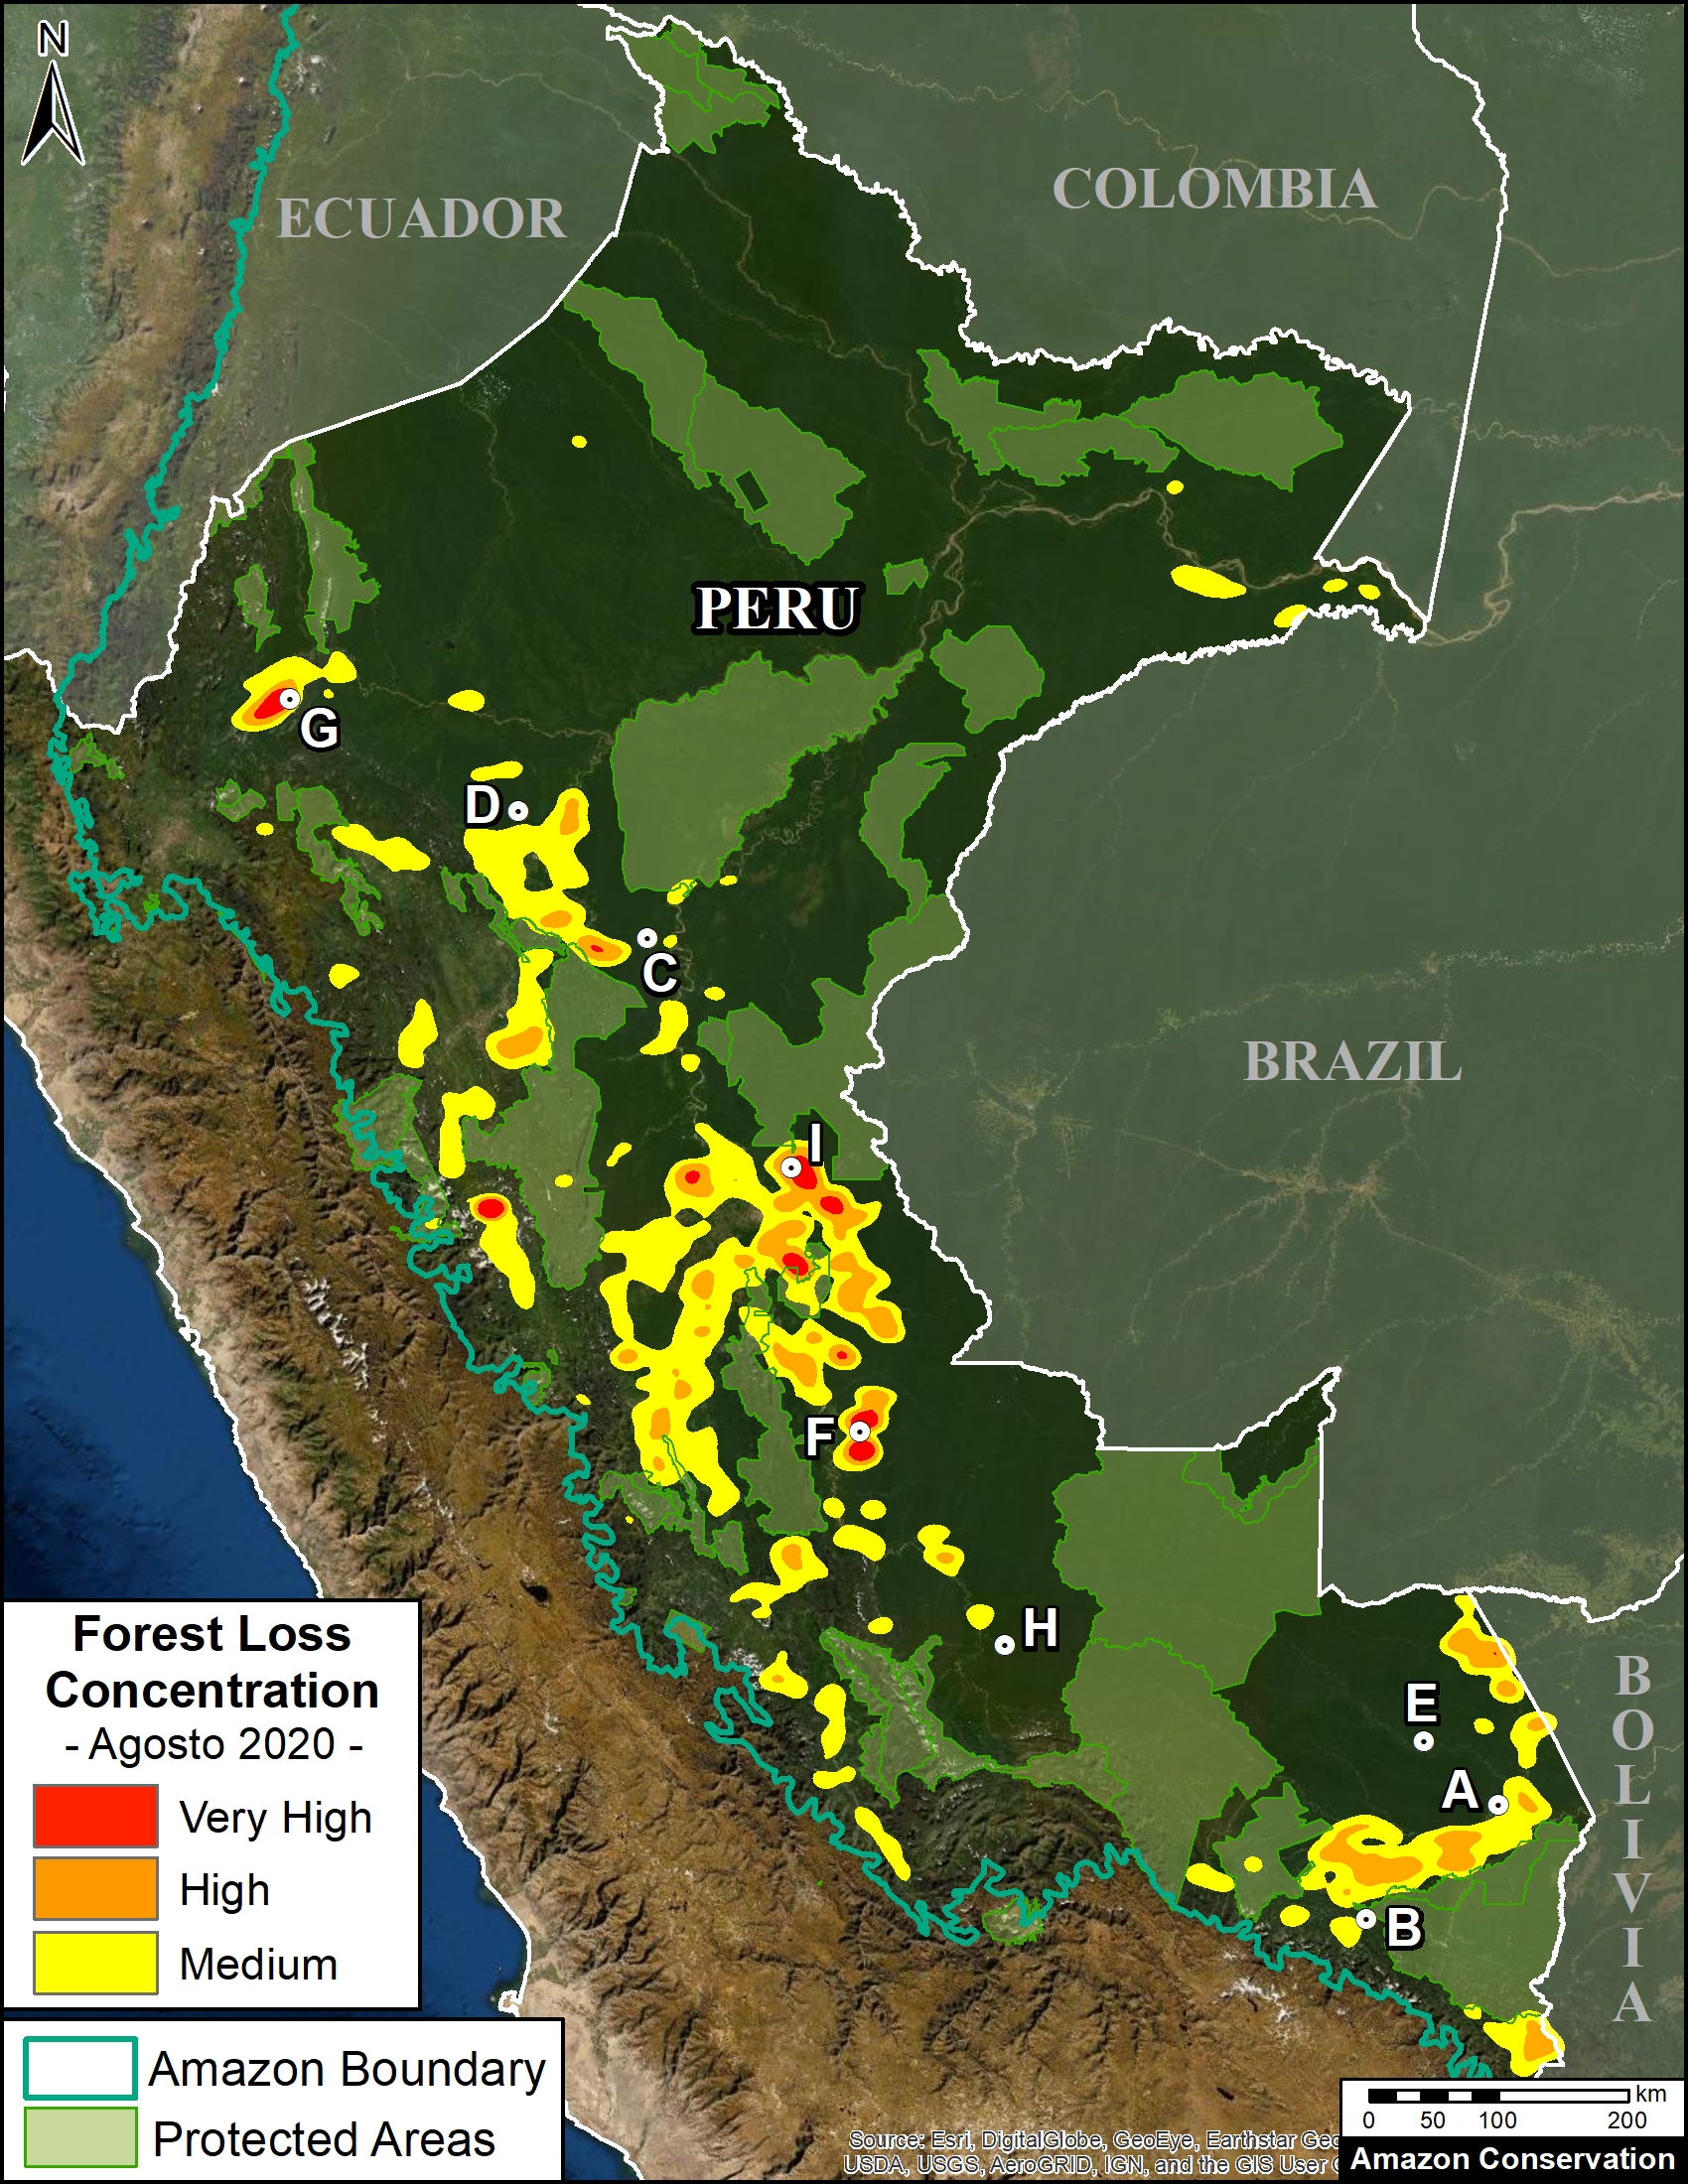
We have entered the peak deforestation season in the Peruvian Amazon, so it is also a critical time for real-time monitoring (MAAP’s specialty).

Here, we highlight the major deforestation events documented so far in 2020 (through August 23).

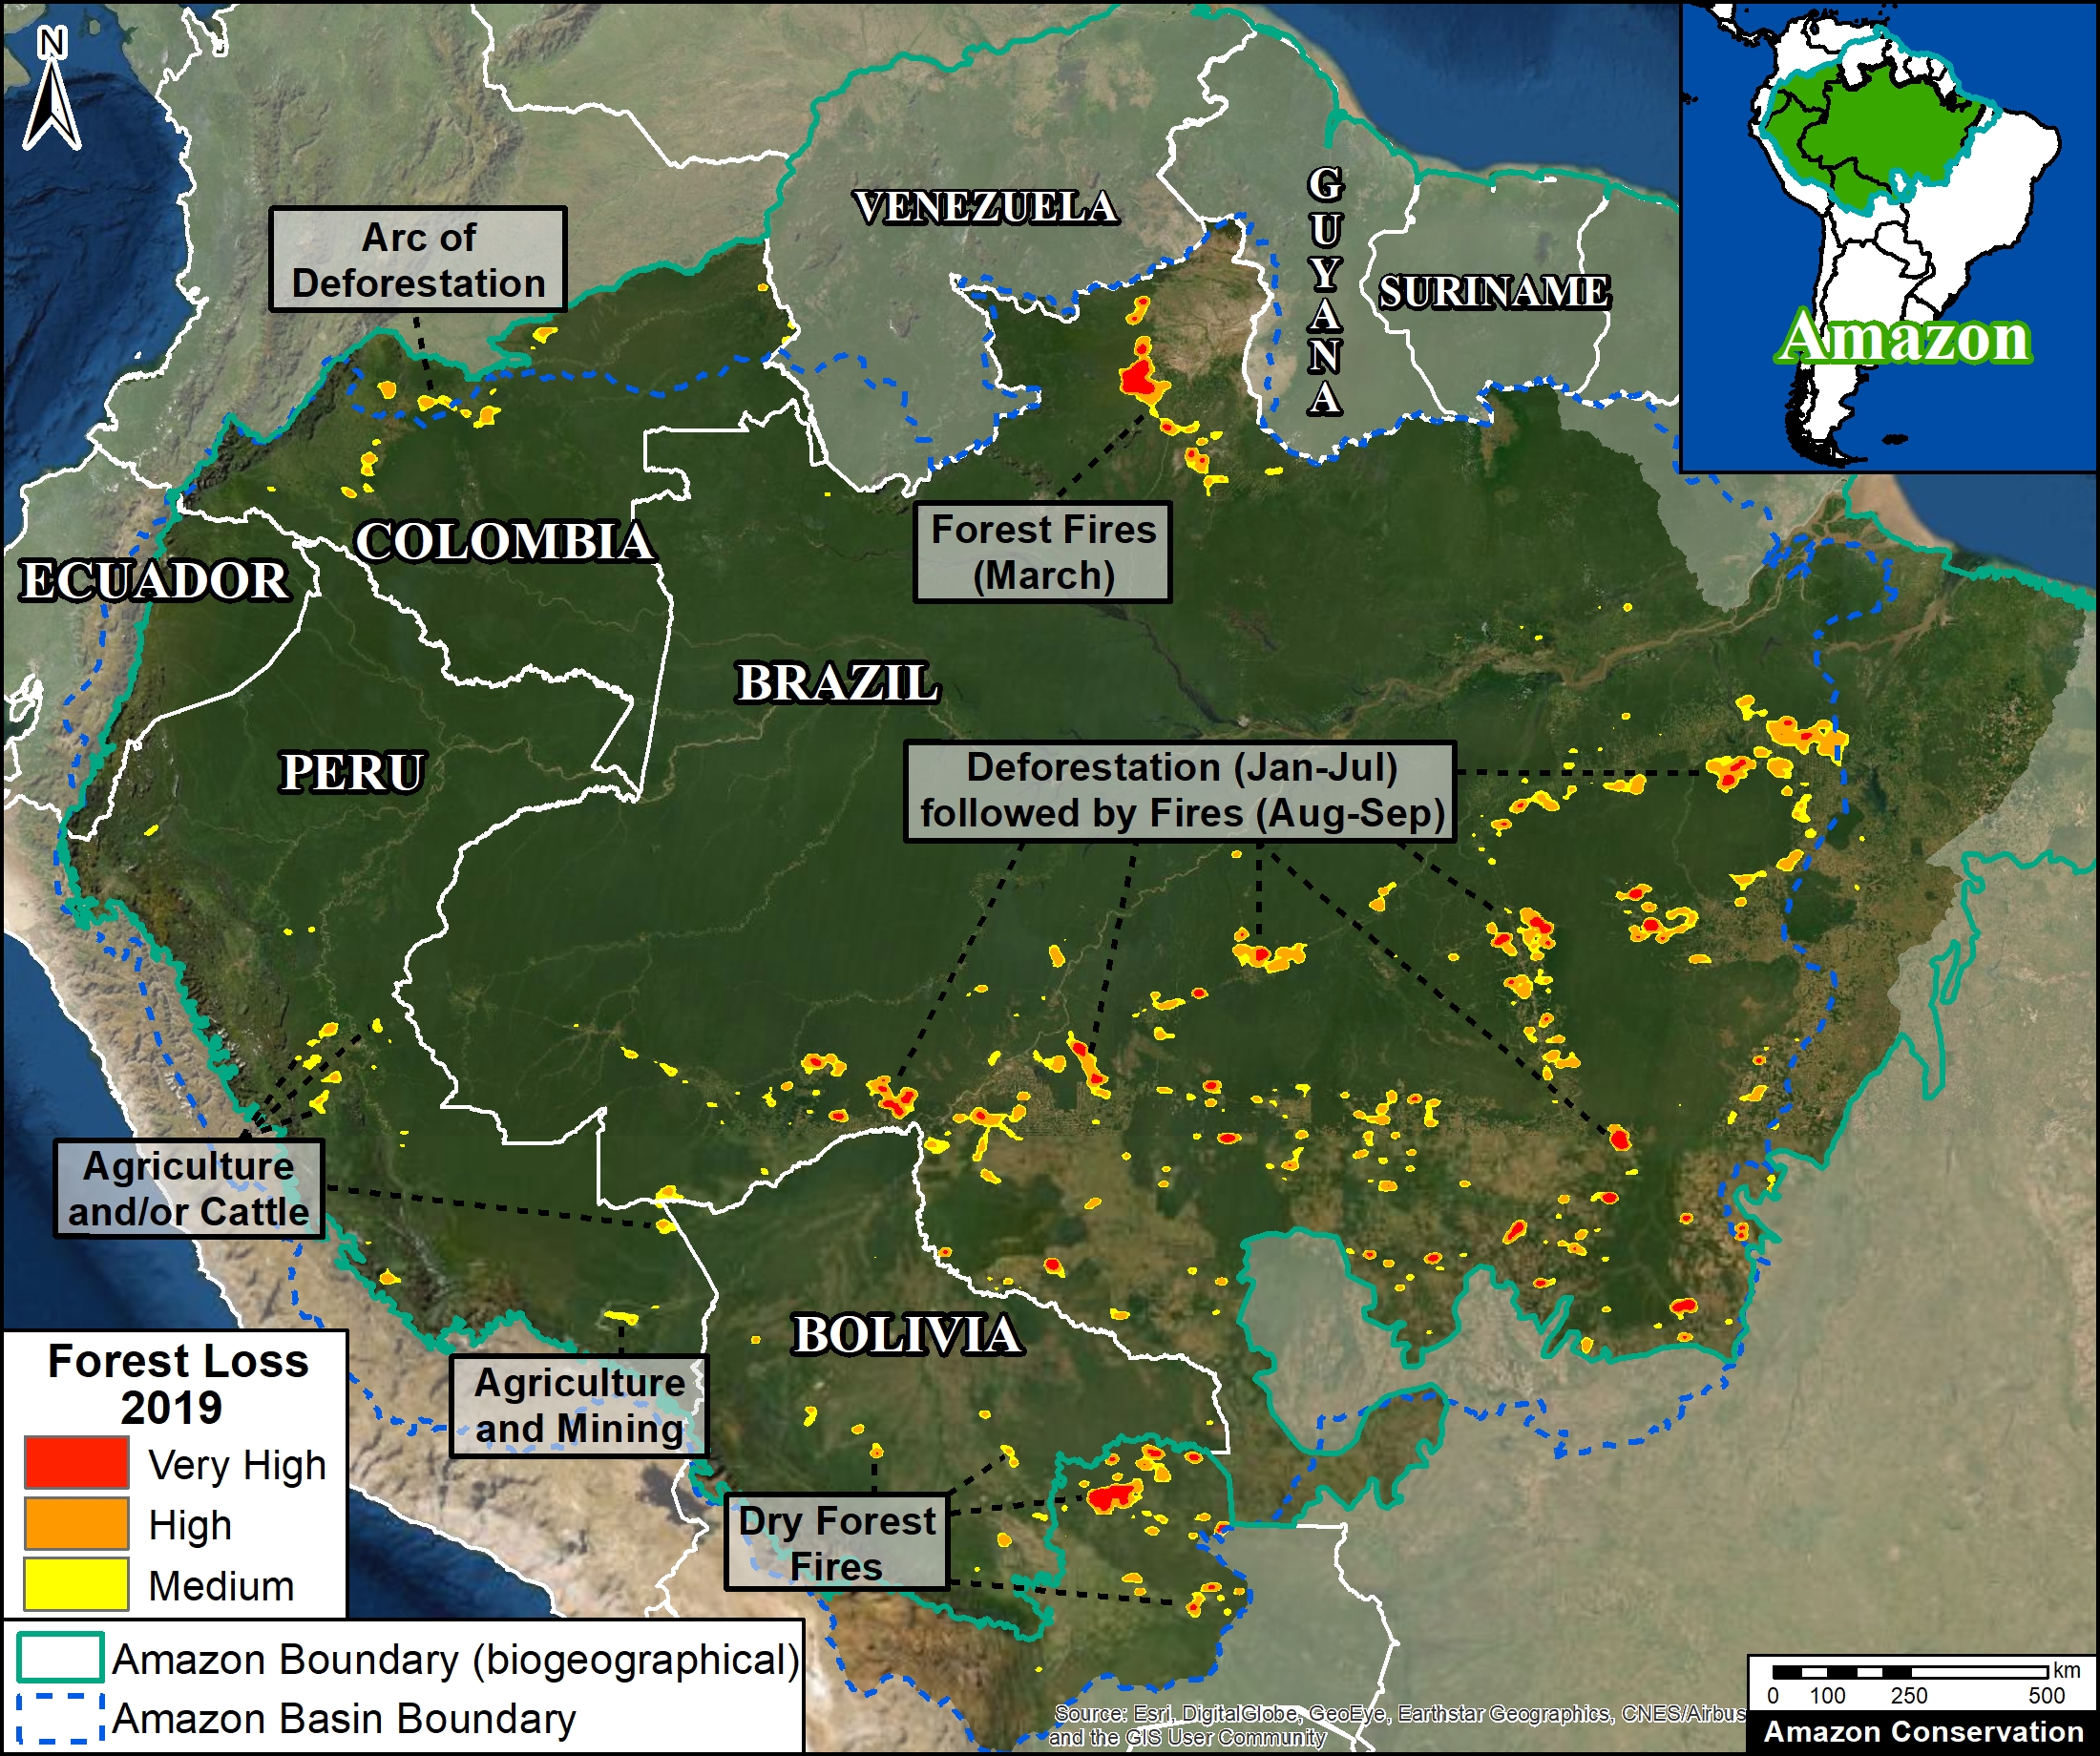
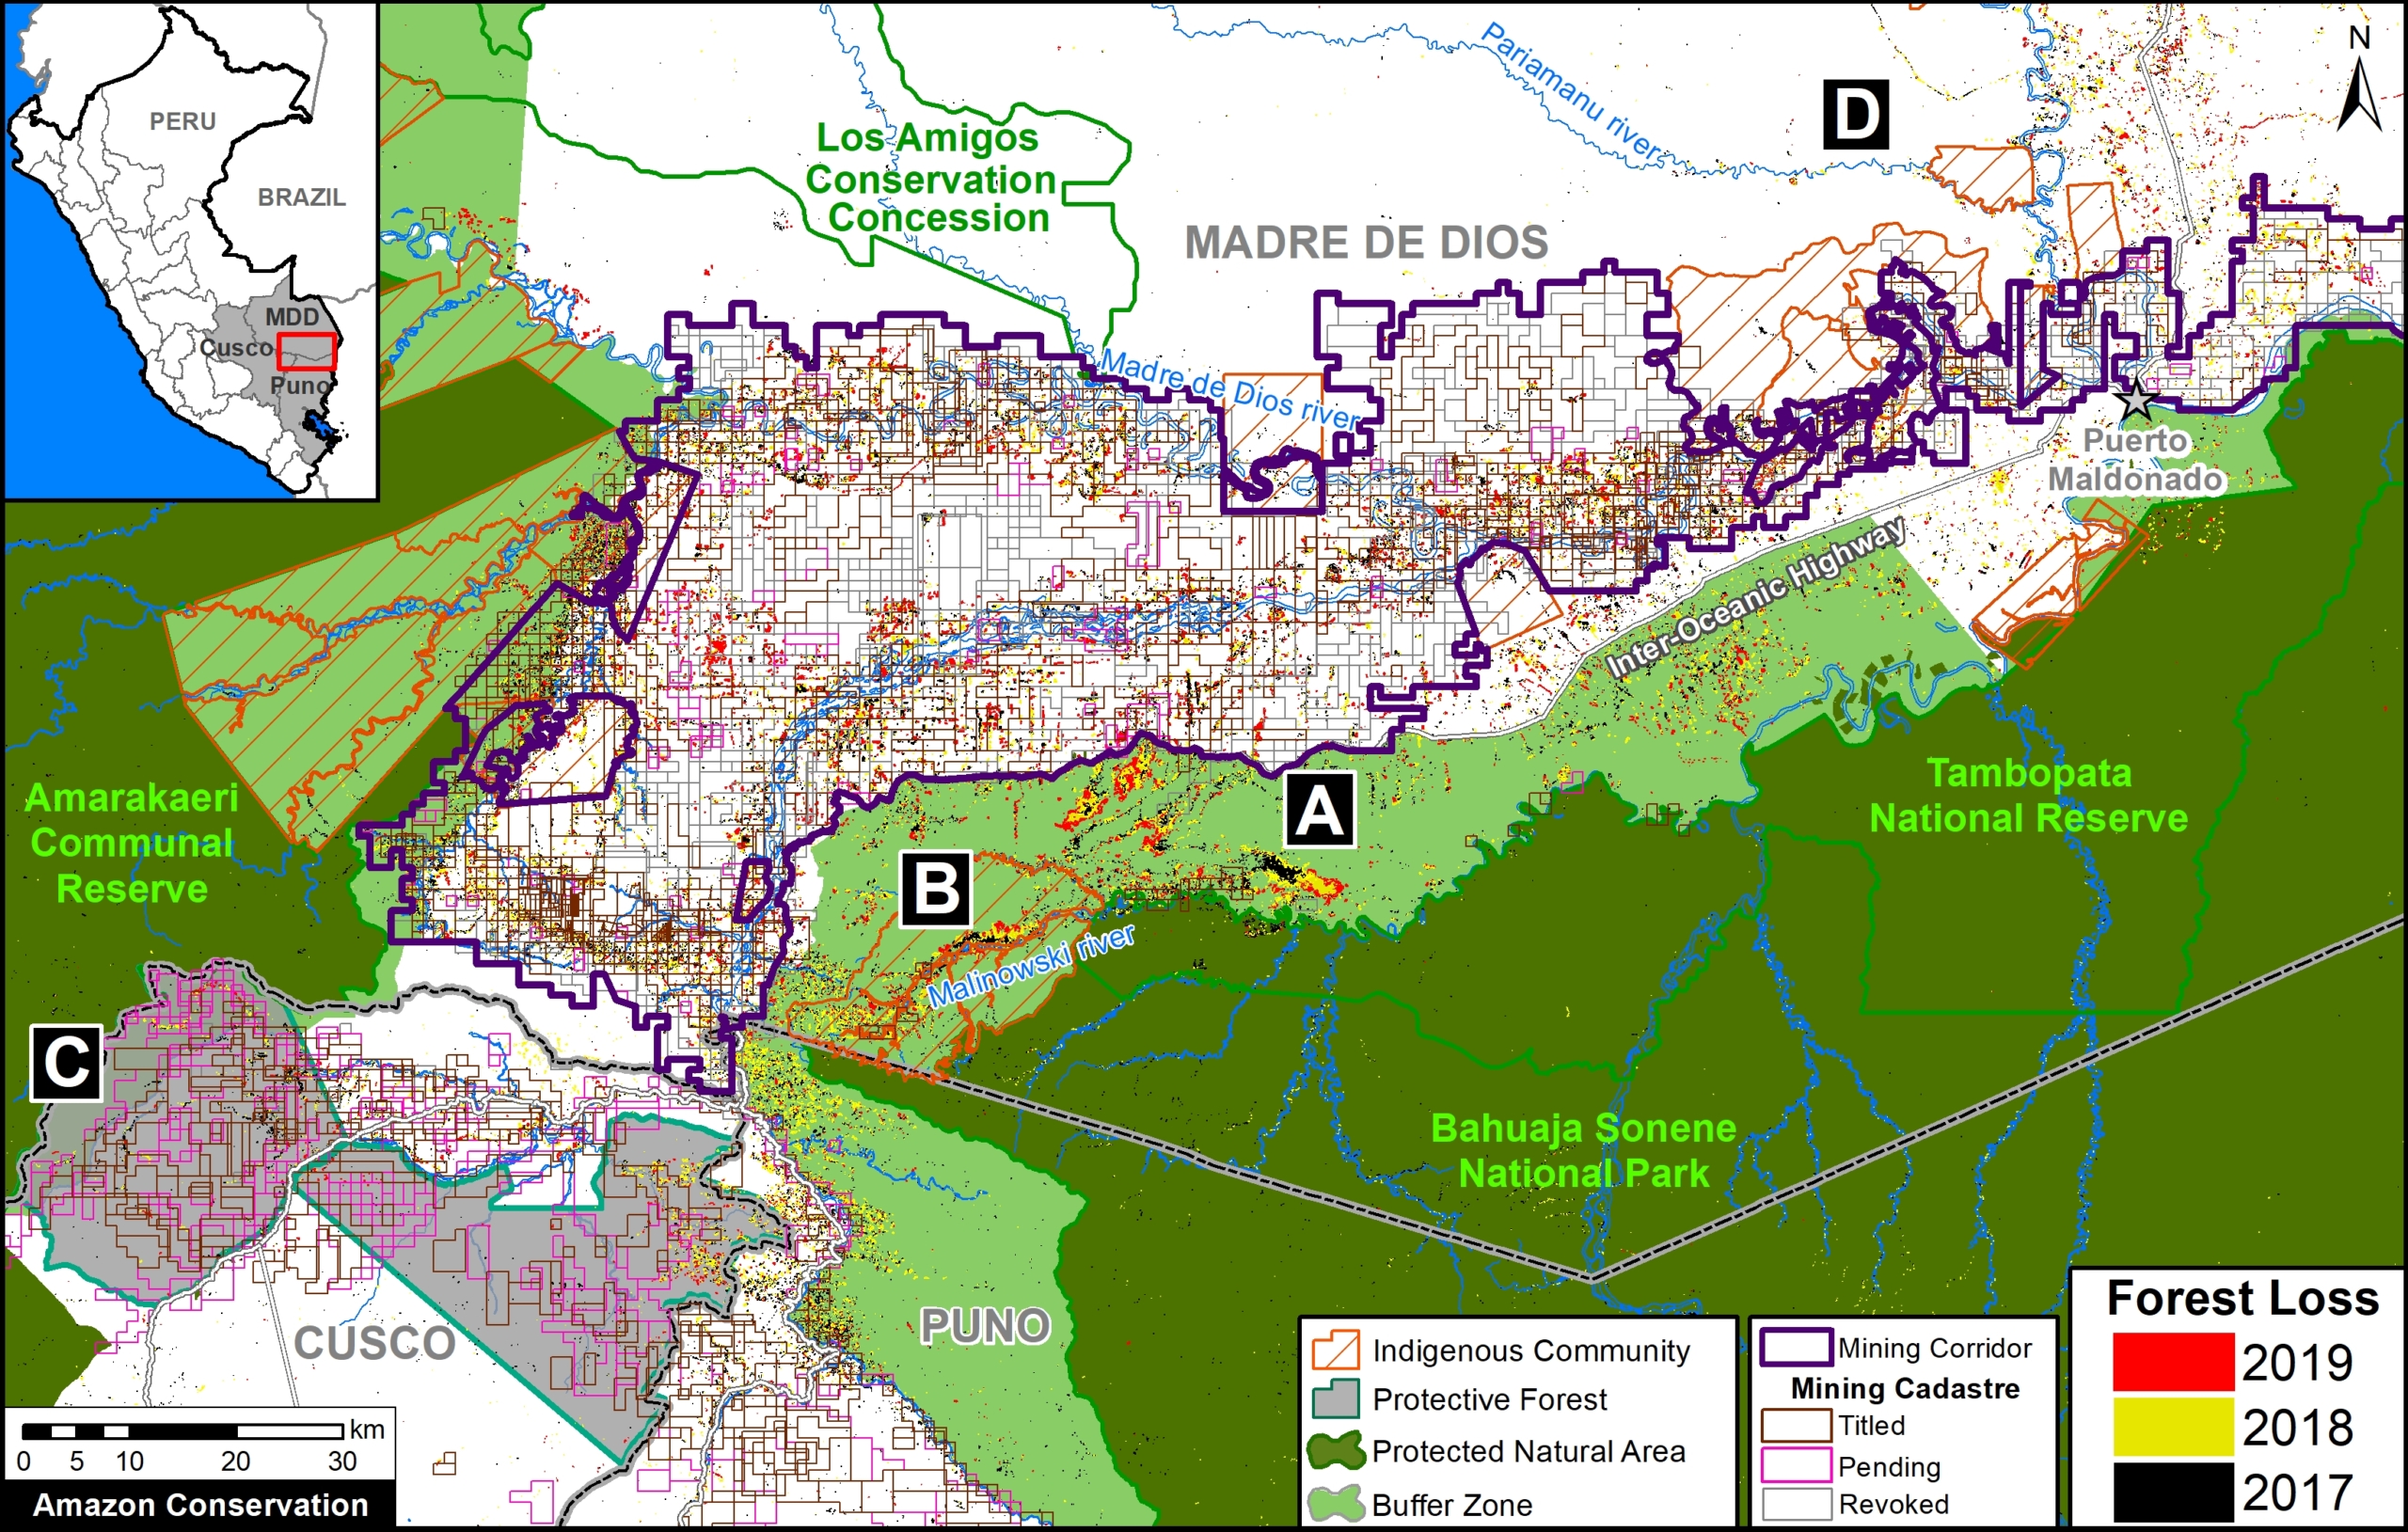
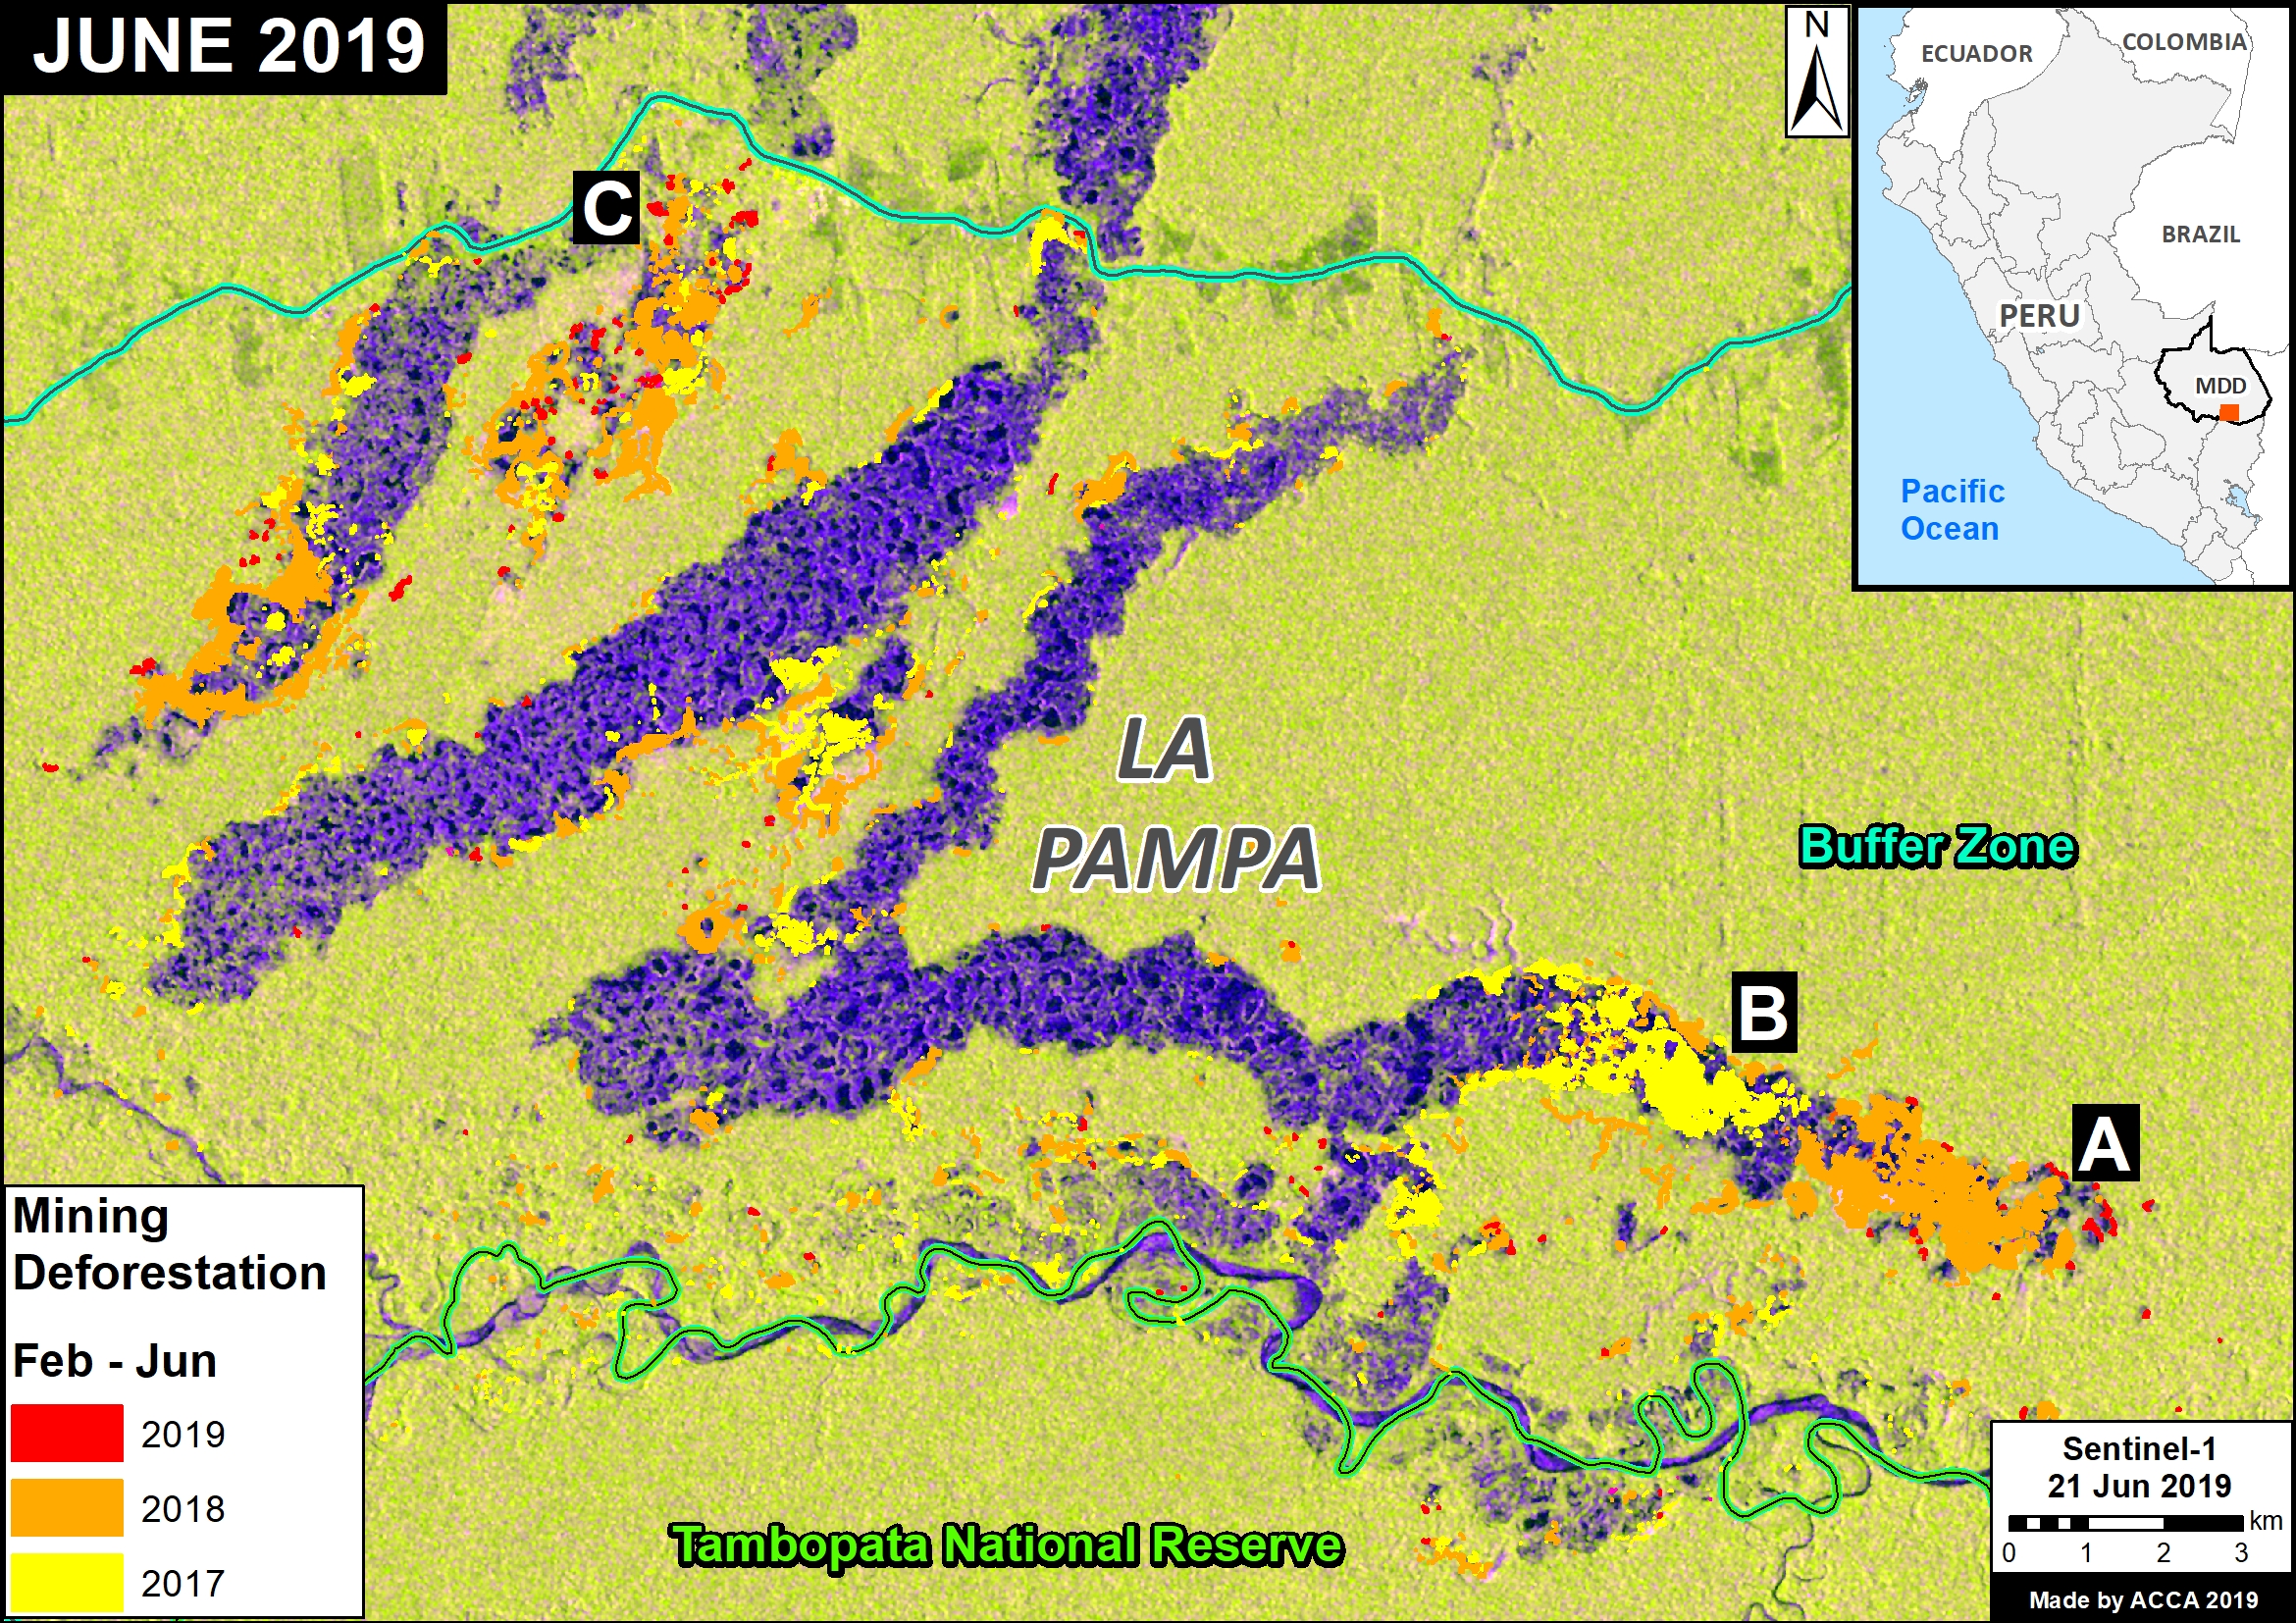
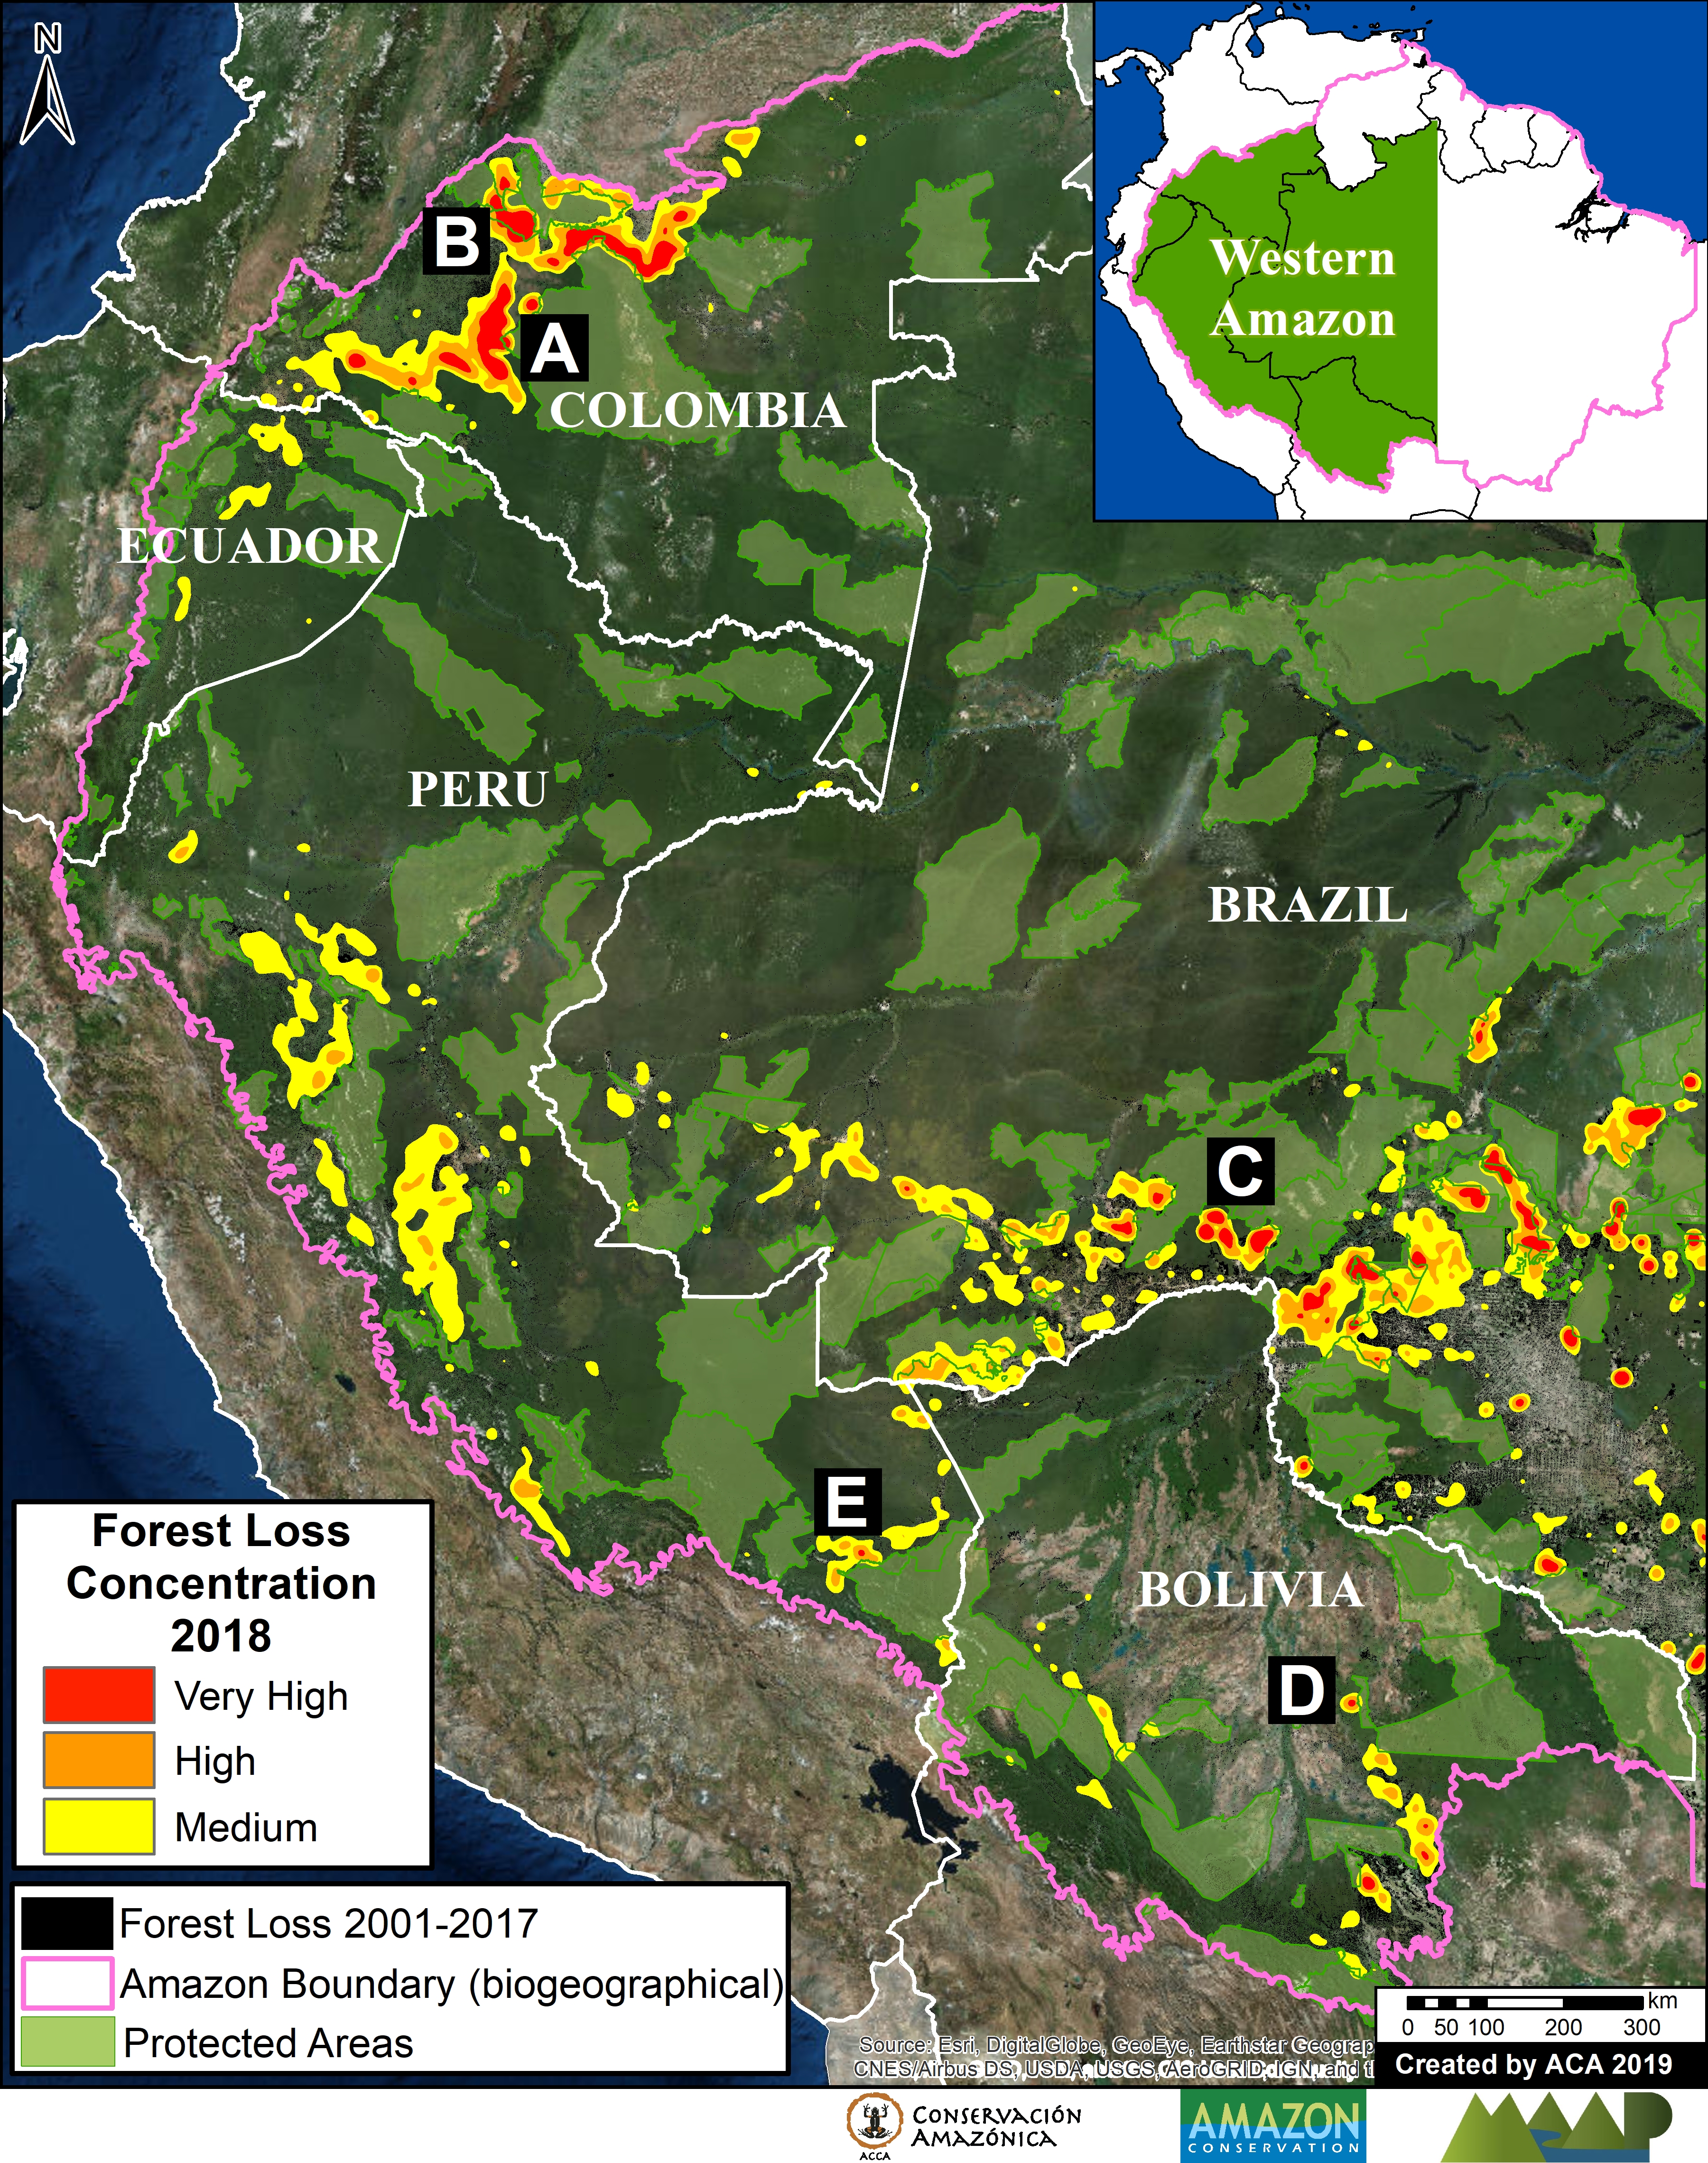
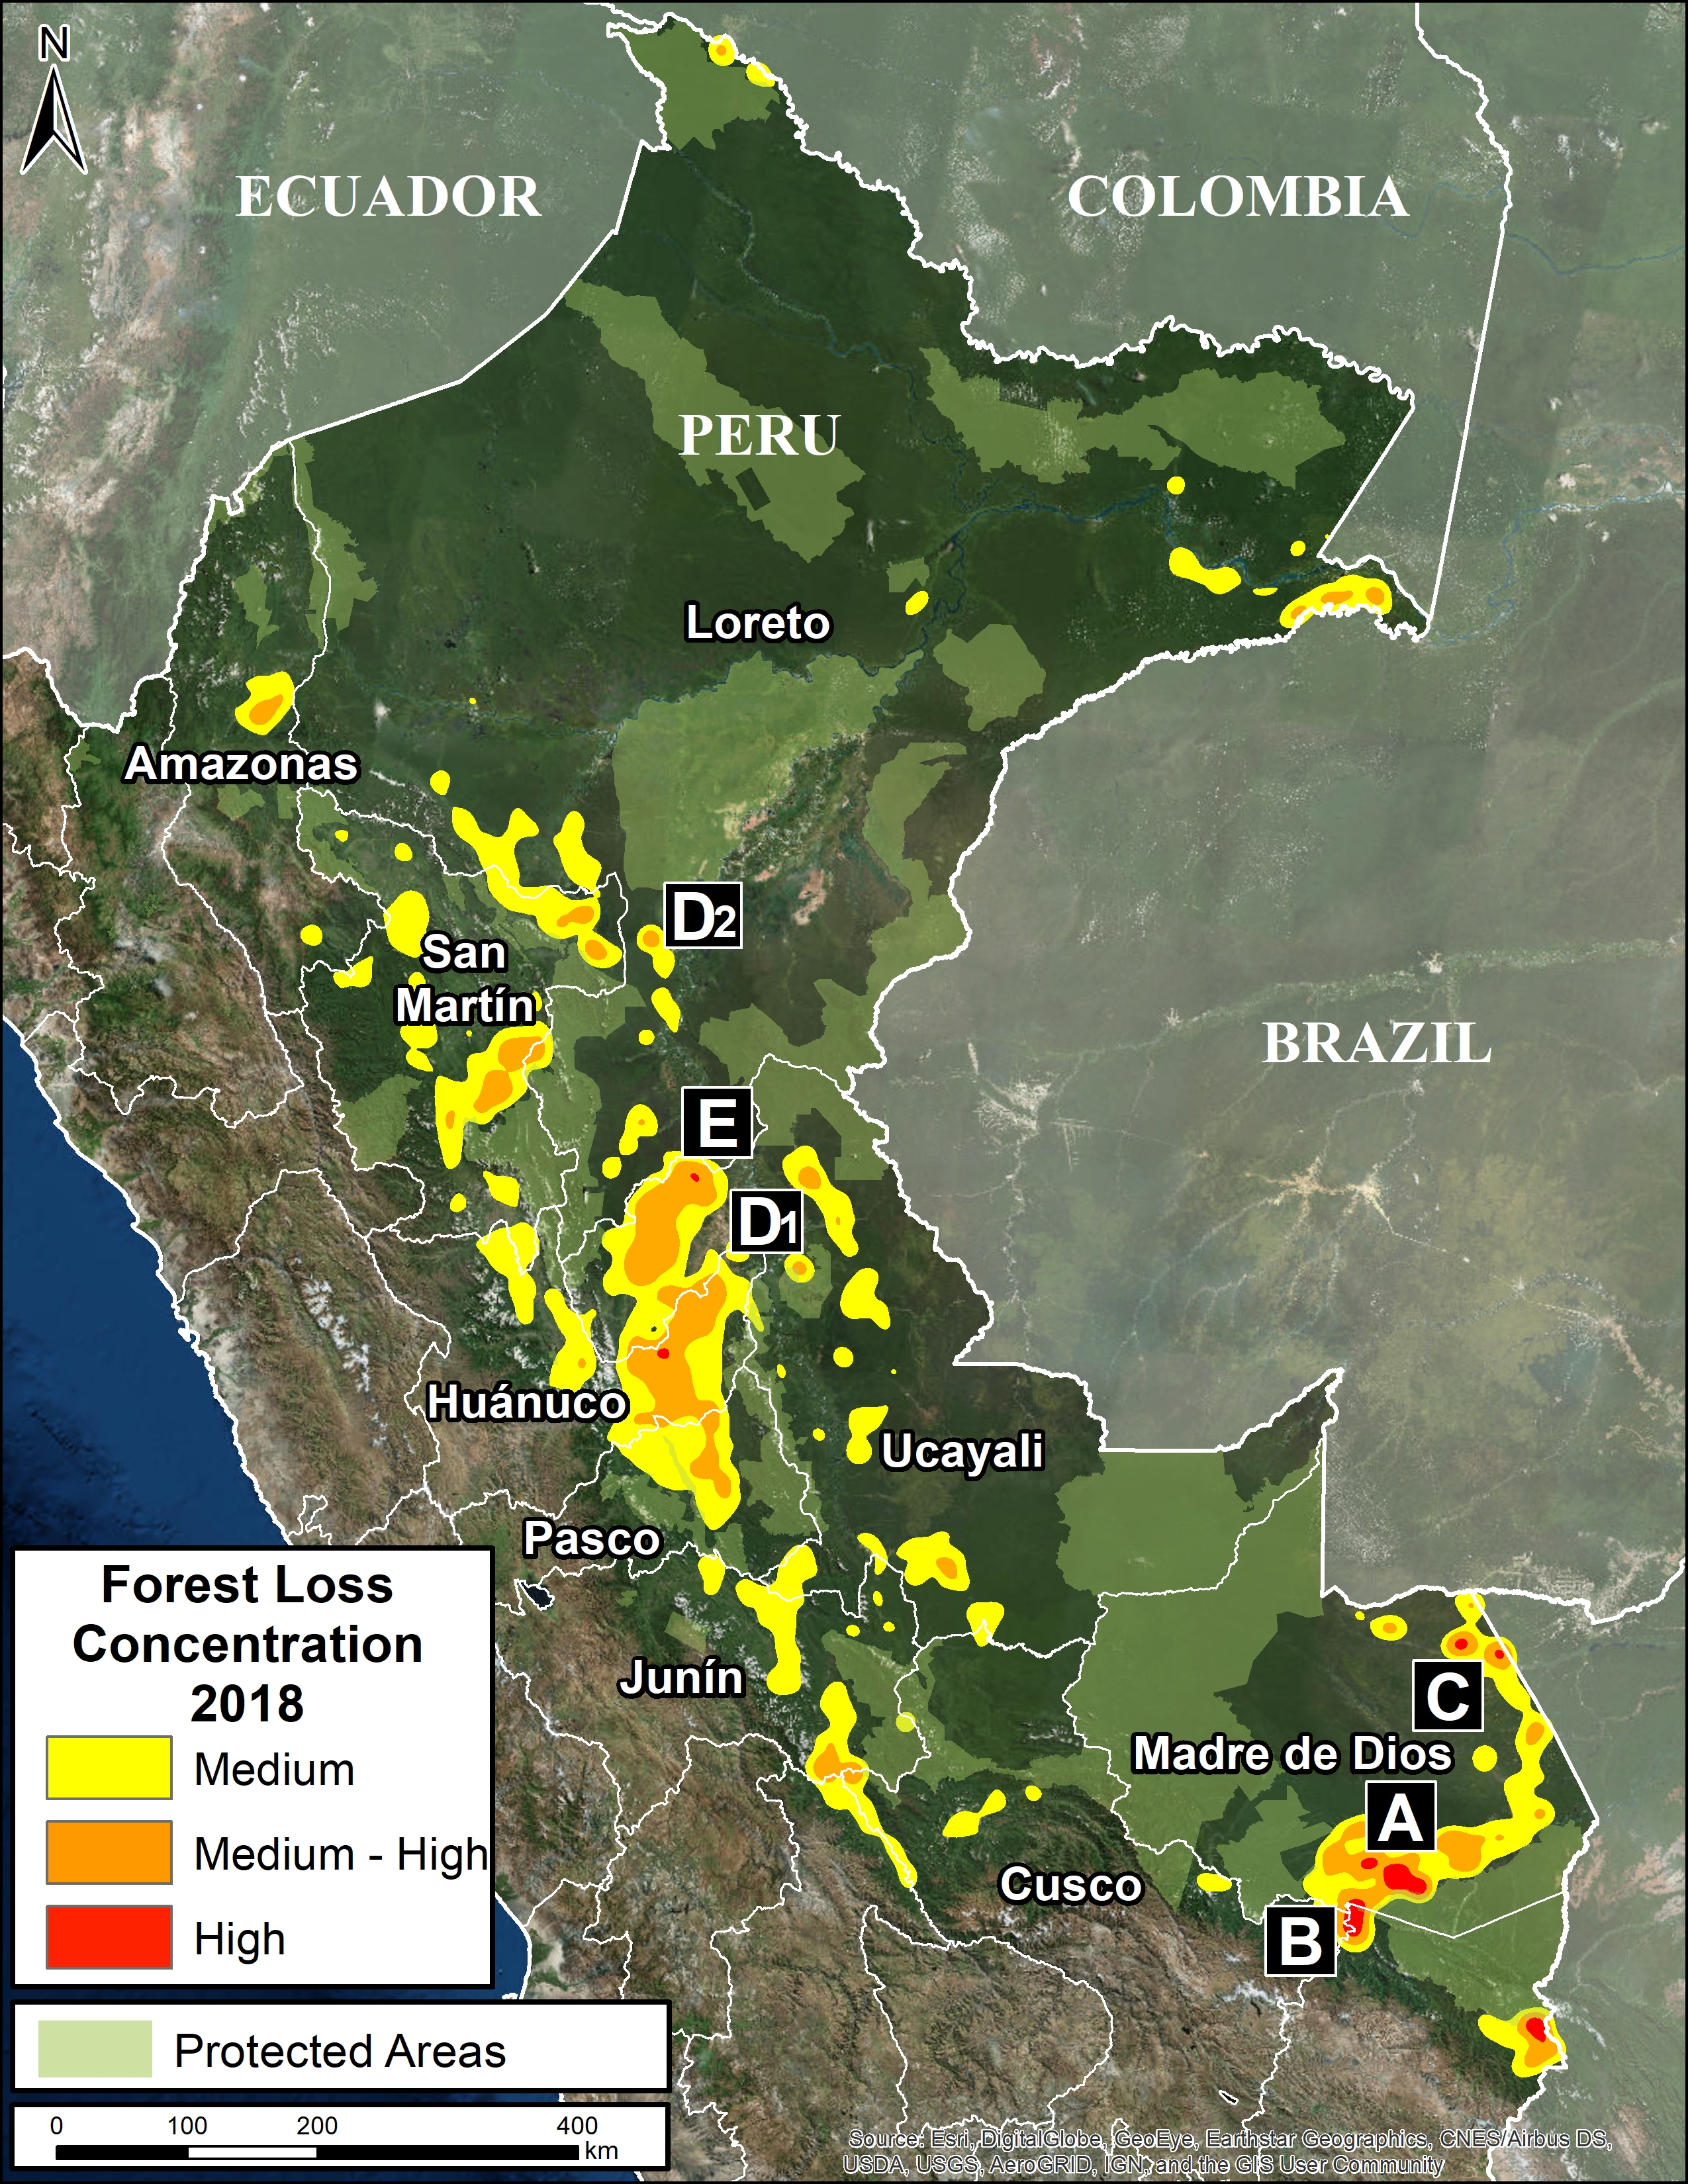
The Base Map shows the current forest loss hotspots, indicated by the colors yellow, orange and red.

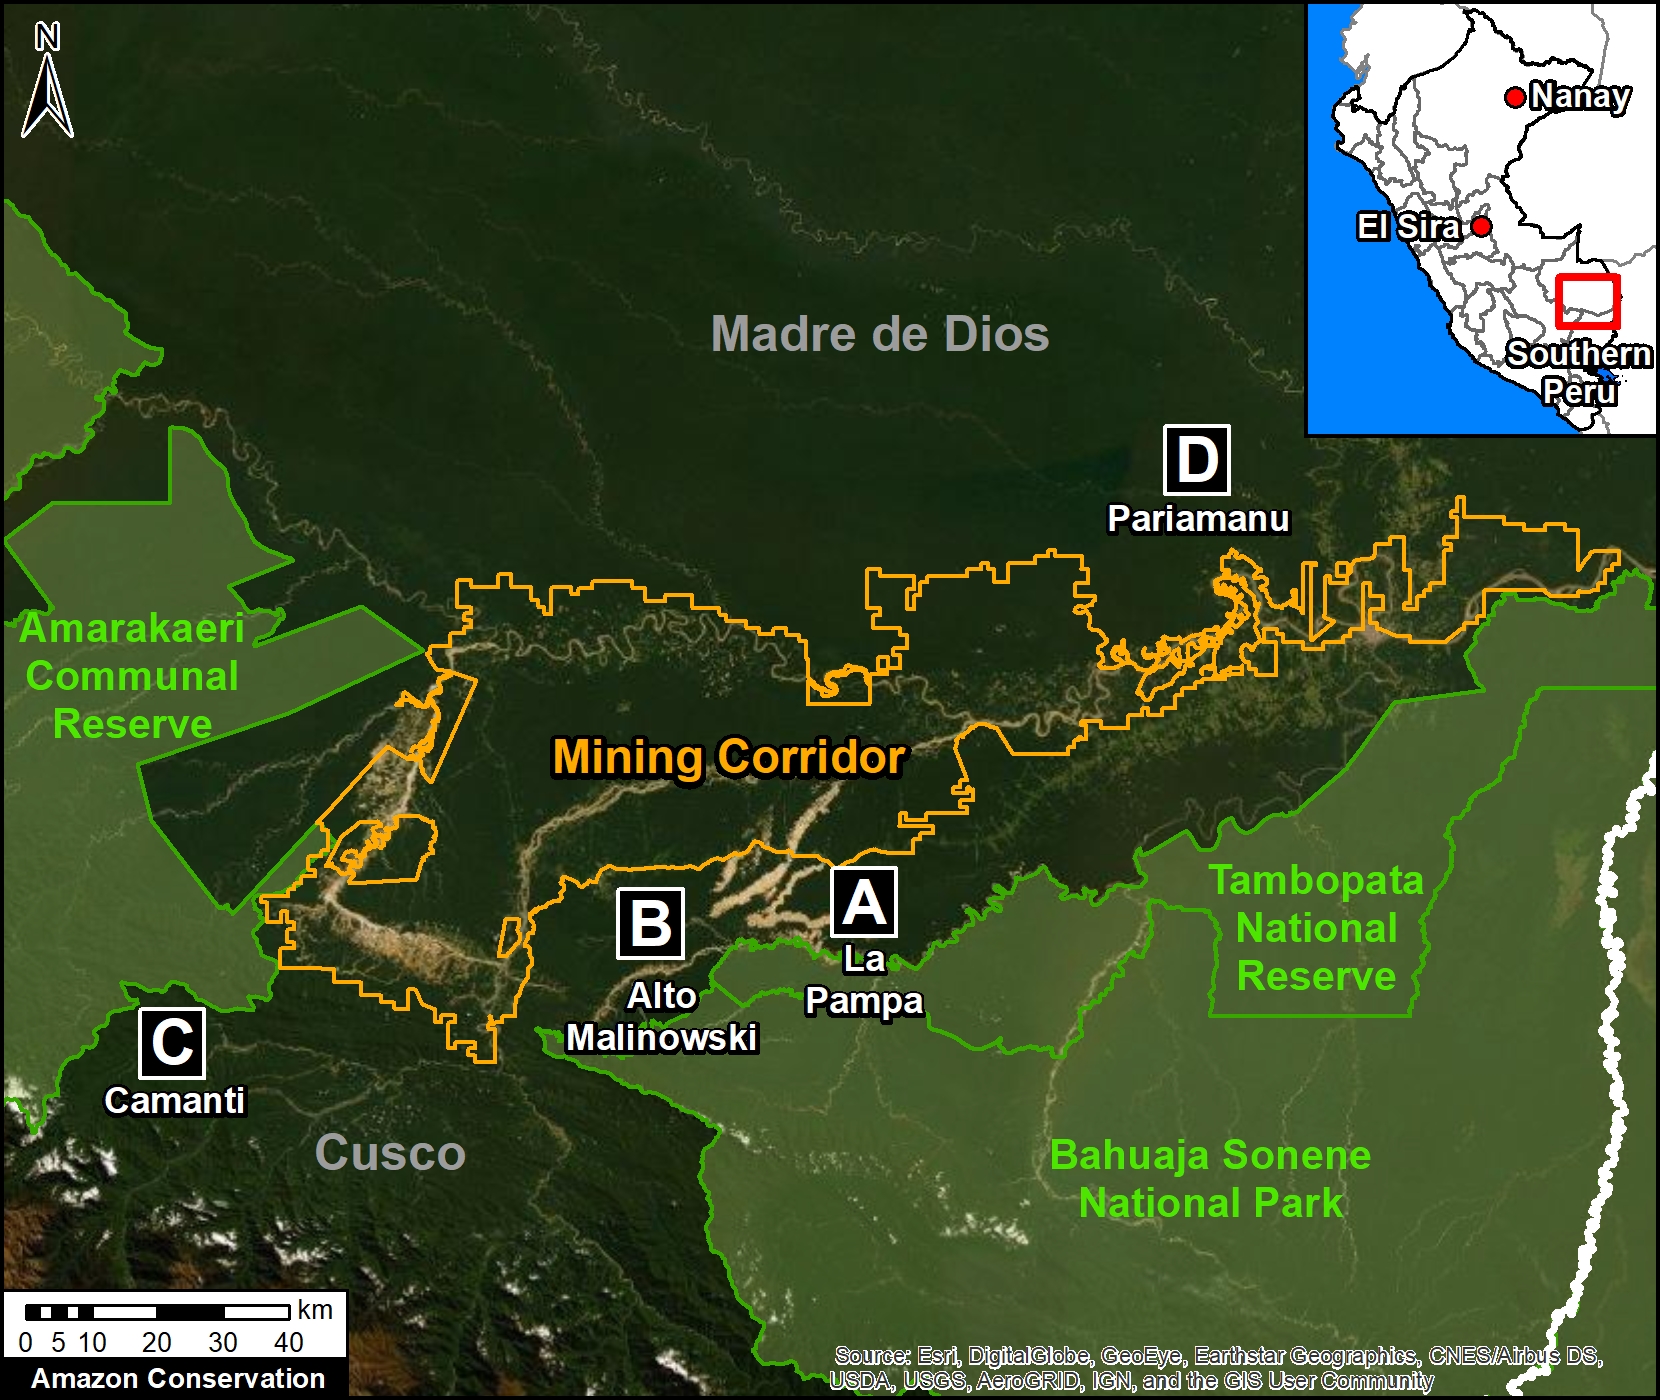
Below, we present the most urgent deforestation cases, caused by gold mining and agriculture (both large and small scale), the current leading deforestation drivers in Peru.

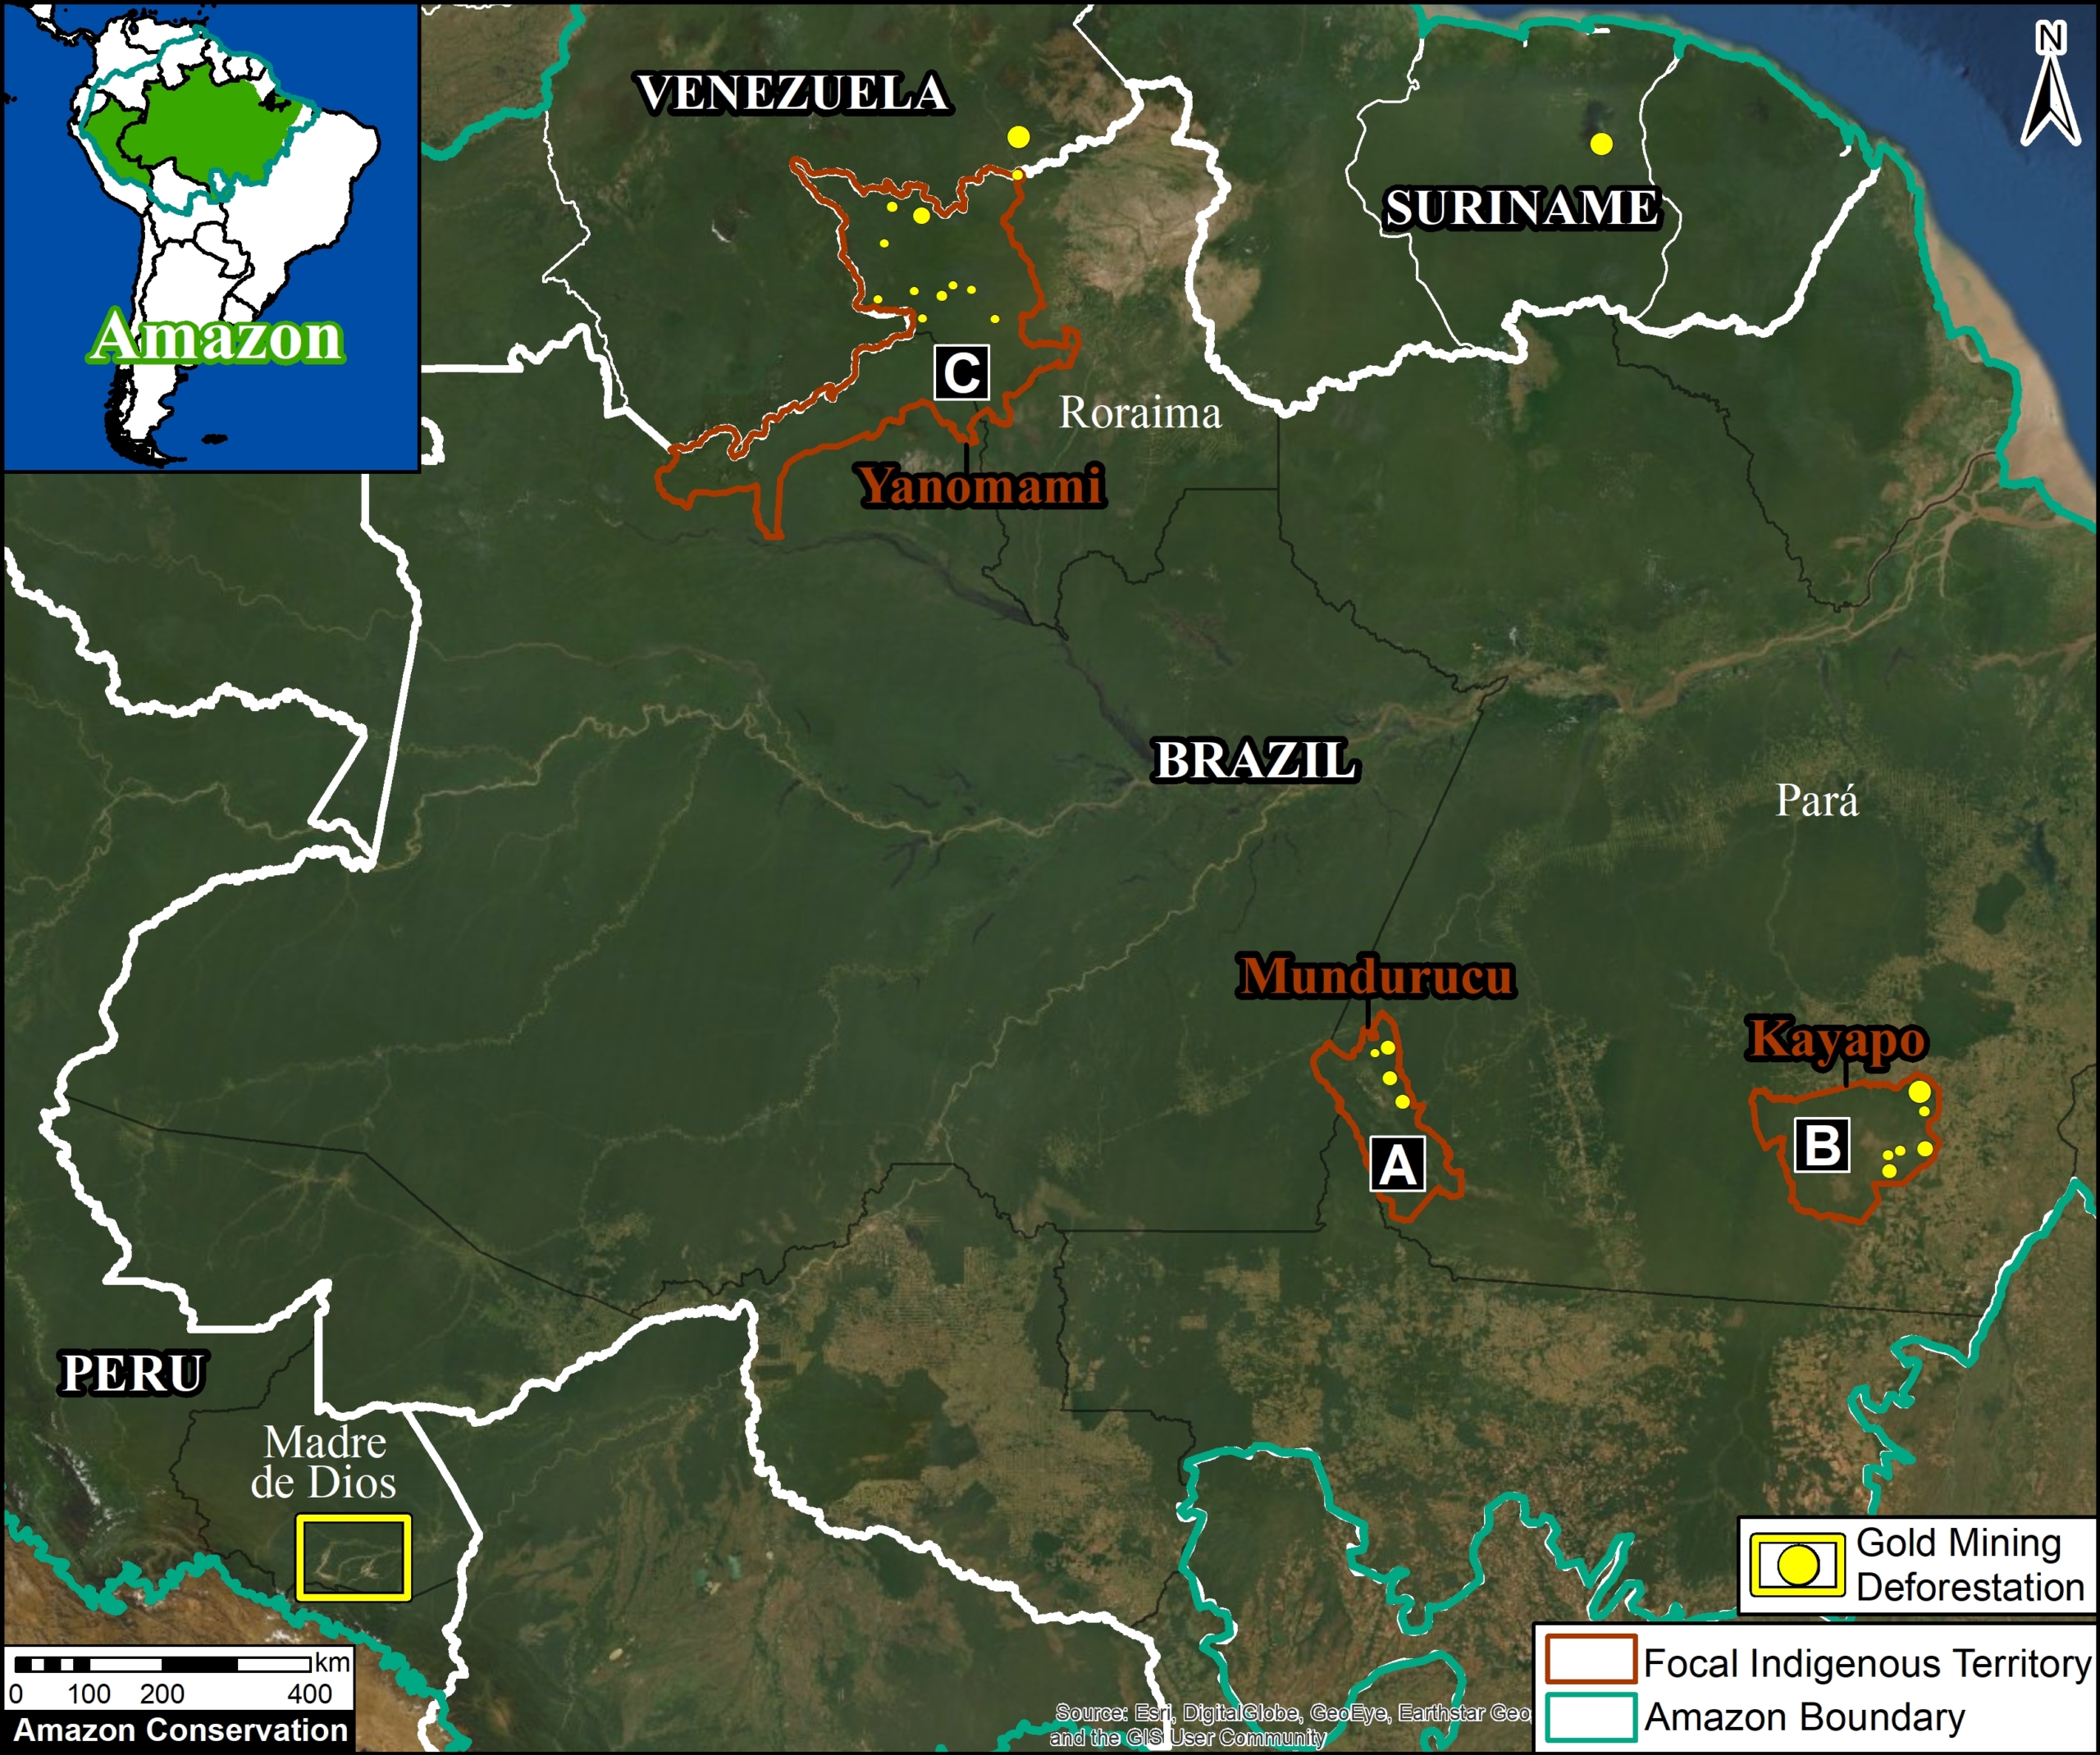
The Letters A-I on the Base Map correspond to the location of the cases described below.

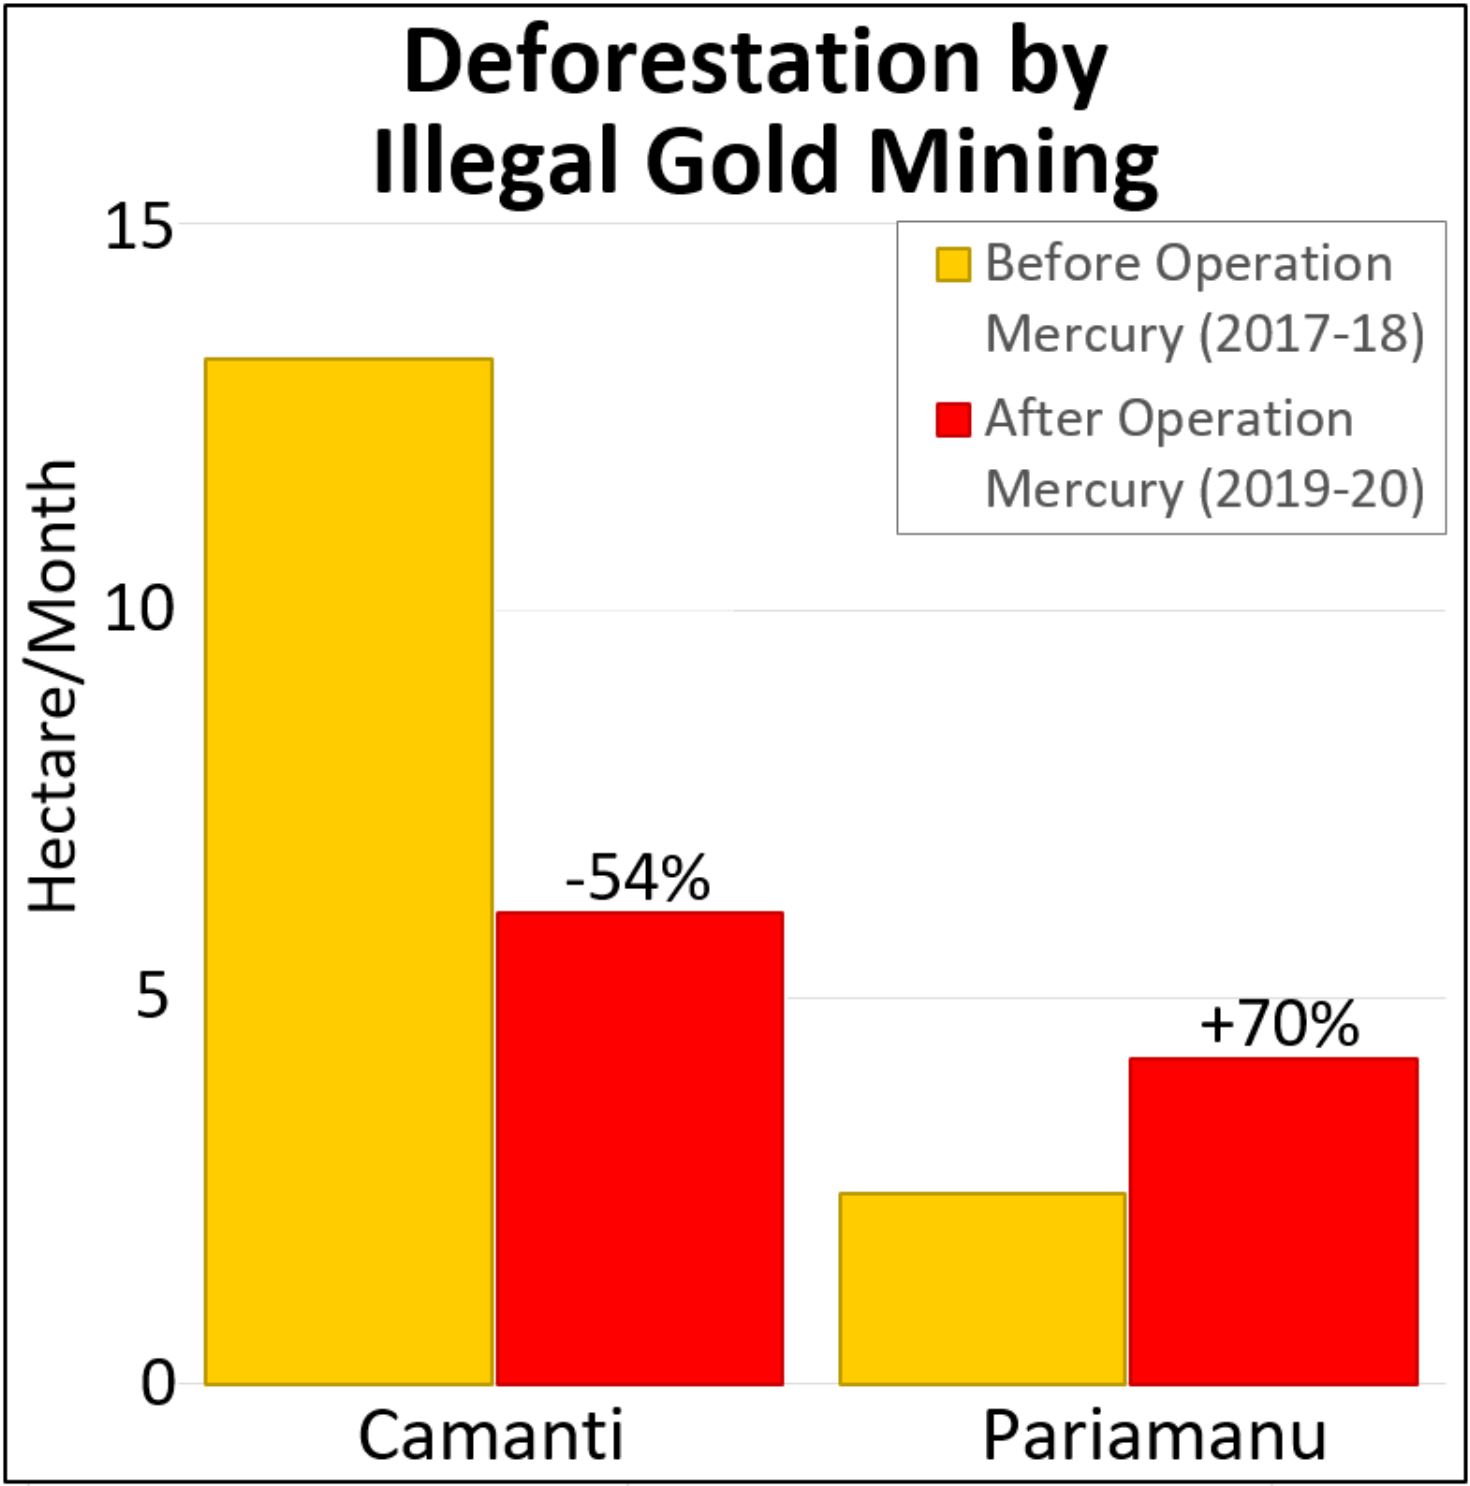
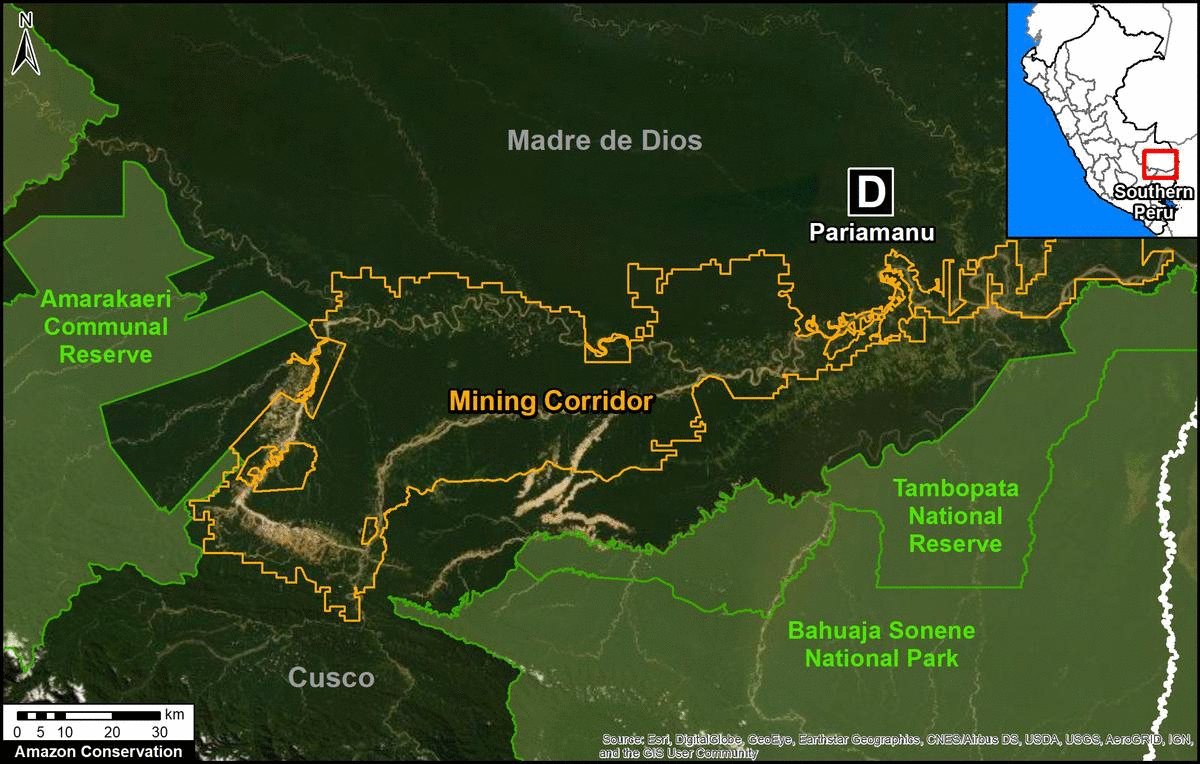
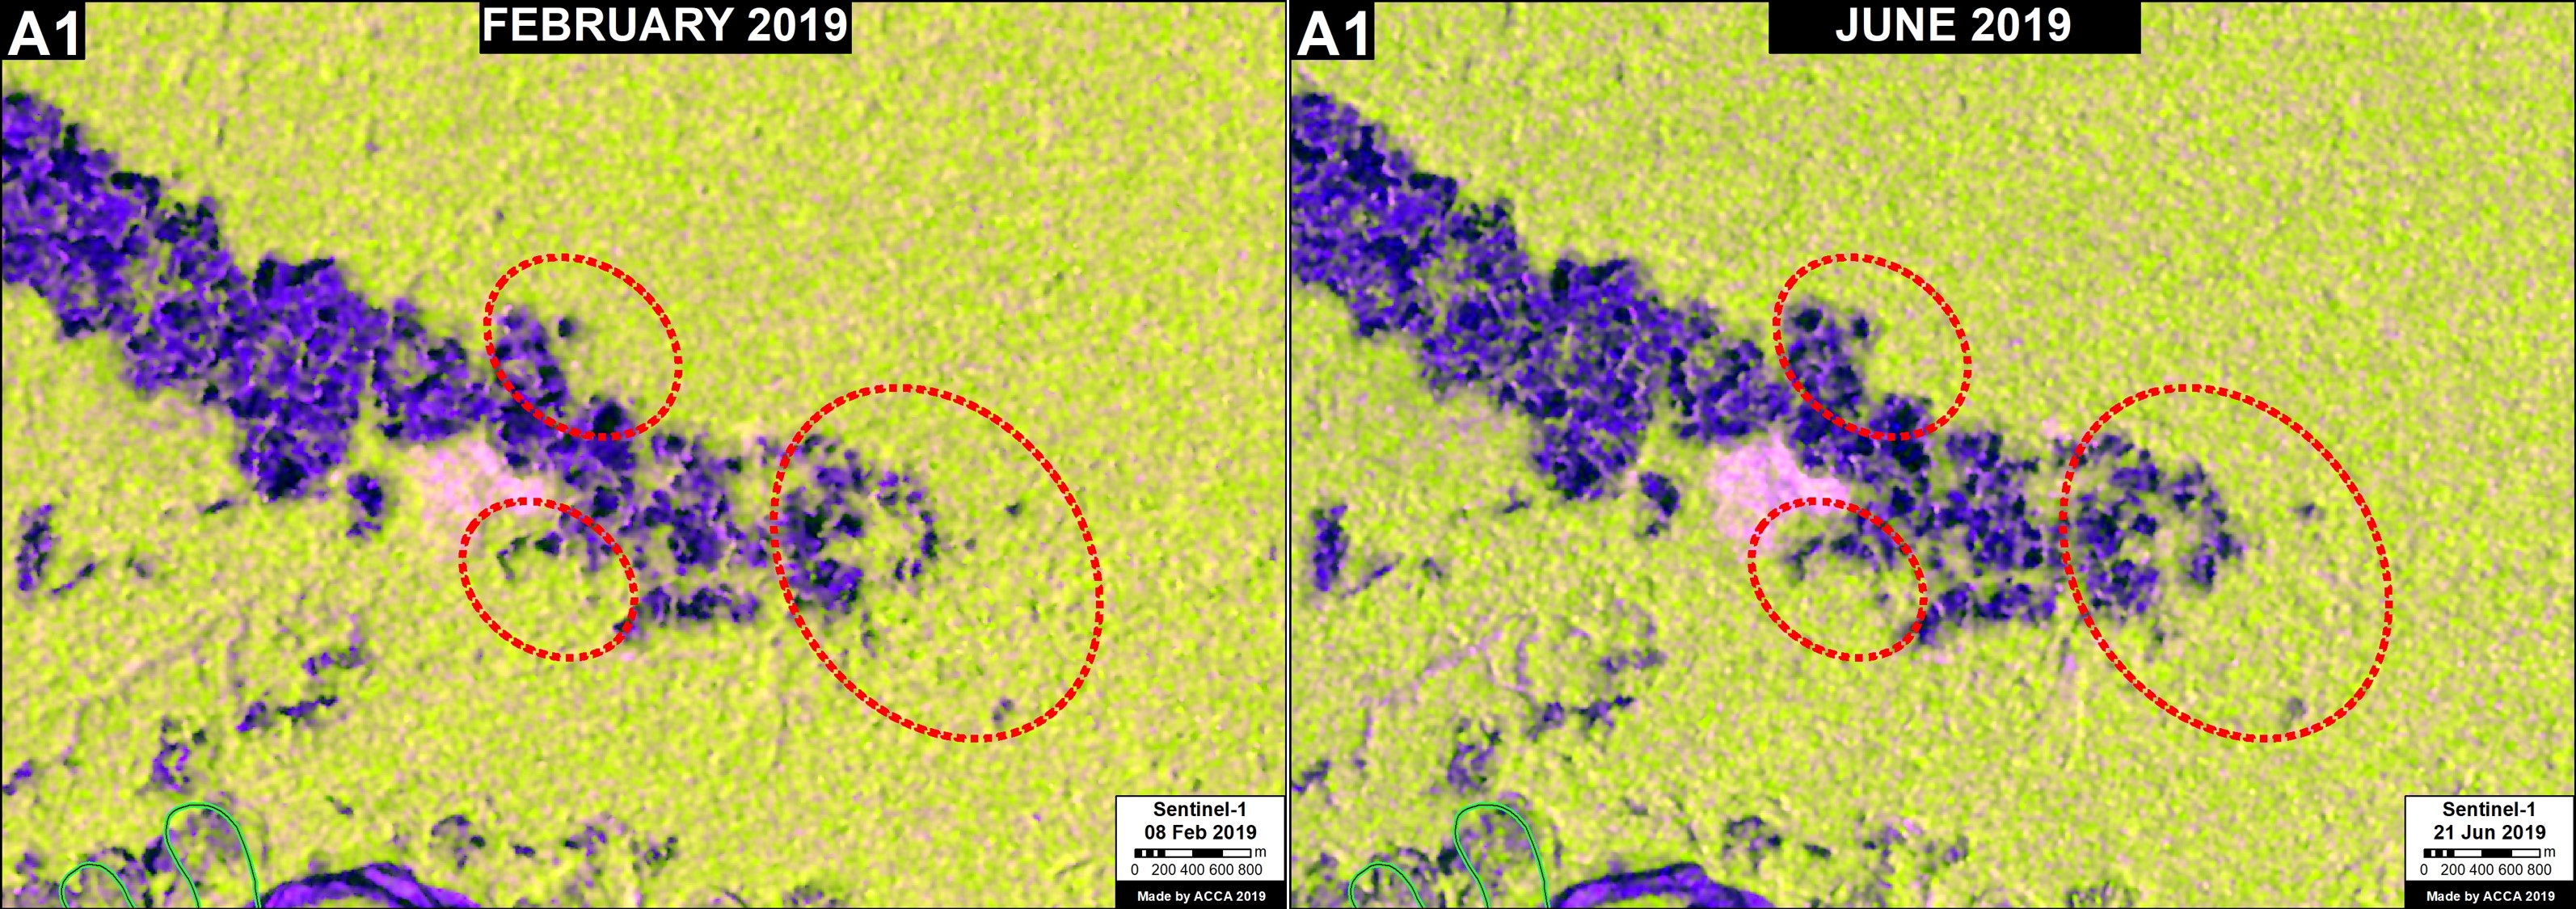
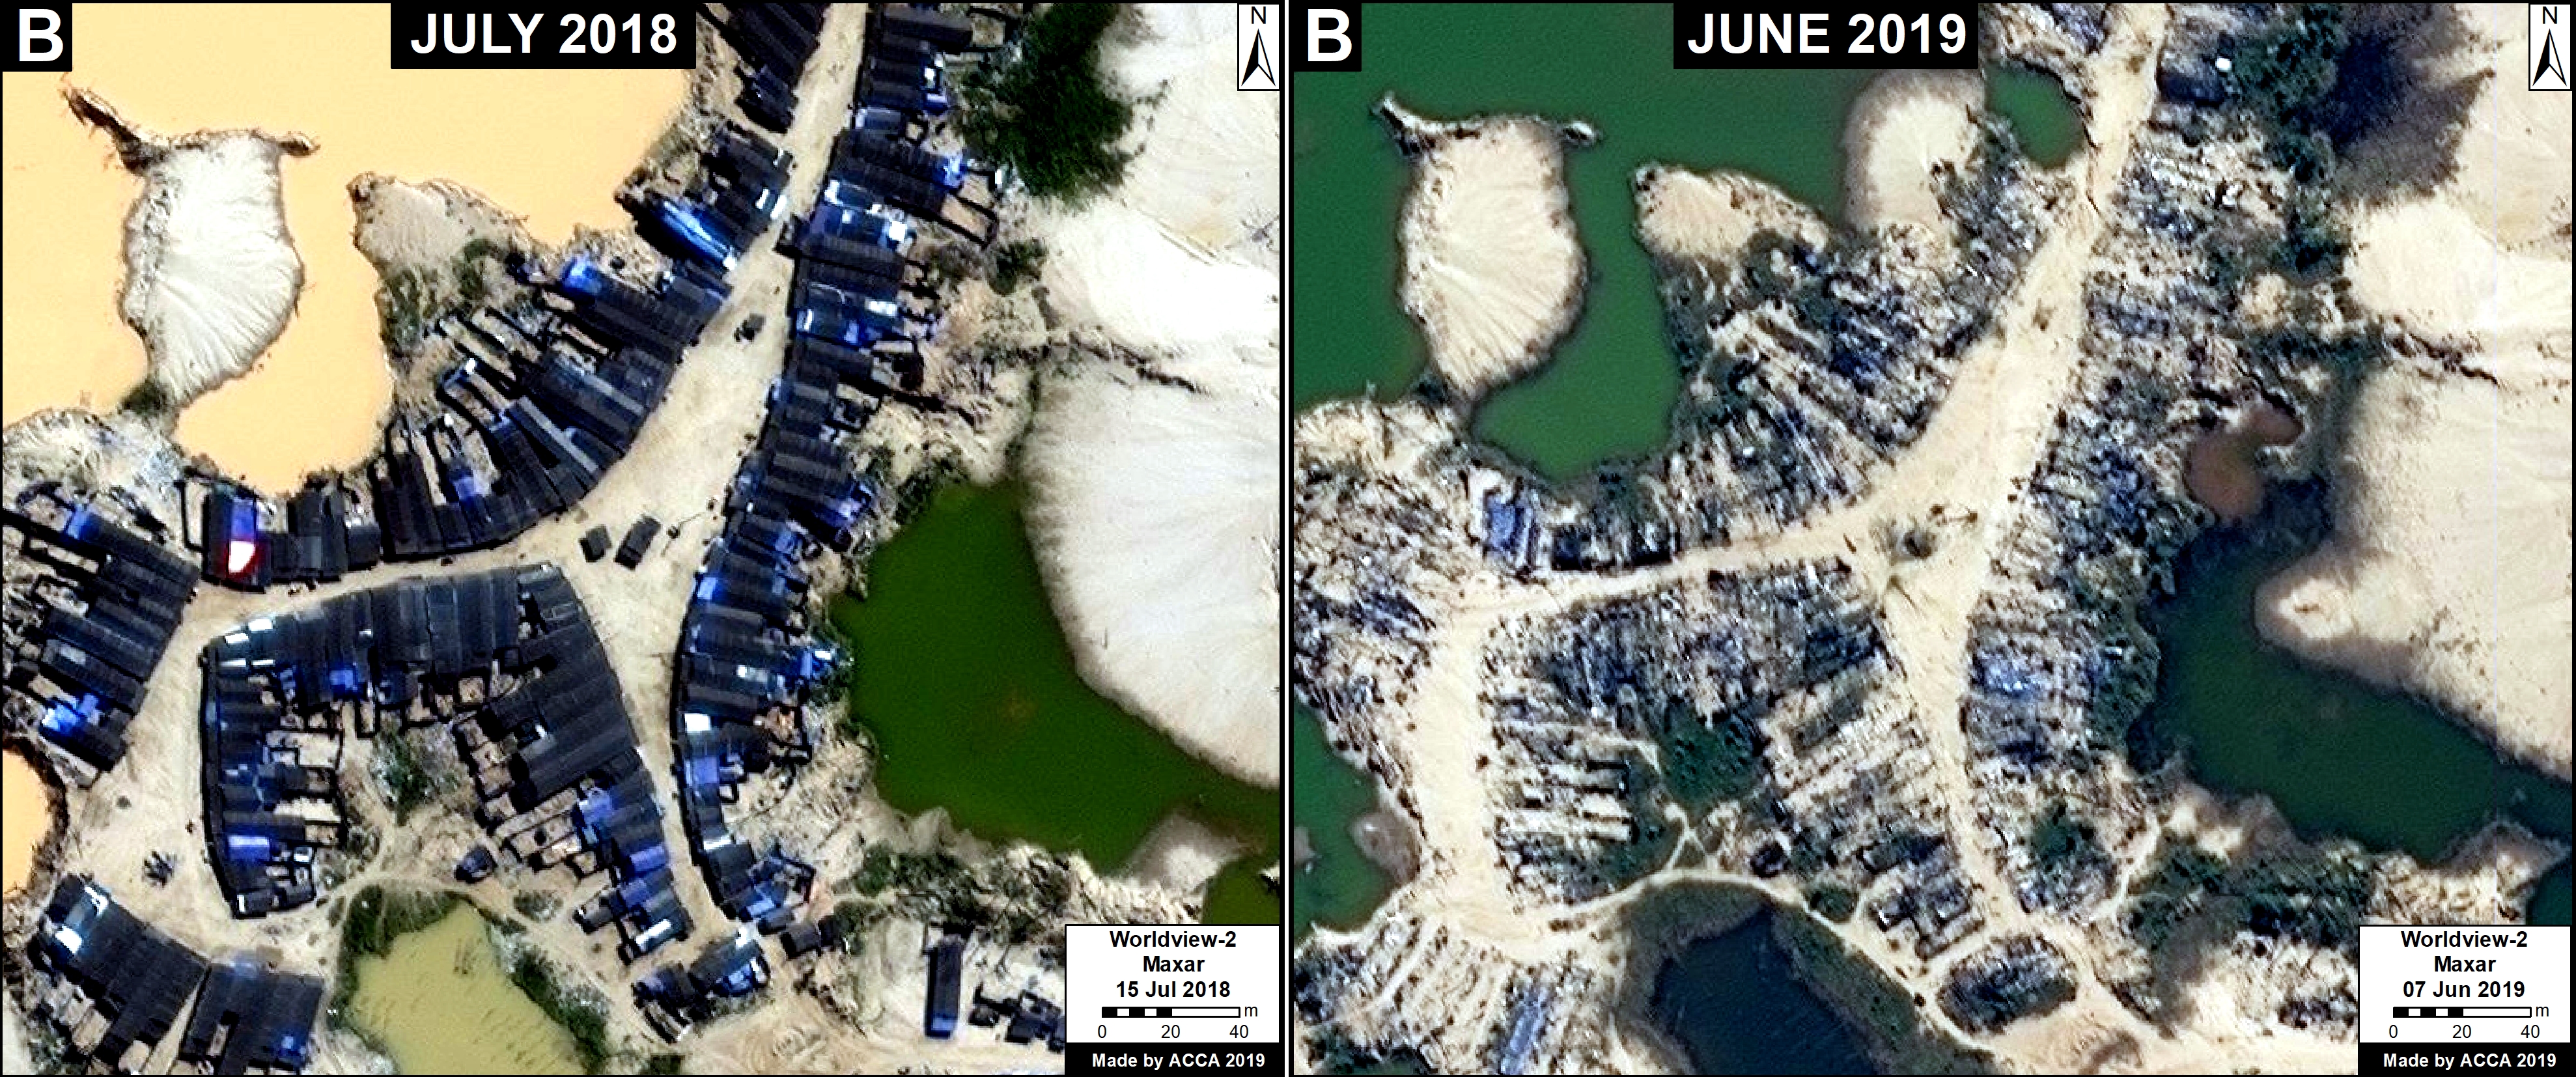
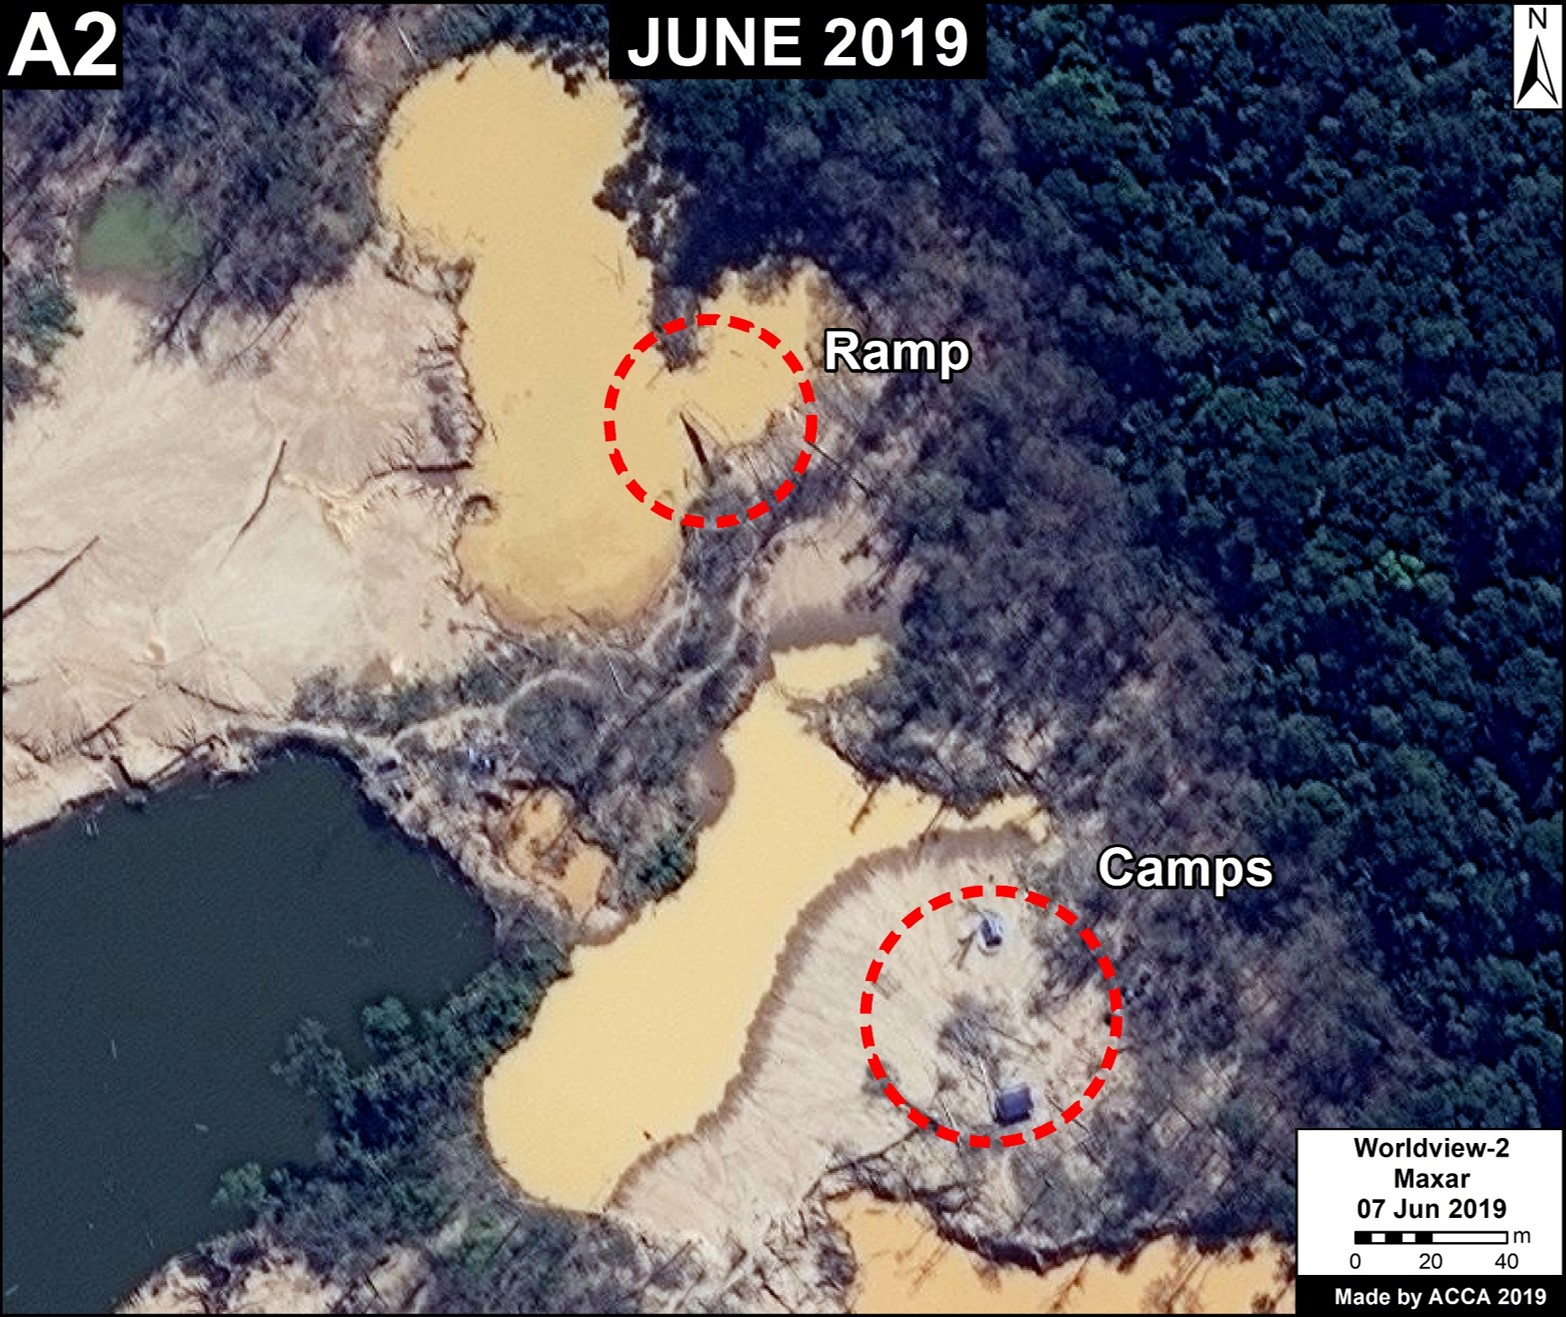
One of the key cases is the new illegal gold mining hotspot along the Pariamanu river (Letter A in the southern Peruvian Amazon).

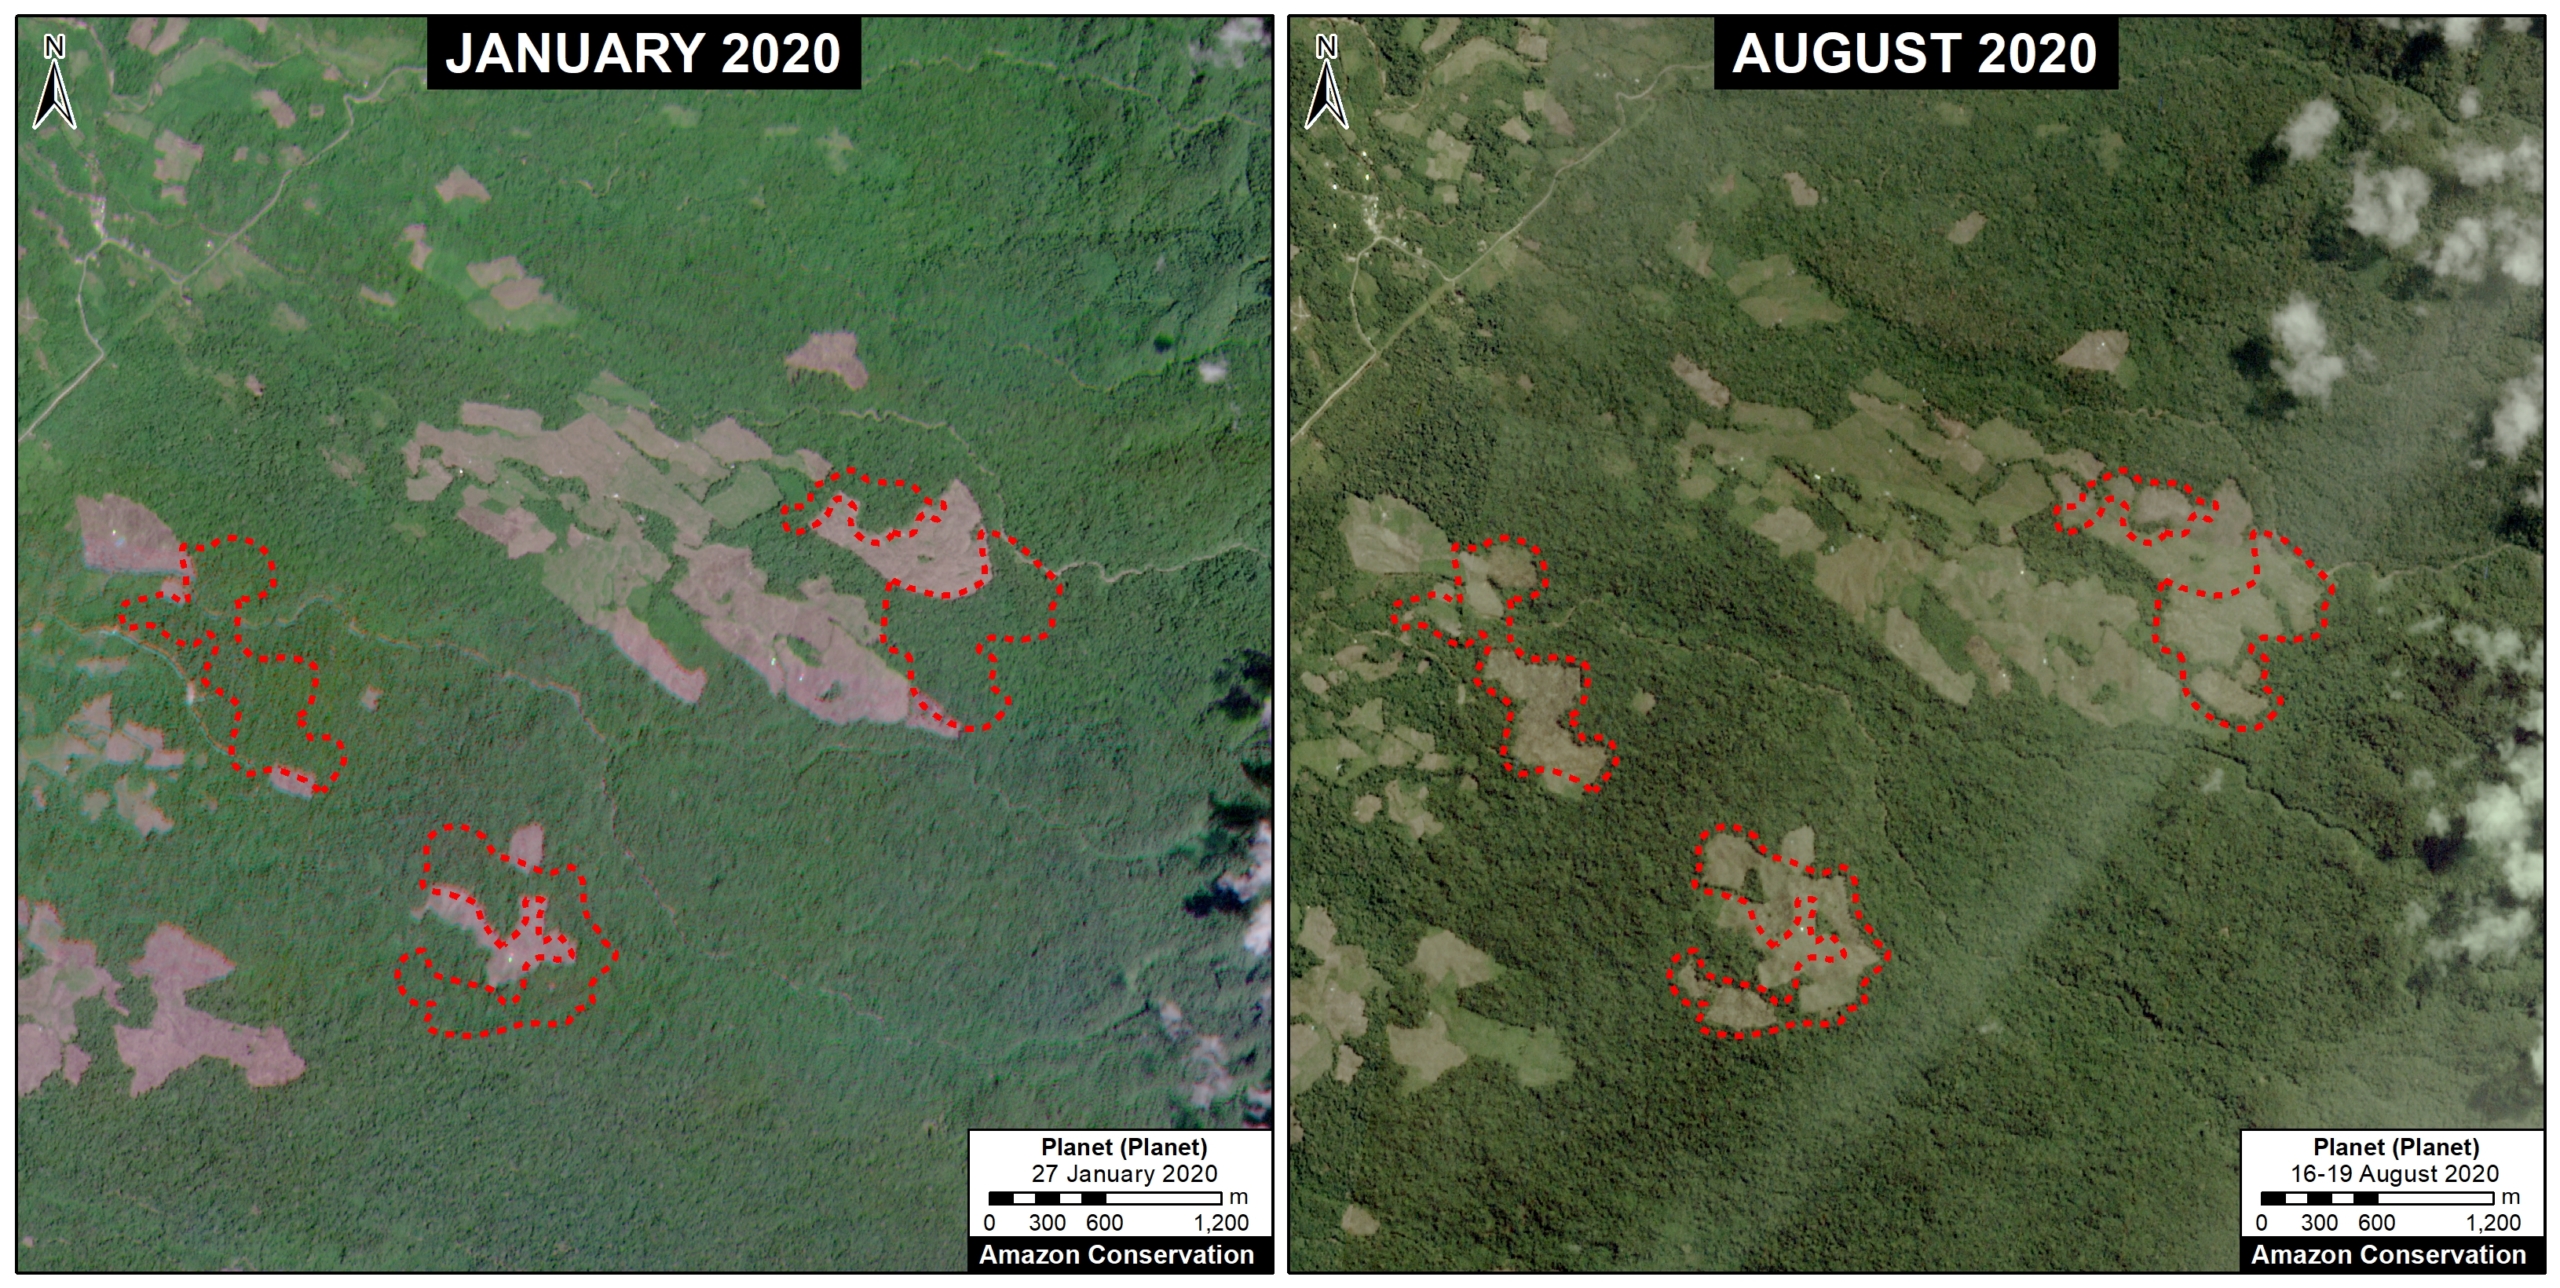
Another important case is the expanding large-scale agriculture by a Mennonite colony that continues causing an alarming deforestation.

The other cases deal with small-scale agriculture, which cumulatively represent the main deforestation driver in Peru.


Urgent Deforestation Cases 2020

1. Gold Mining

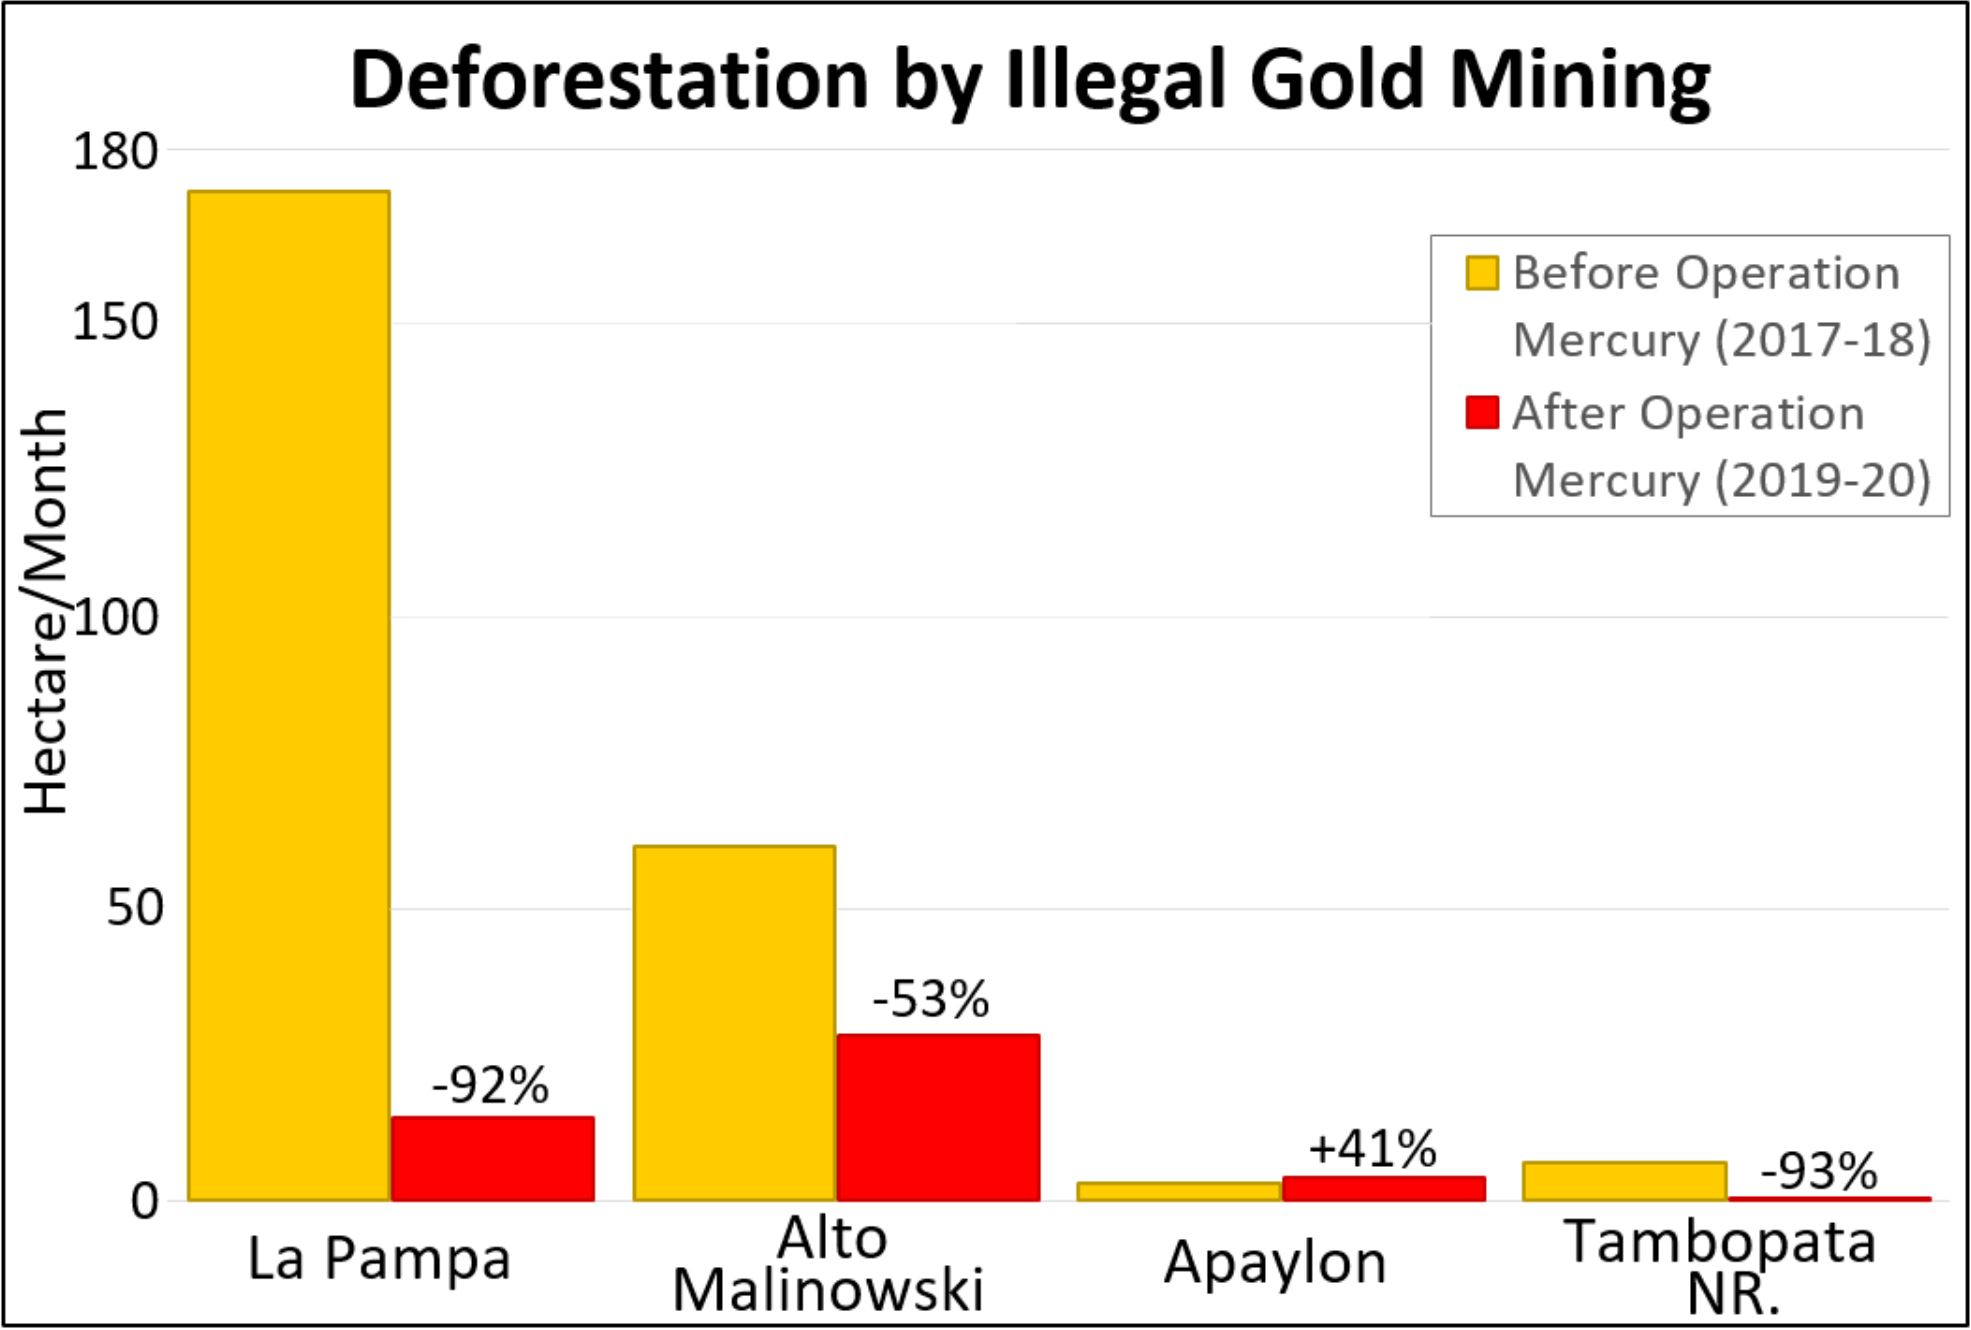
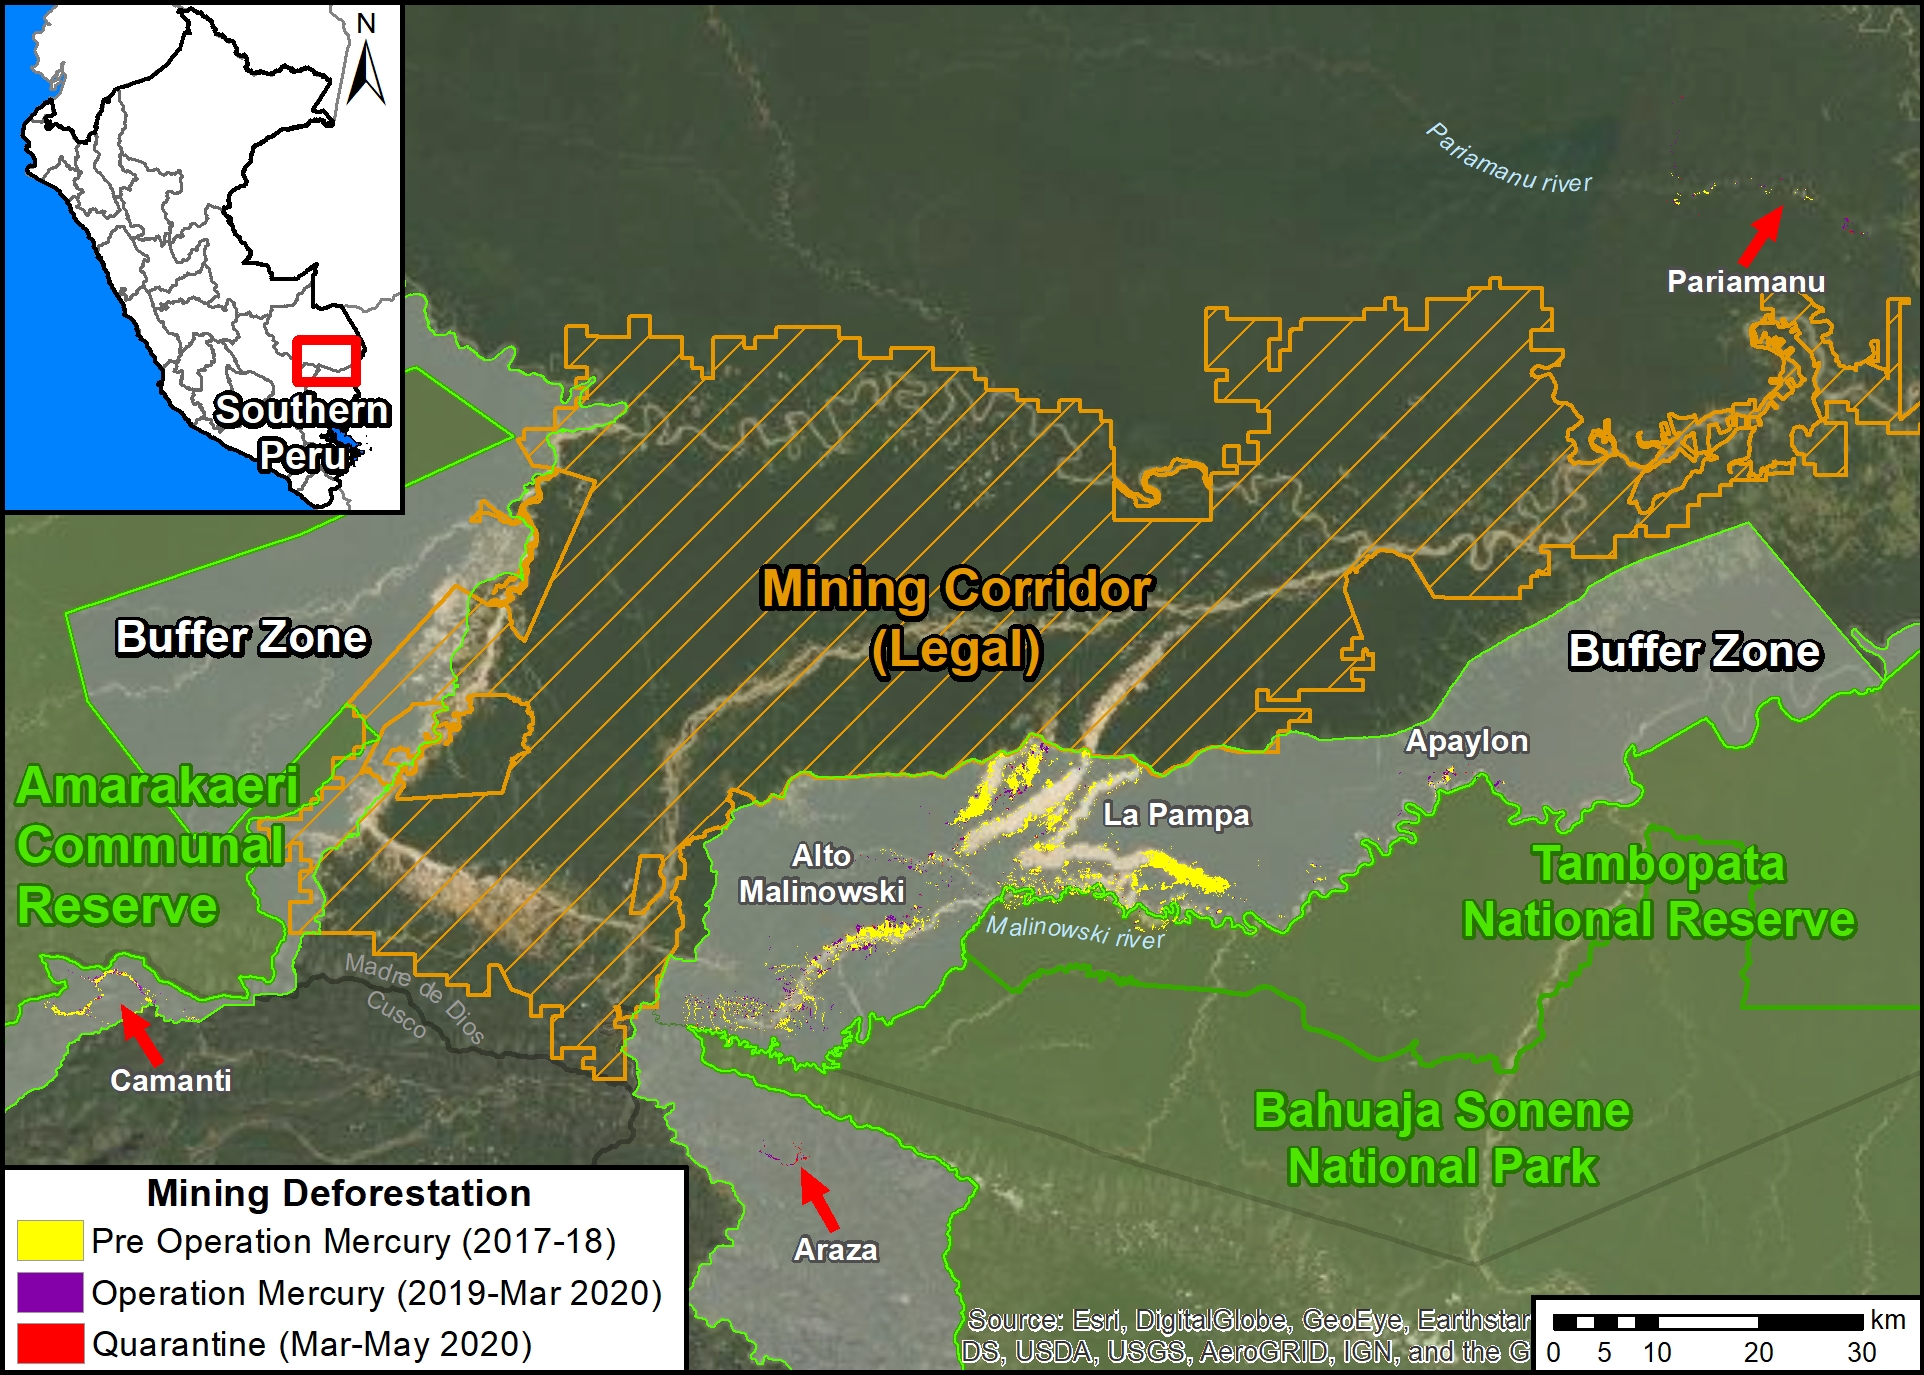
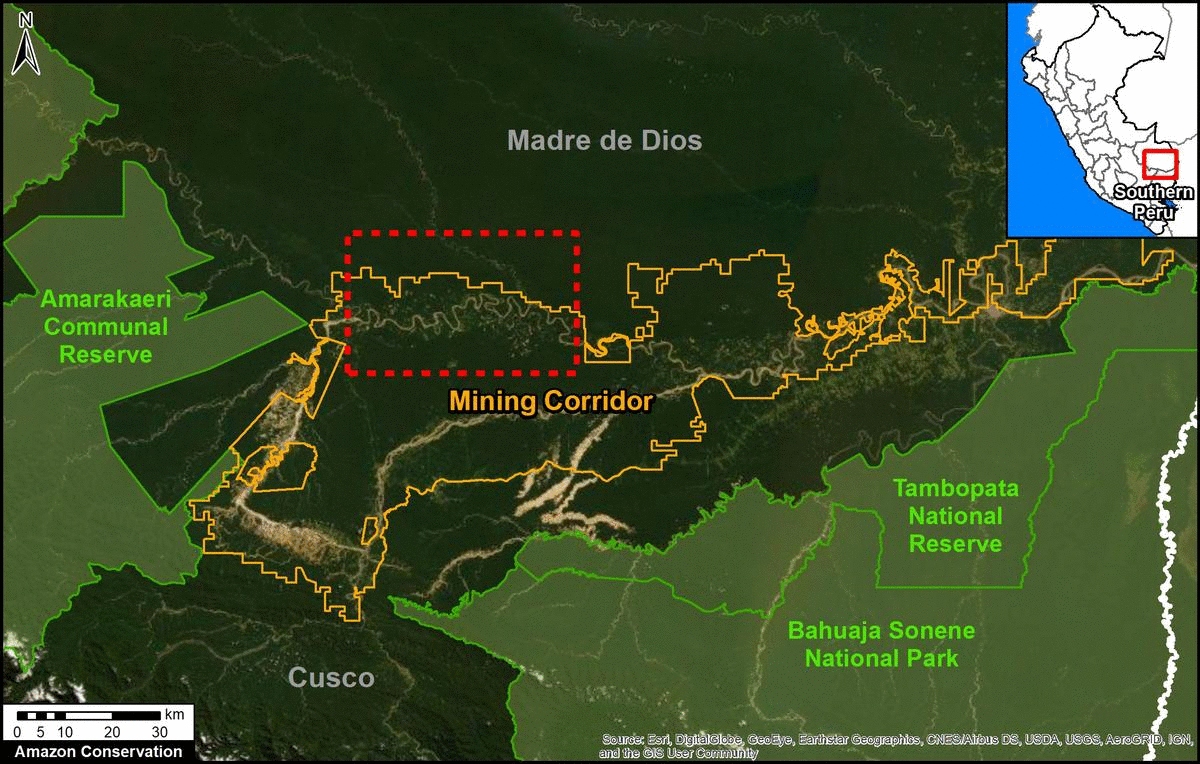
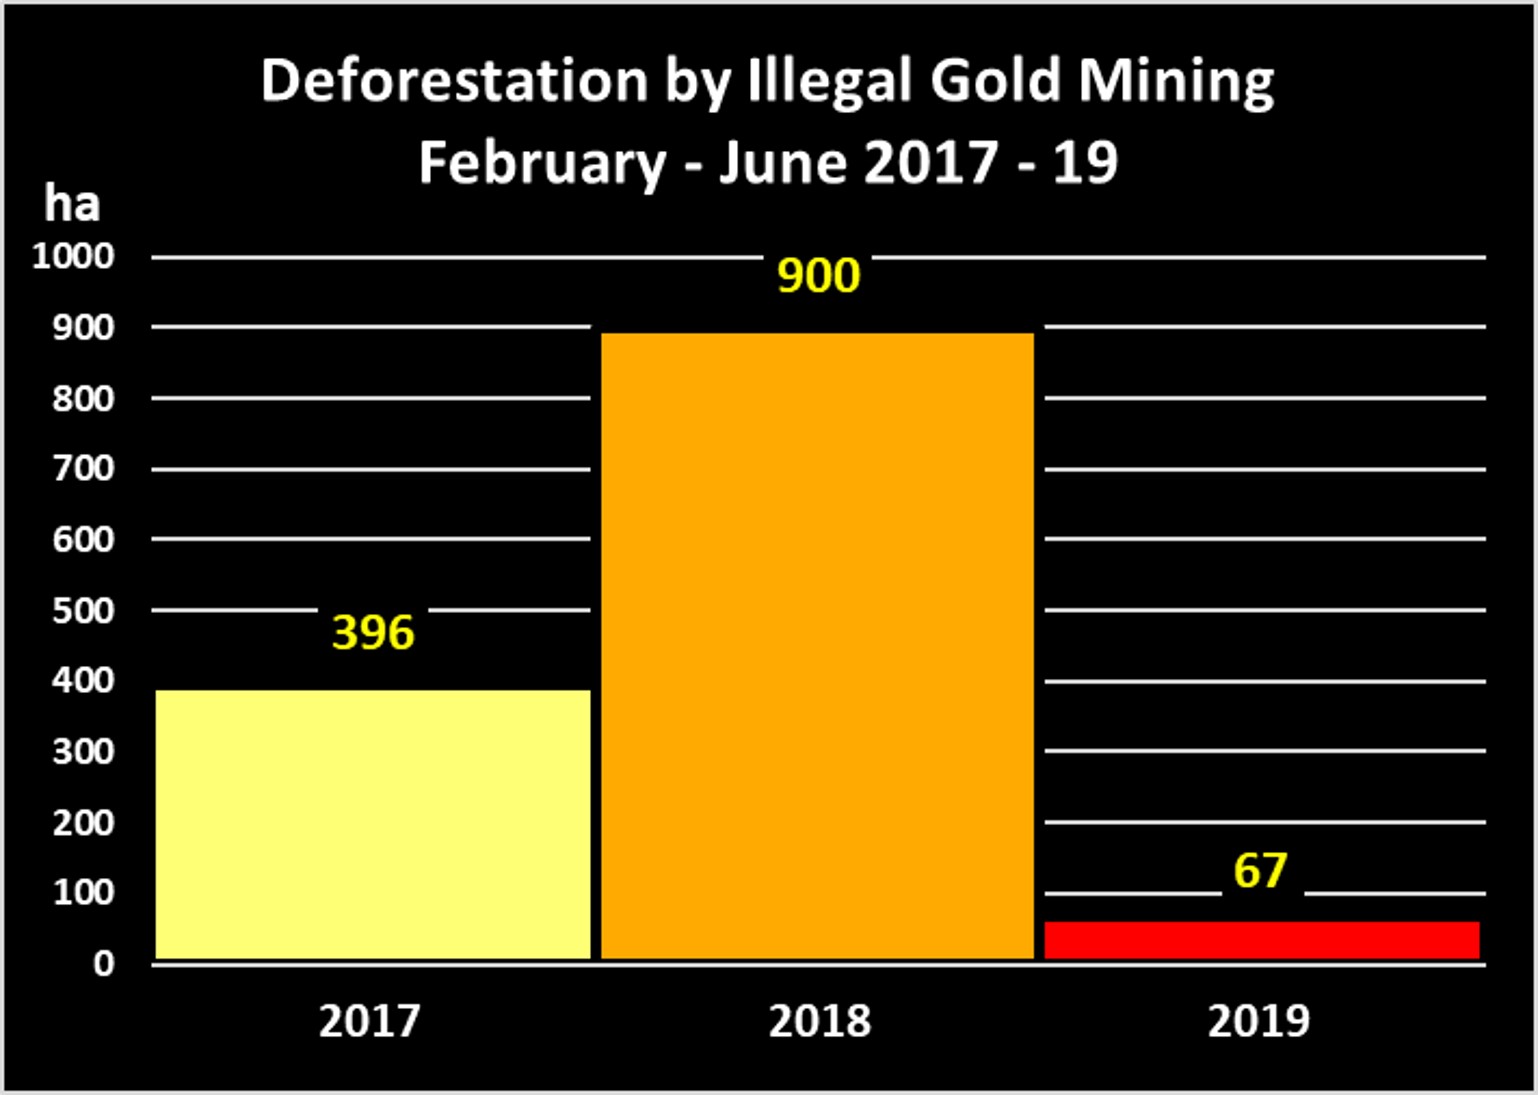
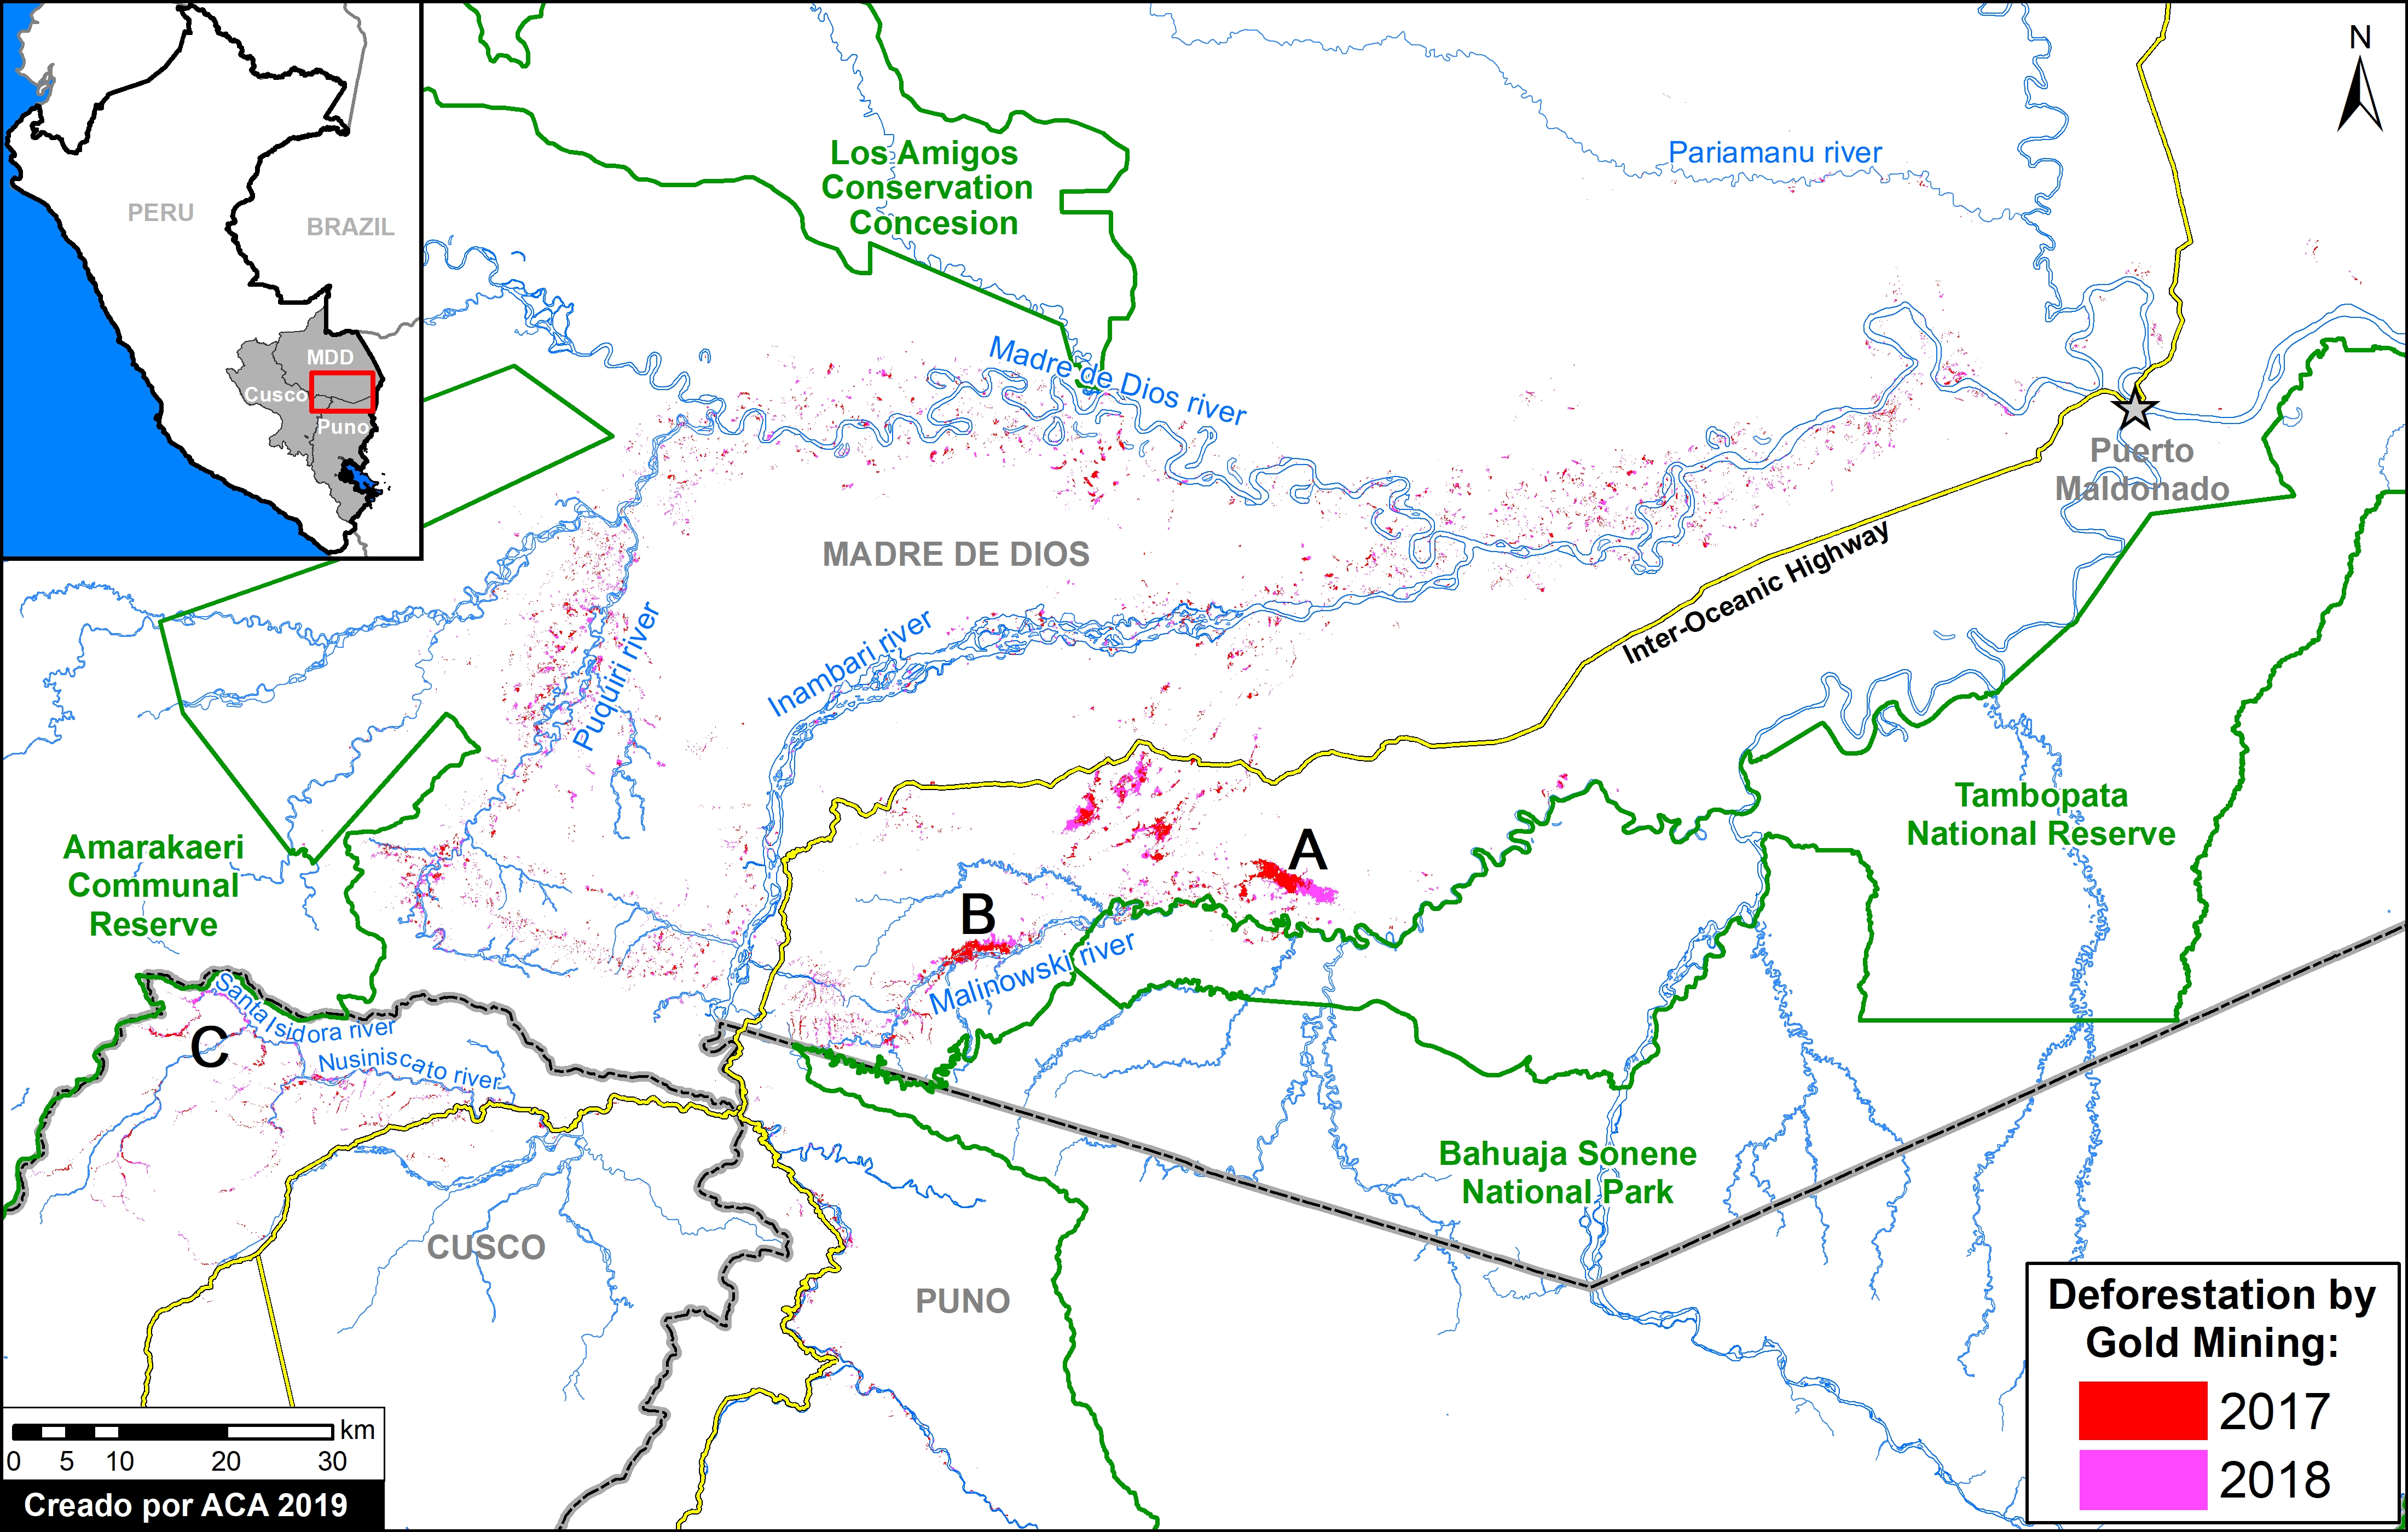
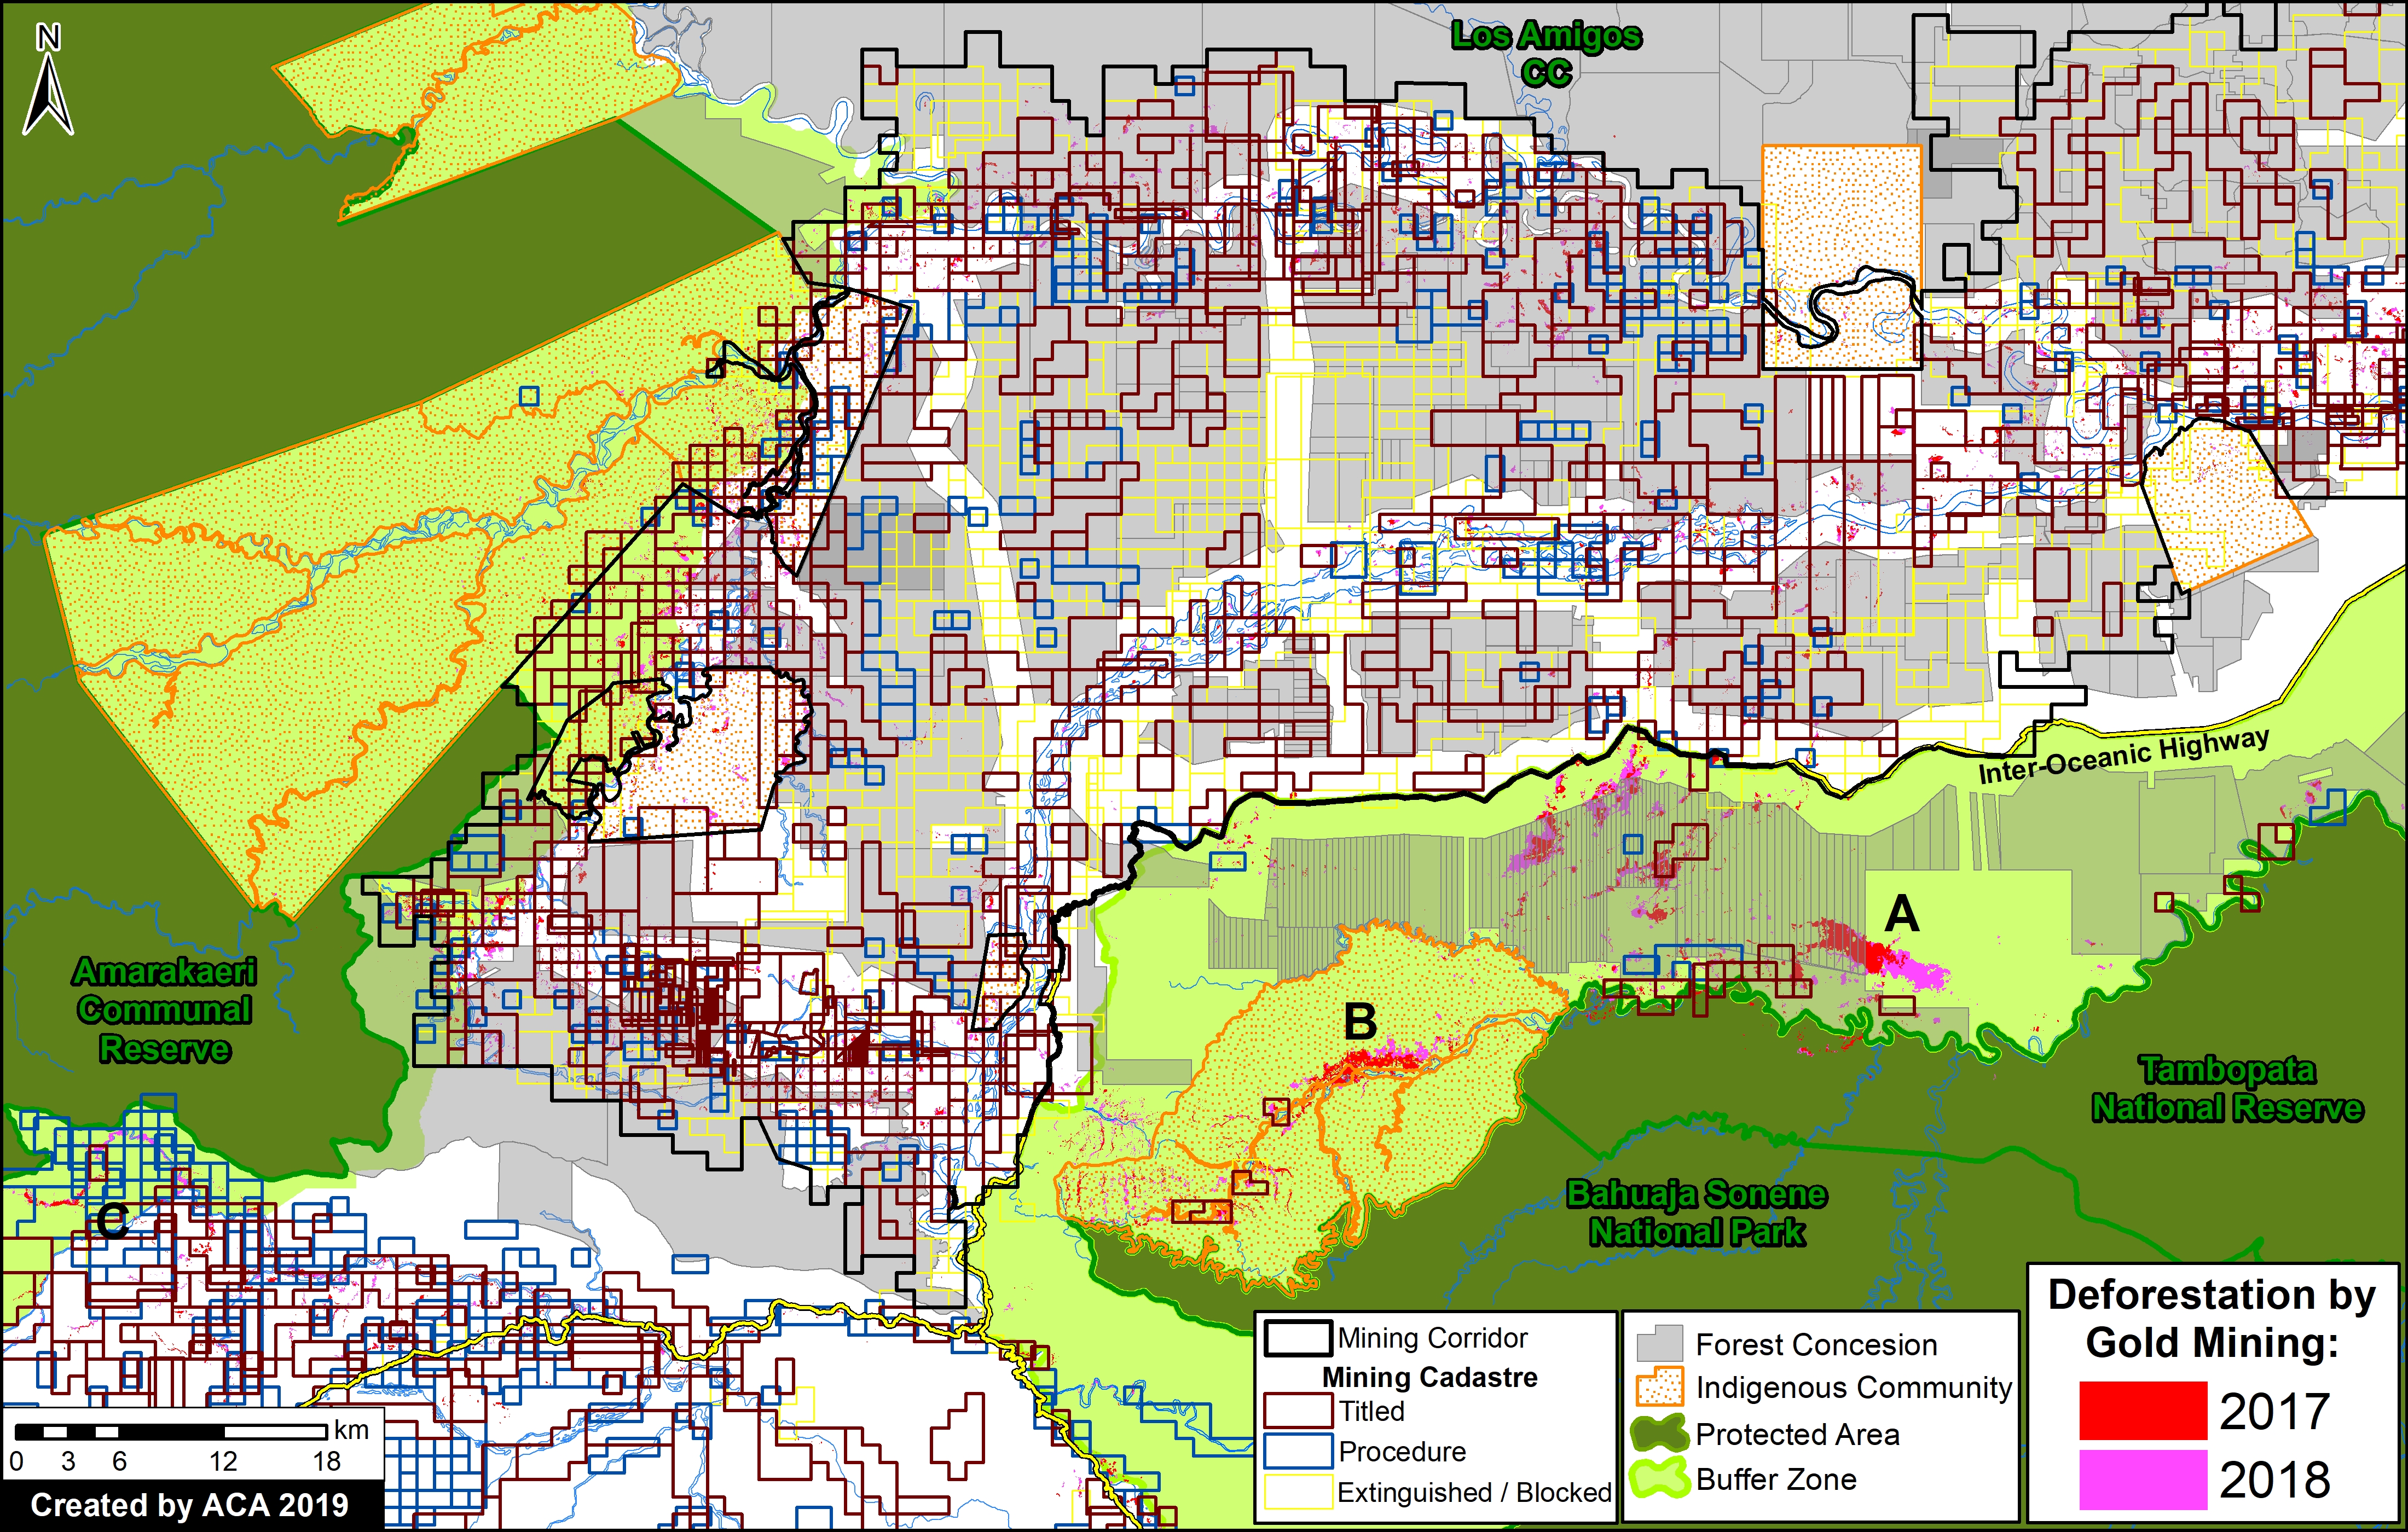
In MAAP #121, we reported that, in general, gold mining deforestation has decreased in the southern Peruvian Amazon following the government’s Operation Mercury, but it does continue in several critical areas. The images below show two of these areas (Pariamanu and Araza) with alarming new deforestation in 2020.
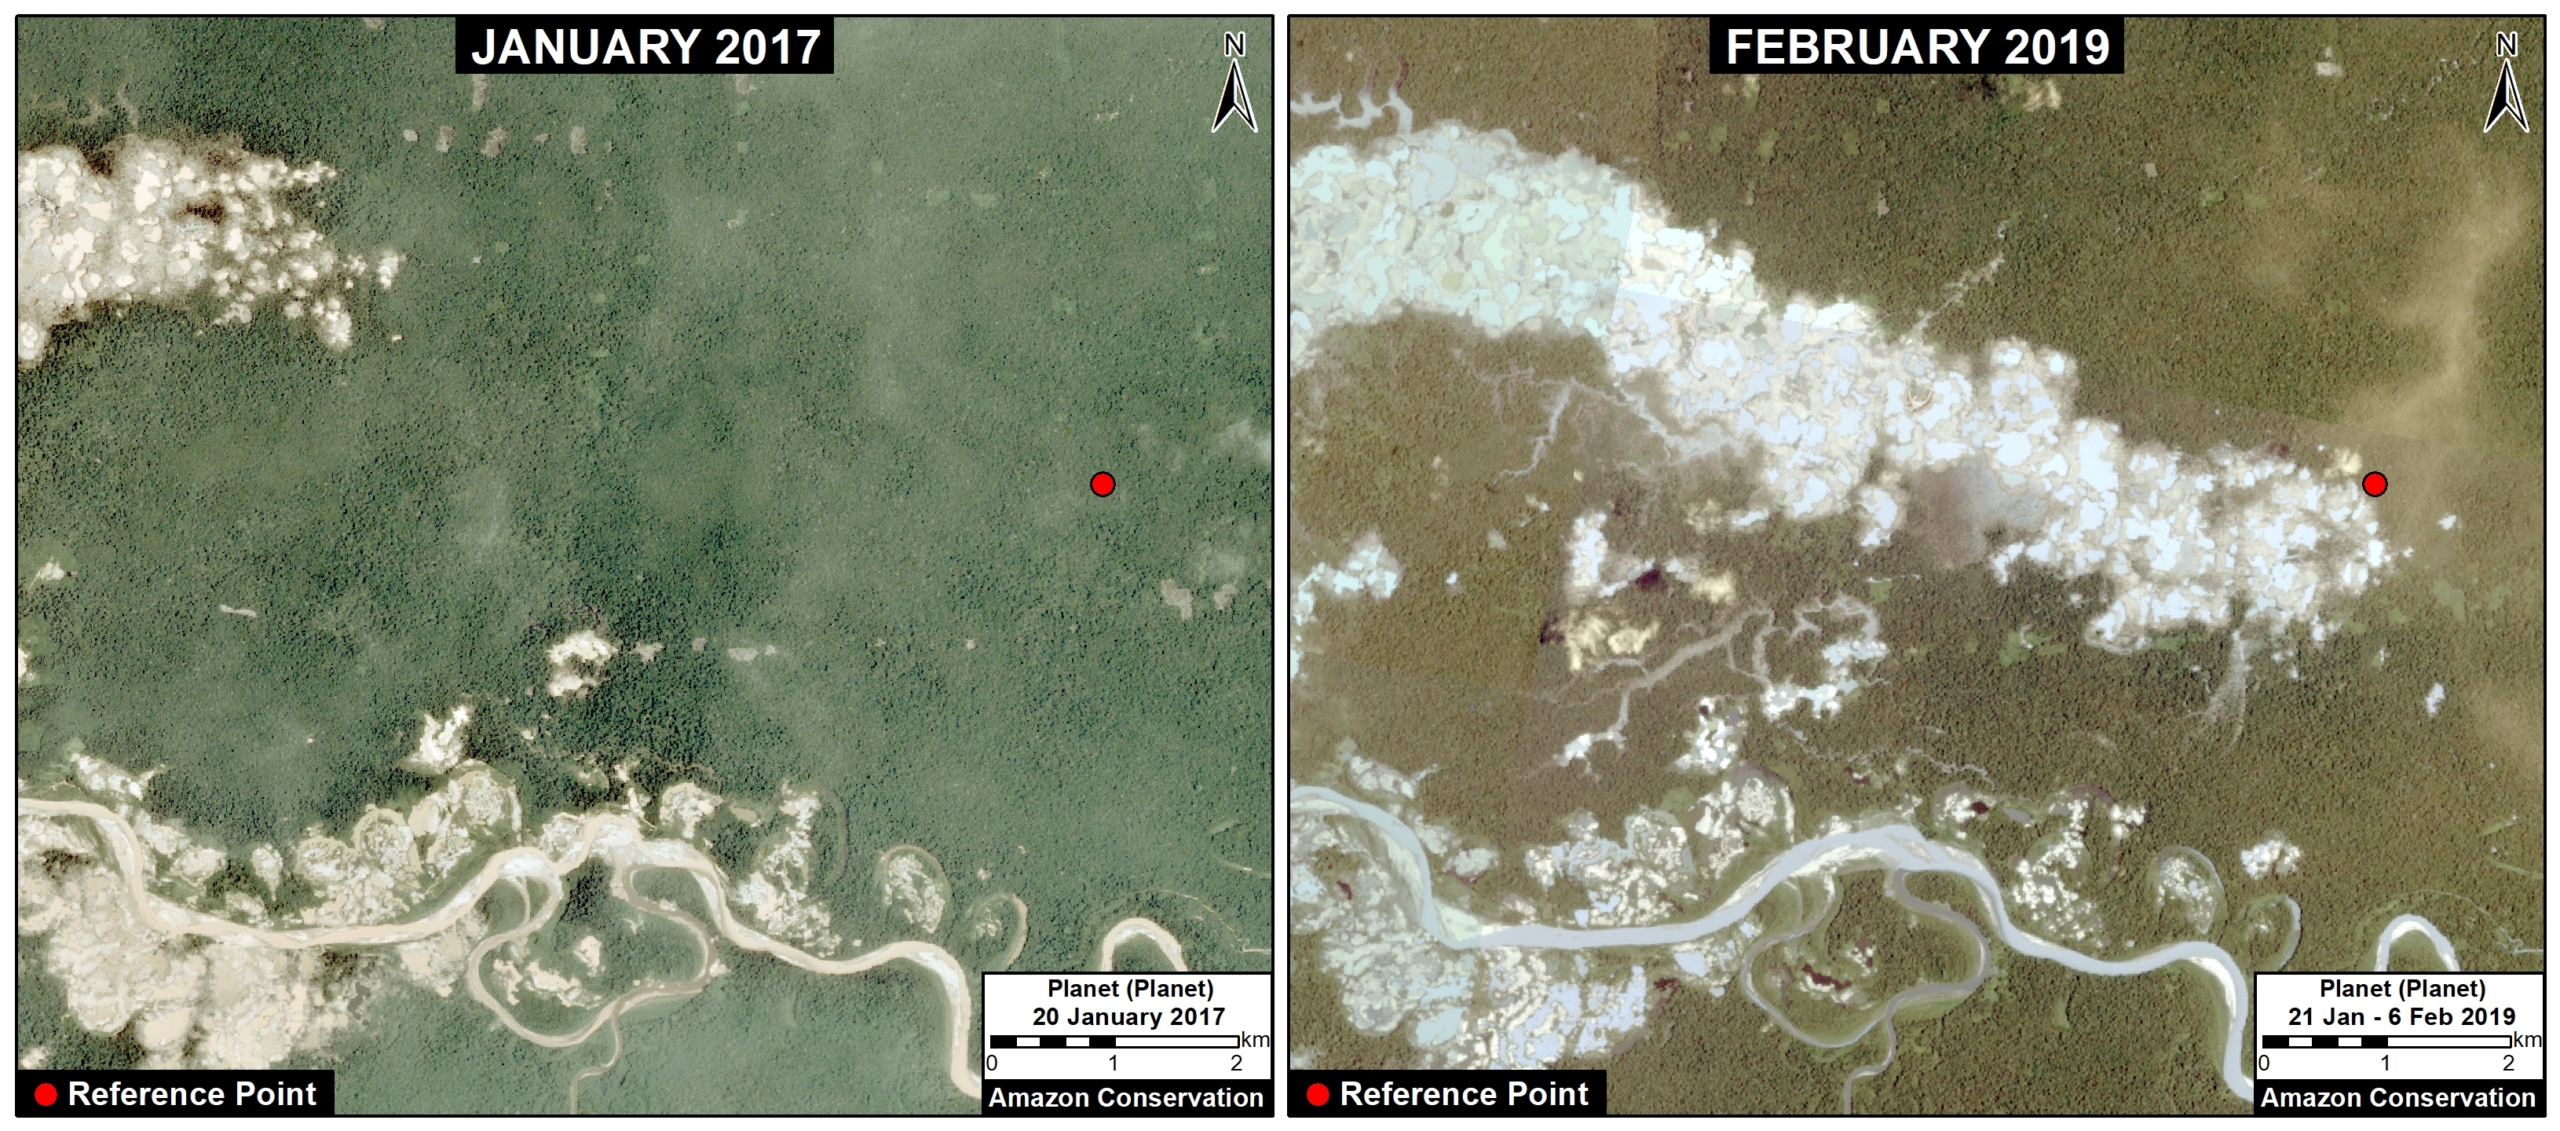
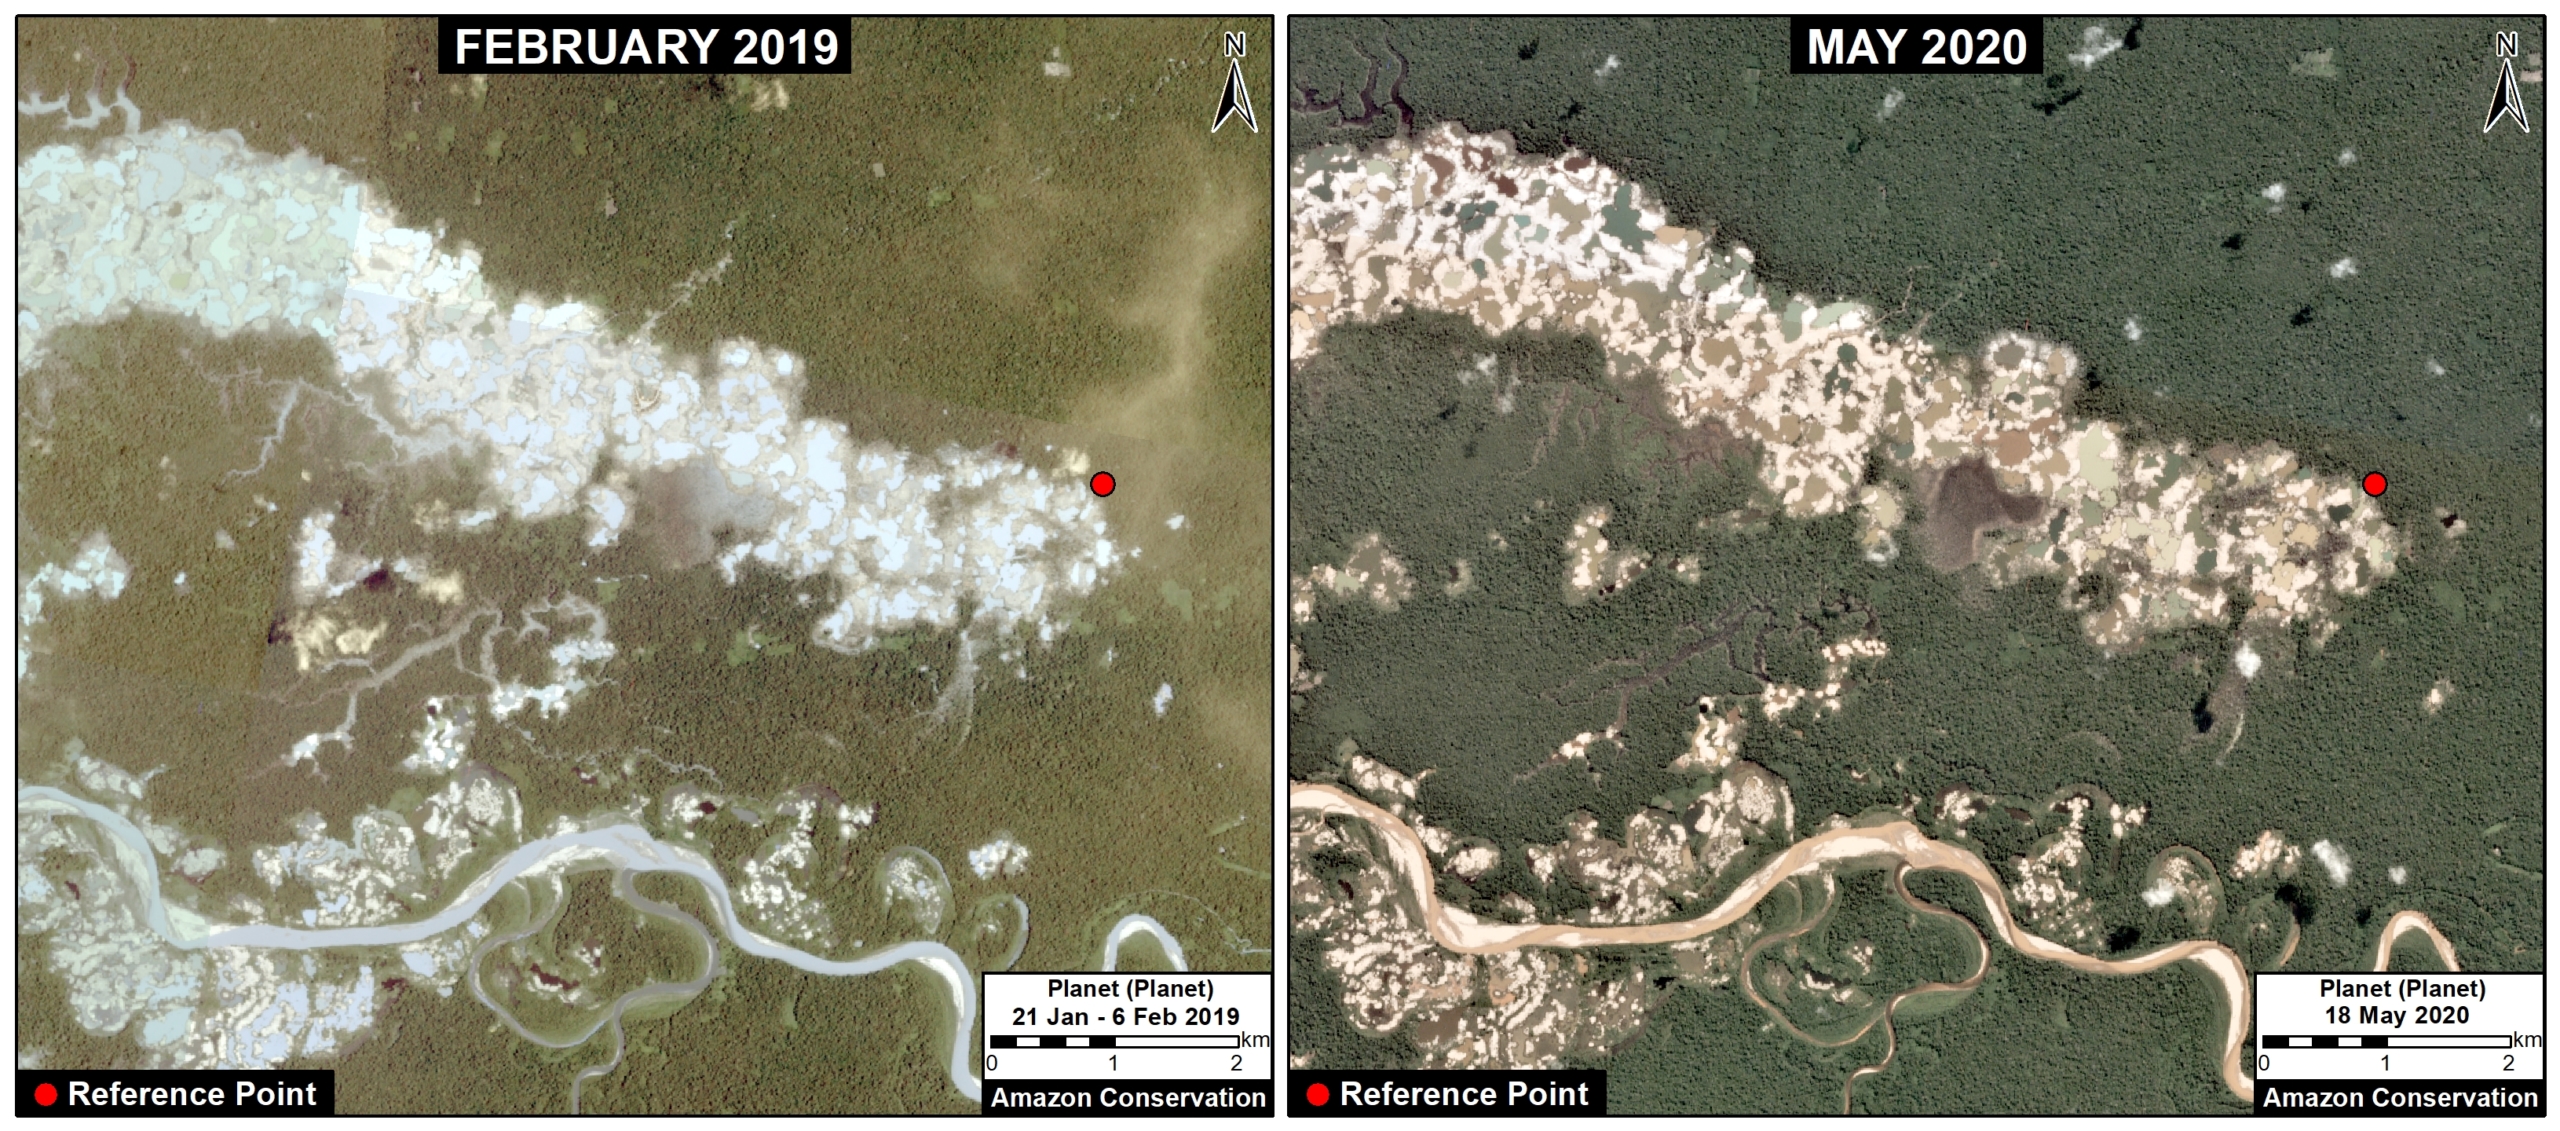
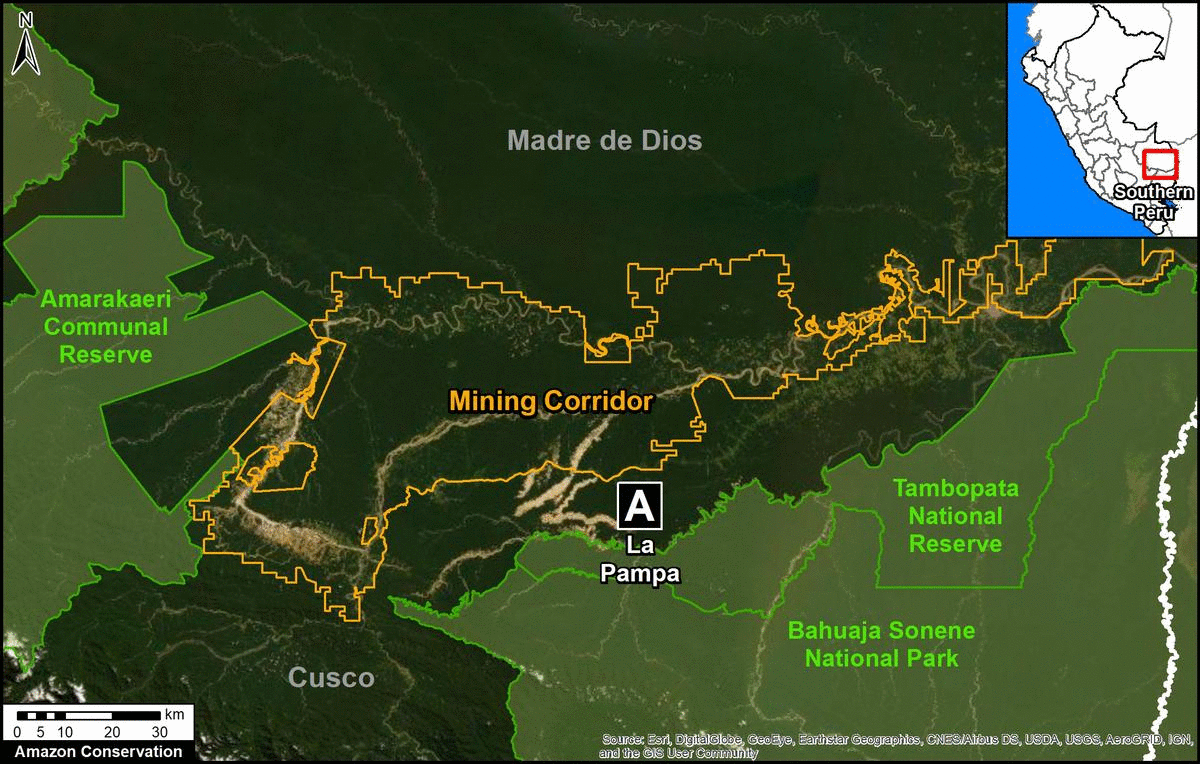
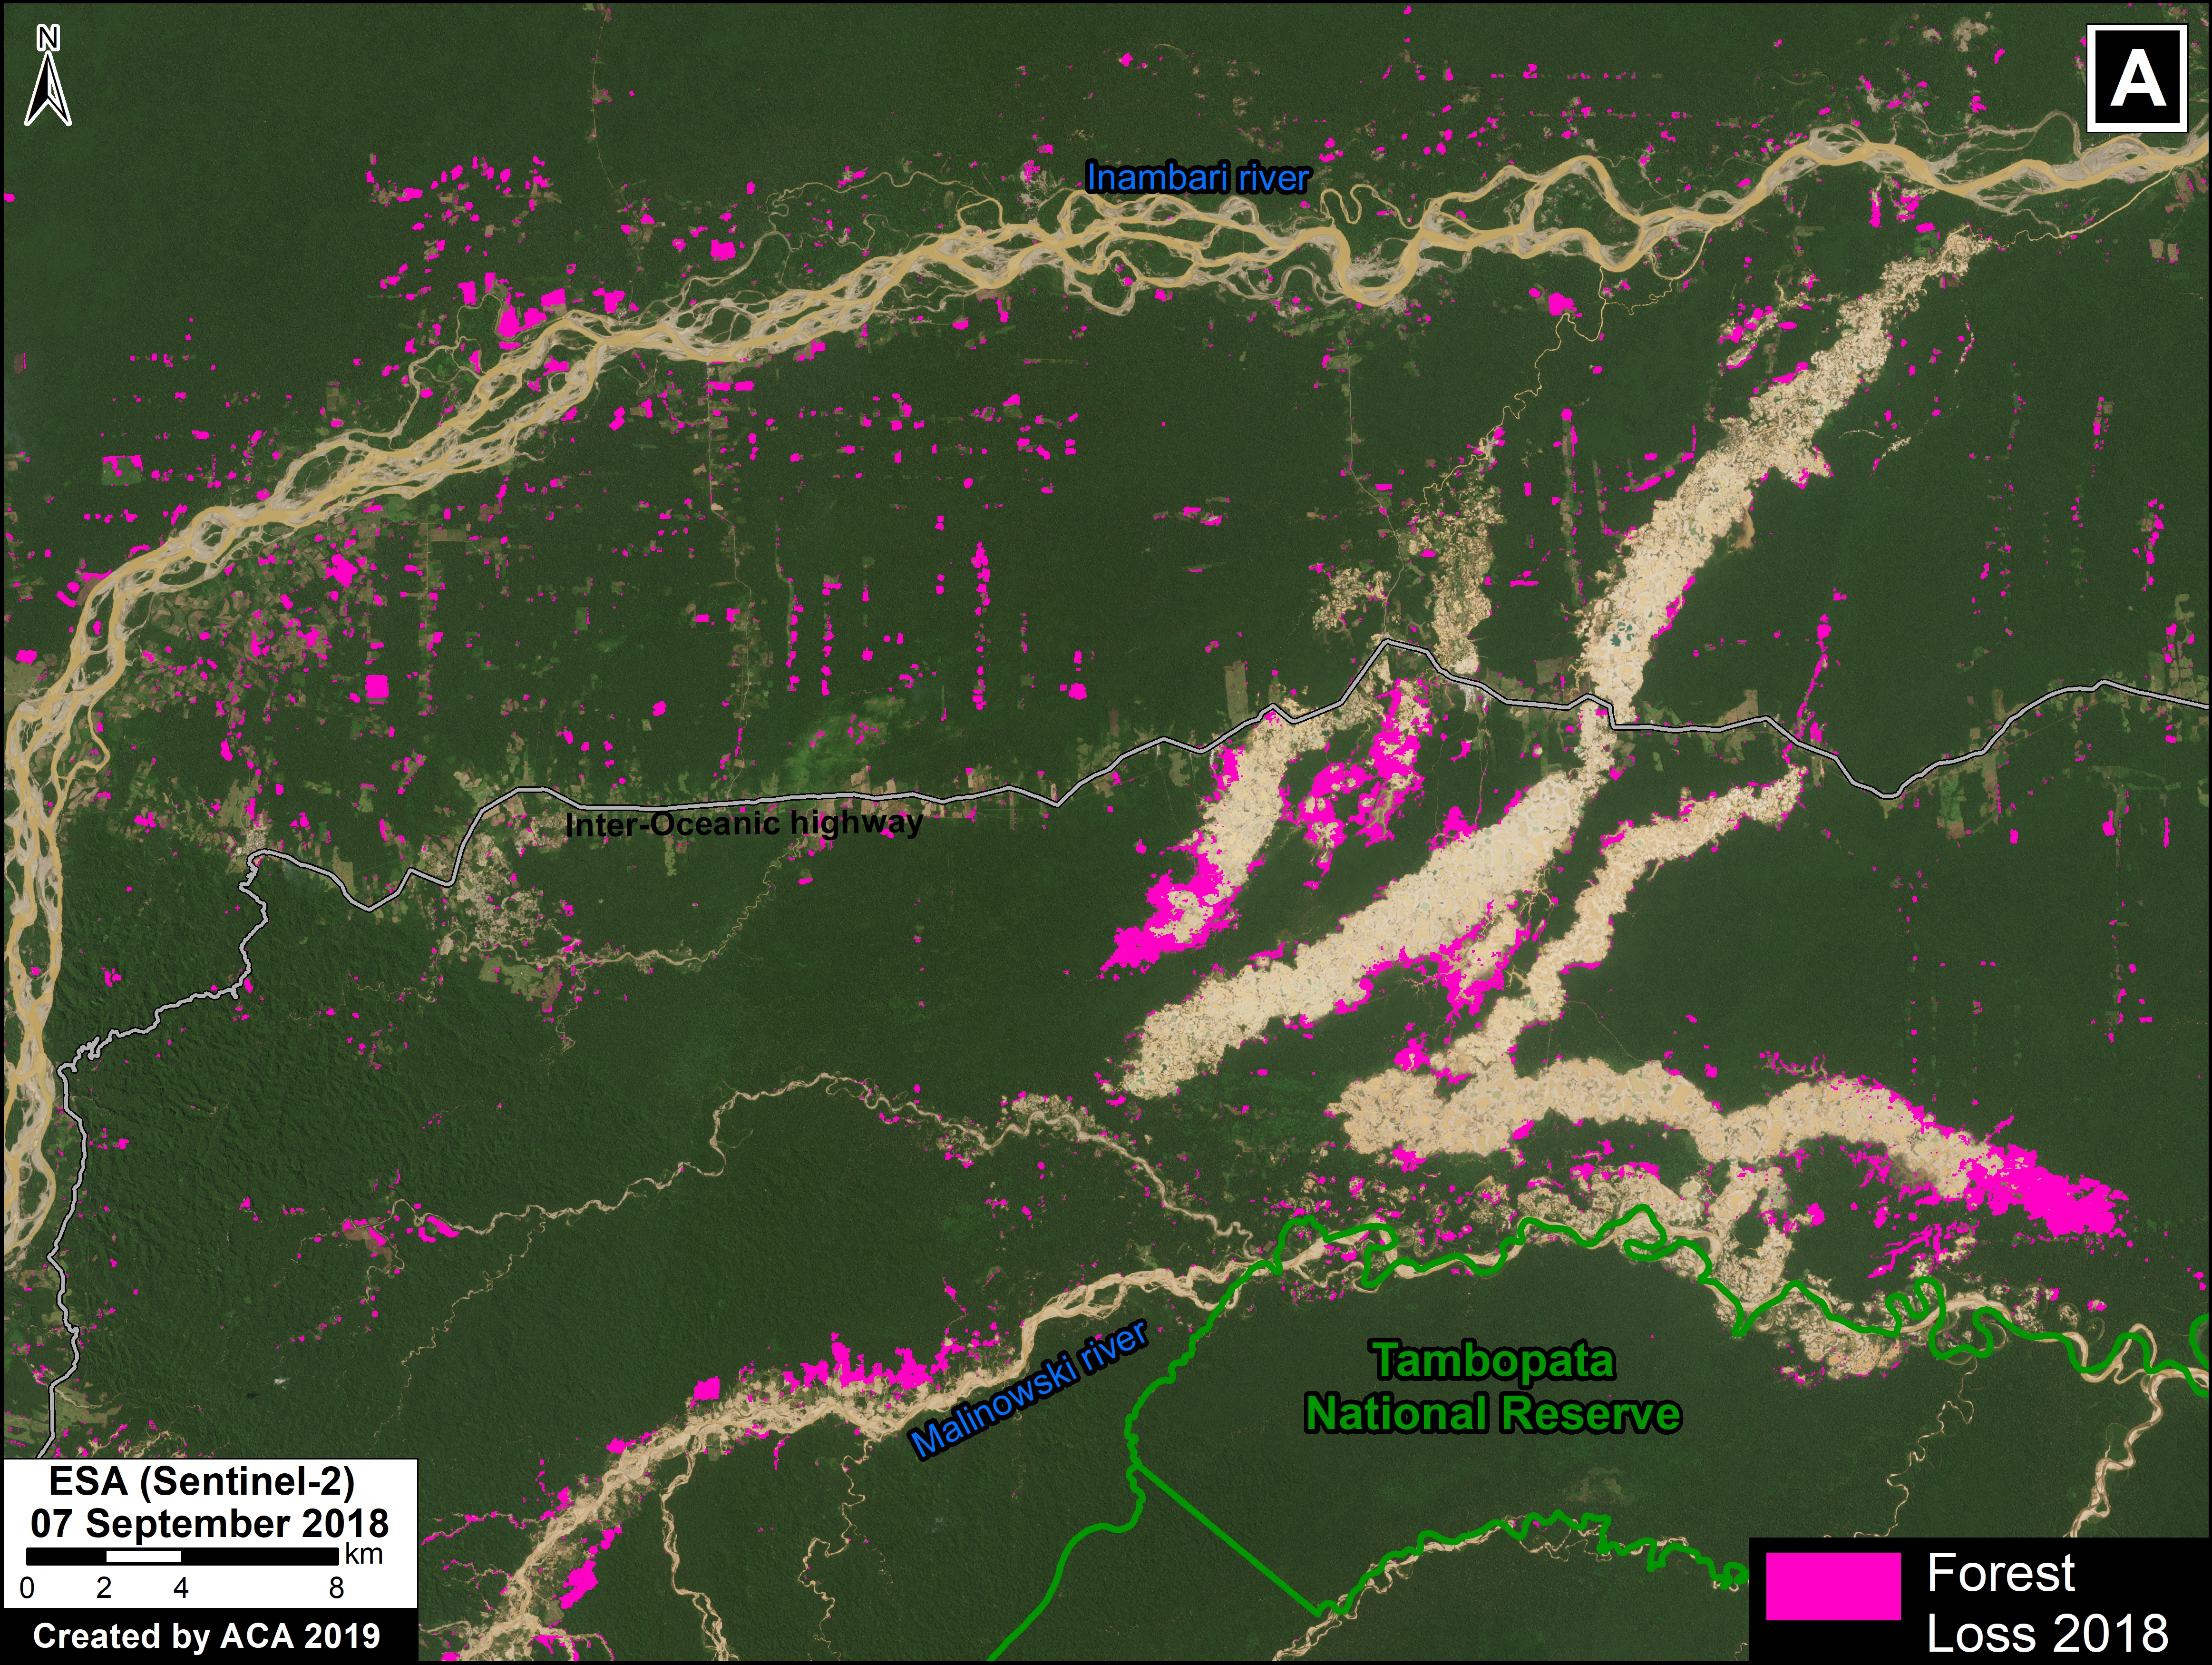
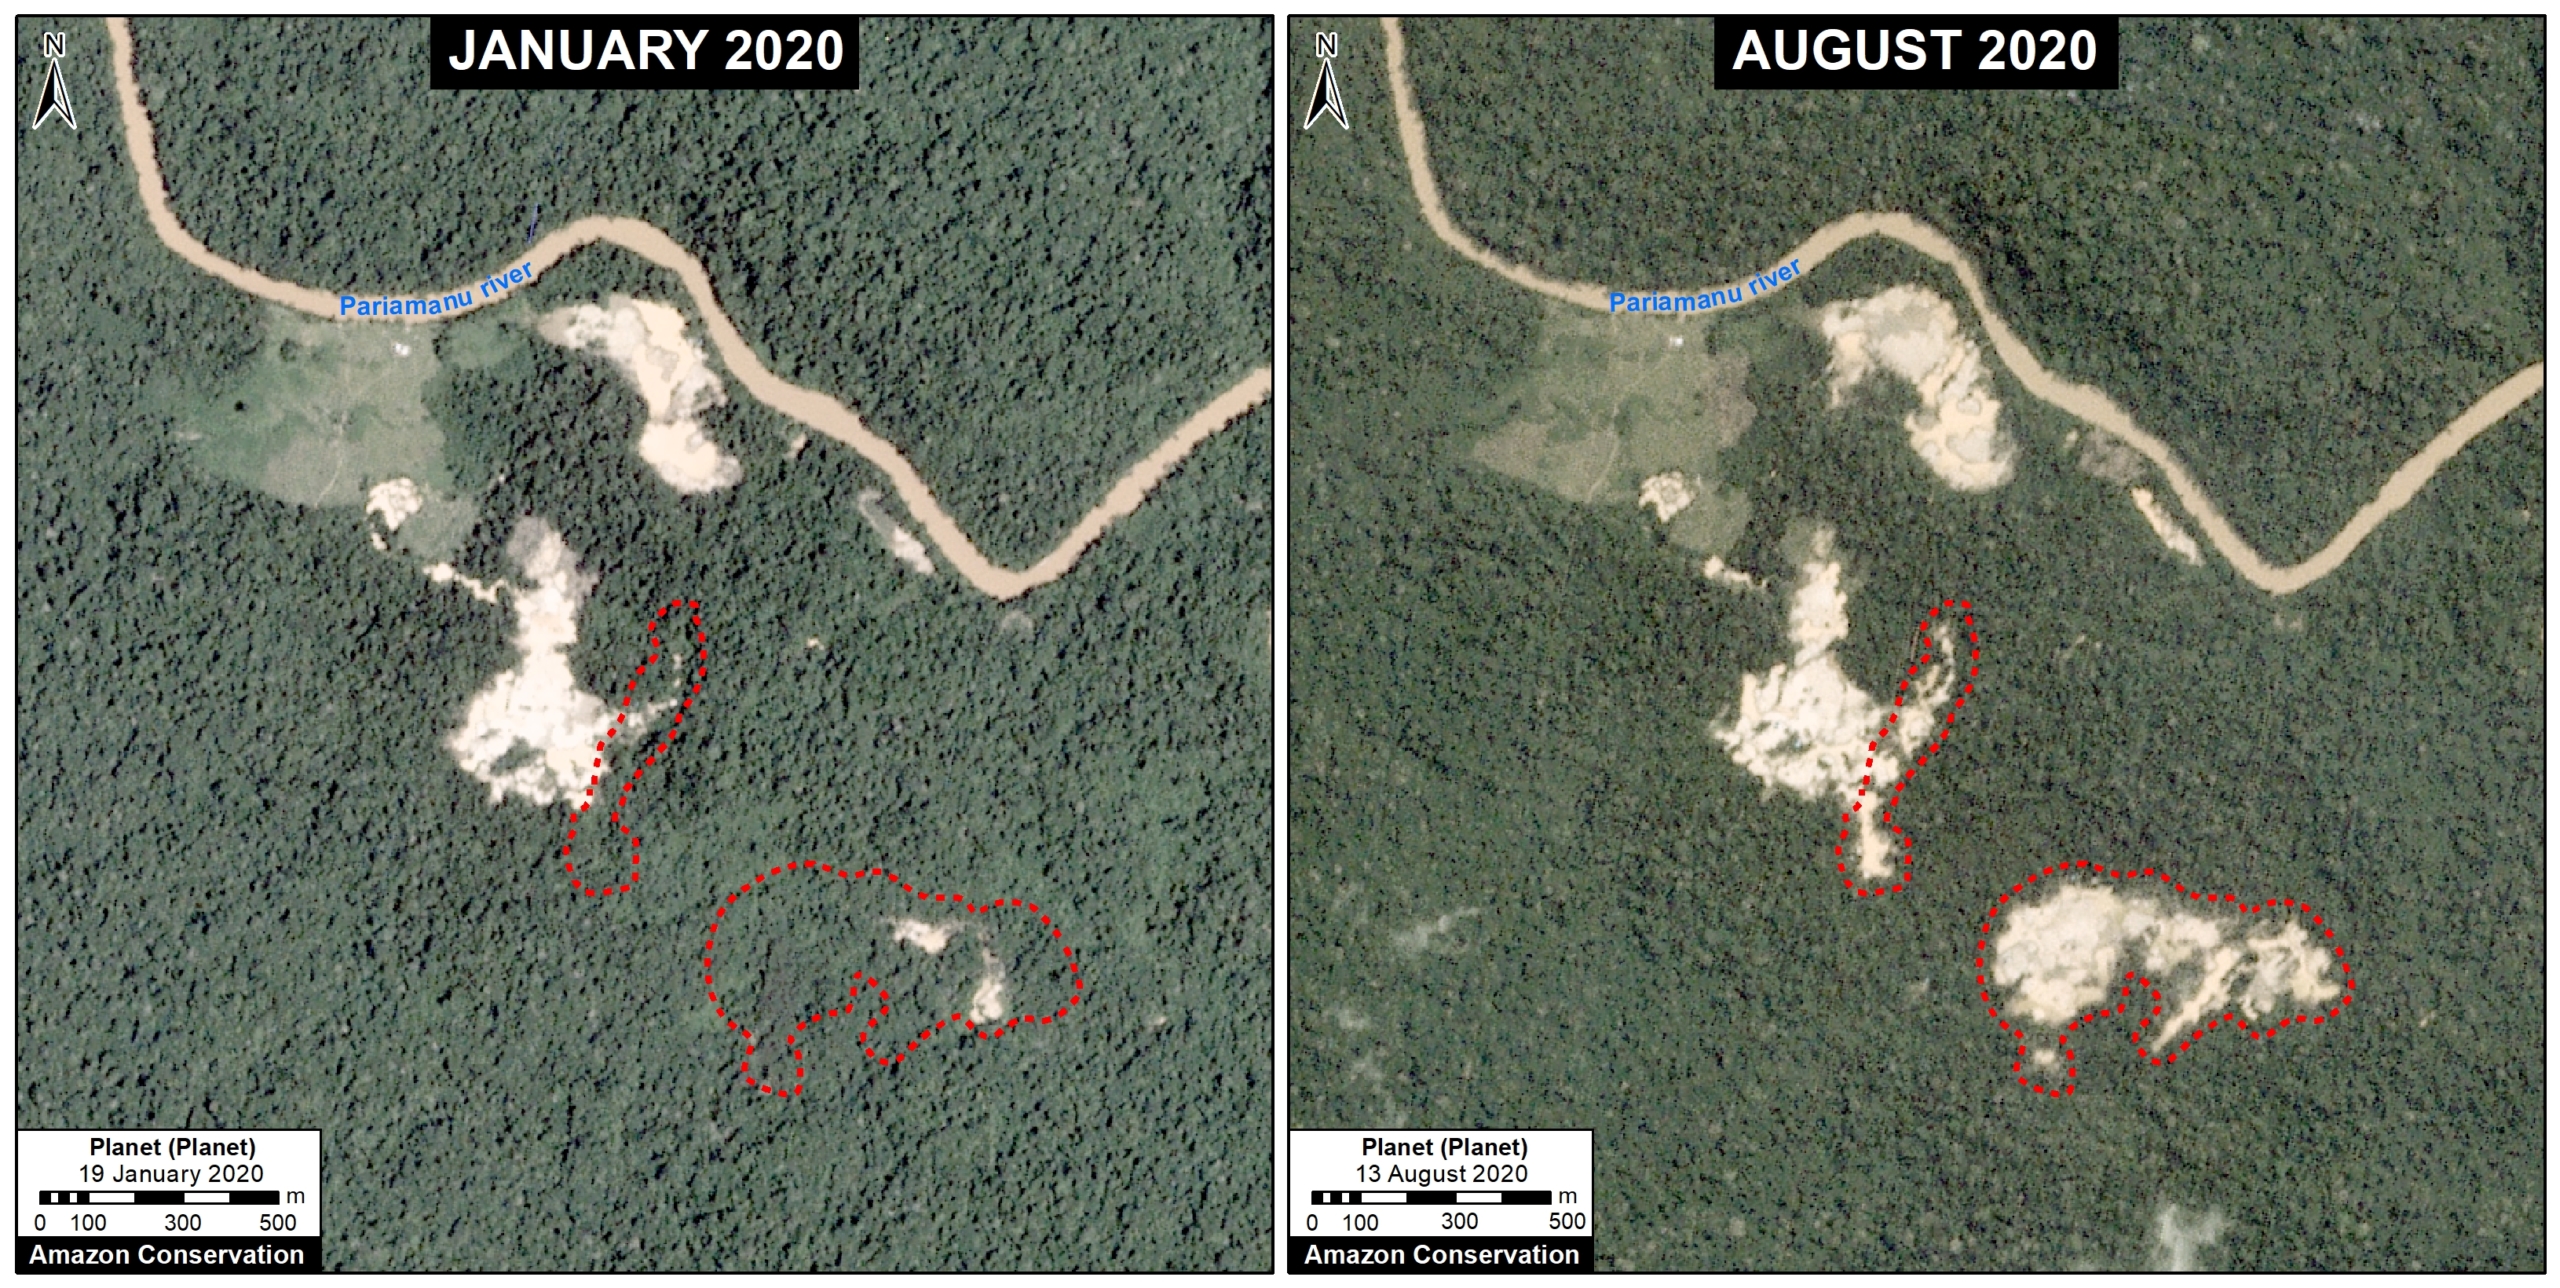
A. Pariamanu

The following image shows the gold mining deforestation of 52 acres (21 hectares) of primary forest along the Pariamanu River in the southern Peruvian Amazon (Madre de Dios region) between January (left panel) and August (right panel) of 2020. We highlight that the Peruvian government has just carried out an operation against the illegal mining activity in this area.
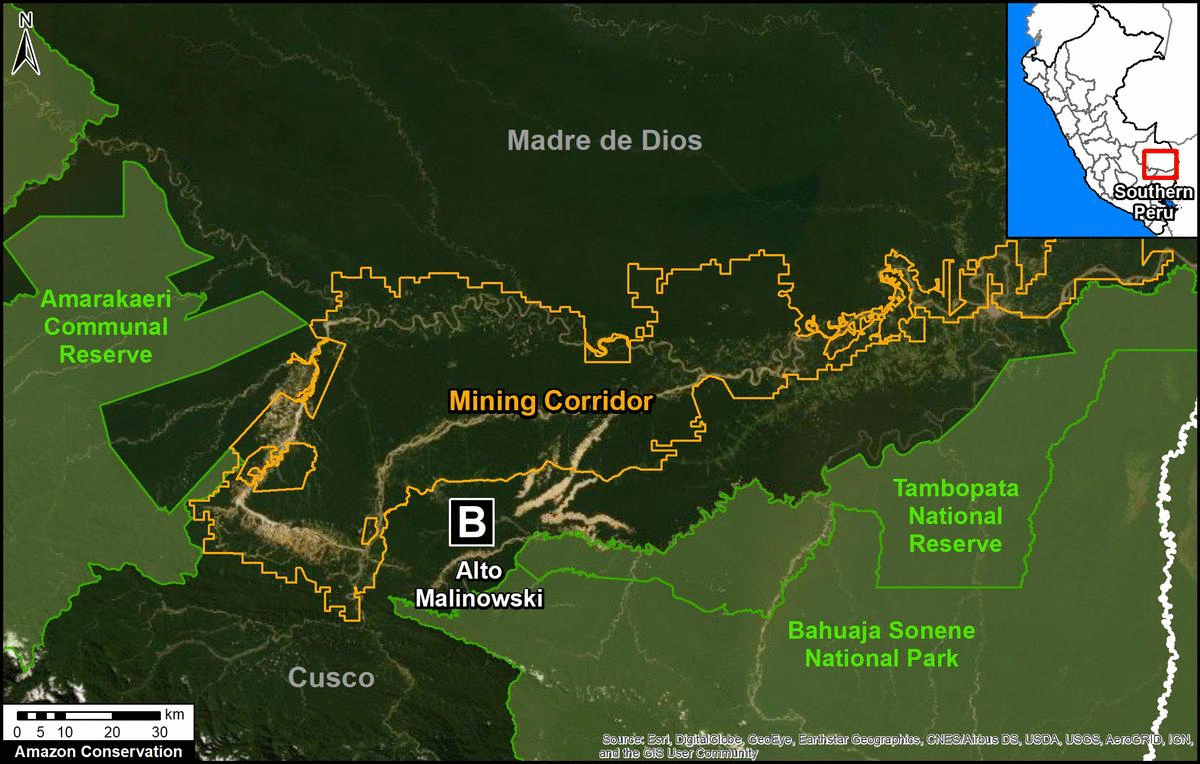
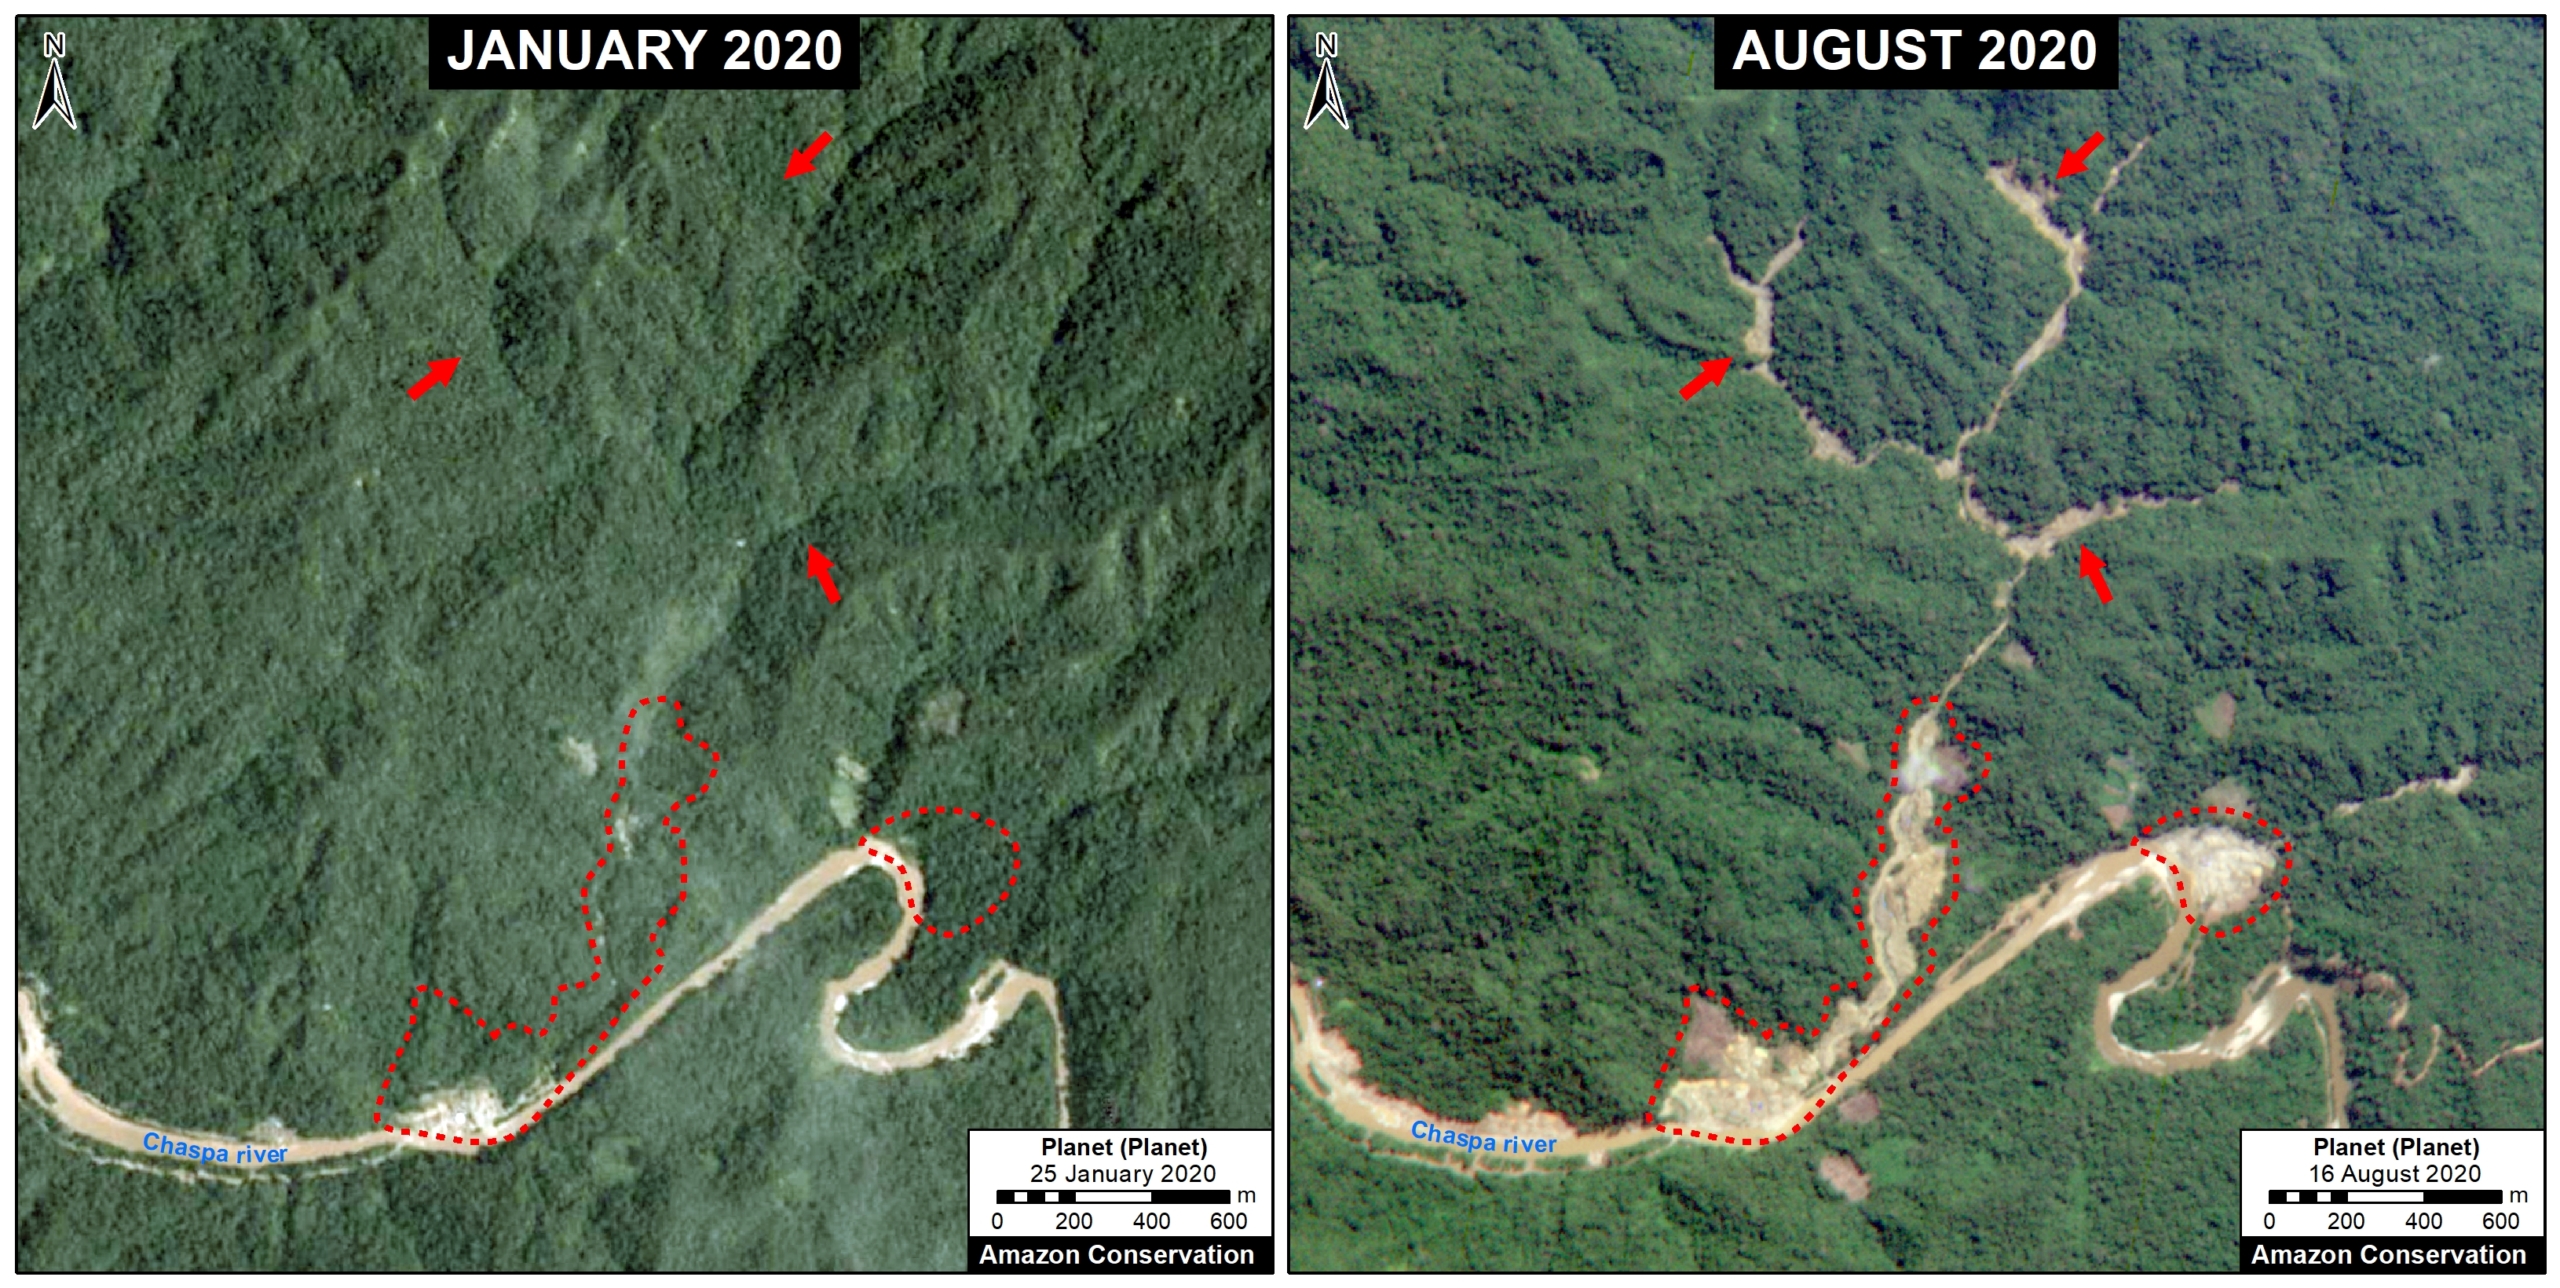
Pariamanu case (illegal gold mining). Data: Planet, MAAP.

B. Araza

The following image shows the gold mining deforestation of 114 acres (46 hectares) along the Chaspa River in the Puno region, between January (left panel) and August (right panel) of 2020.

Araza case. Data: Planet, MAAP.

2. Large-scale Agriculture

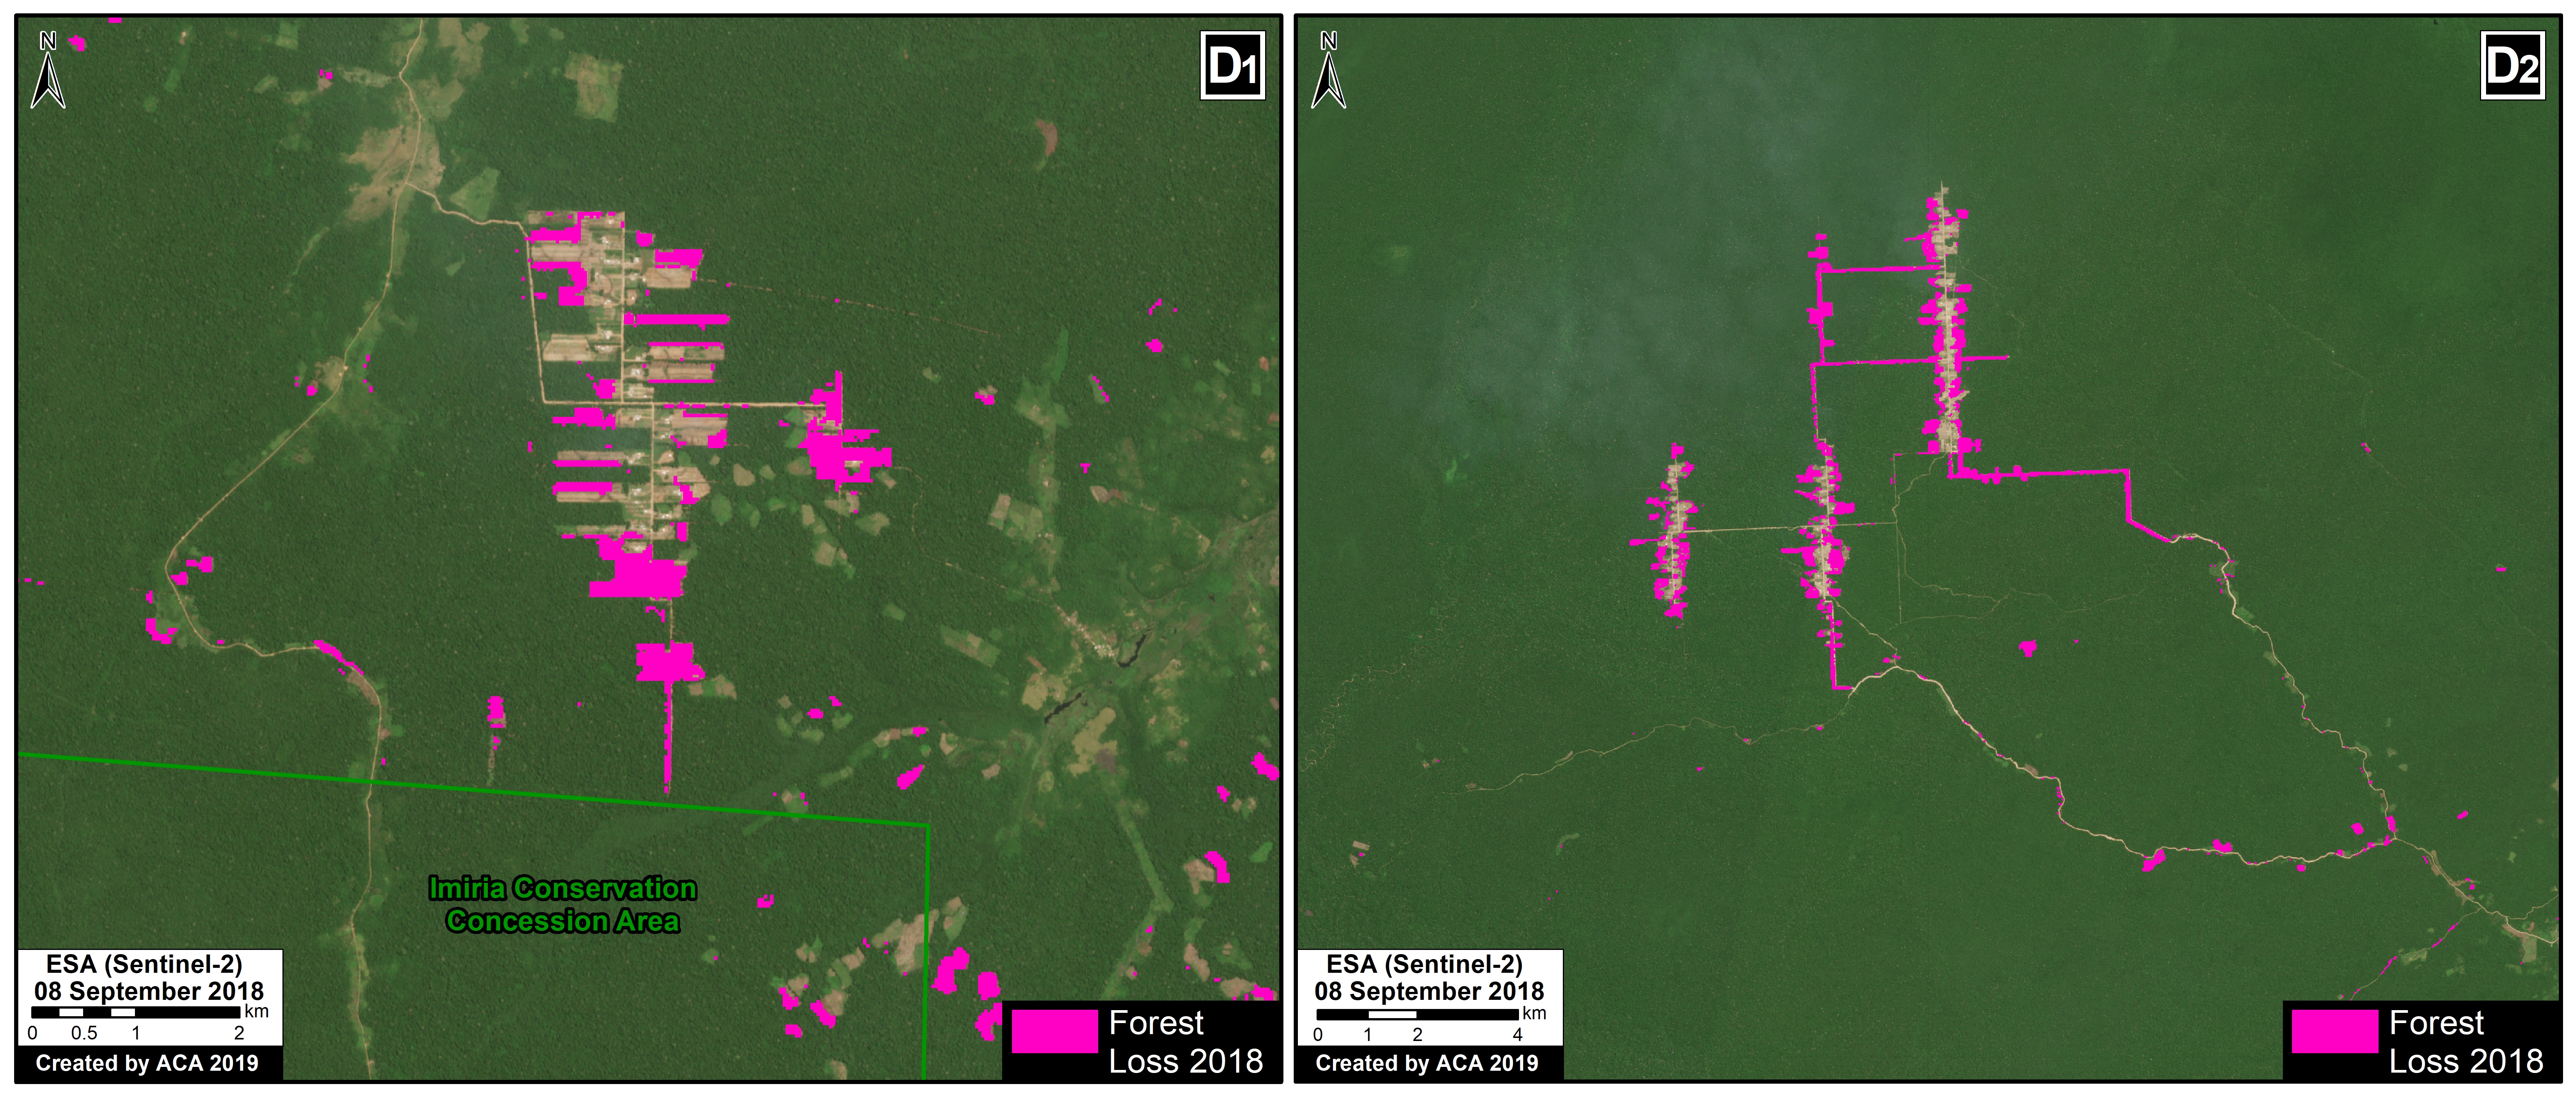
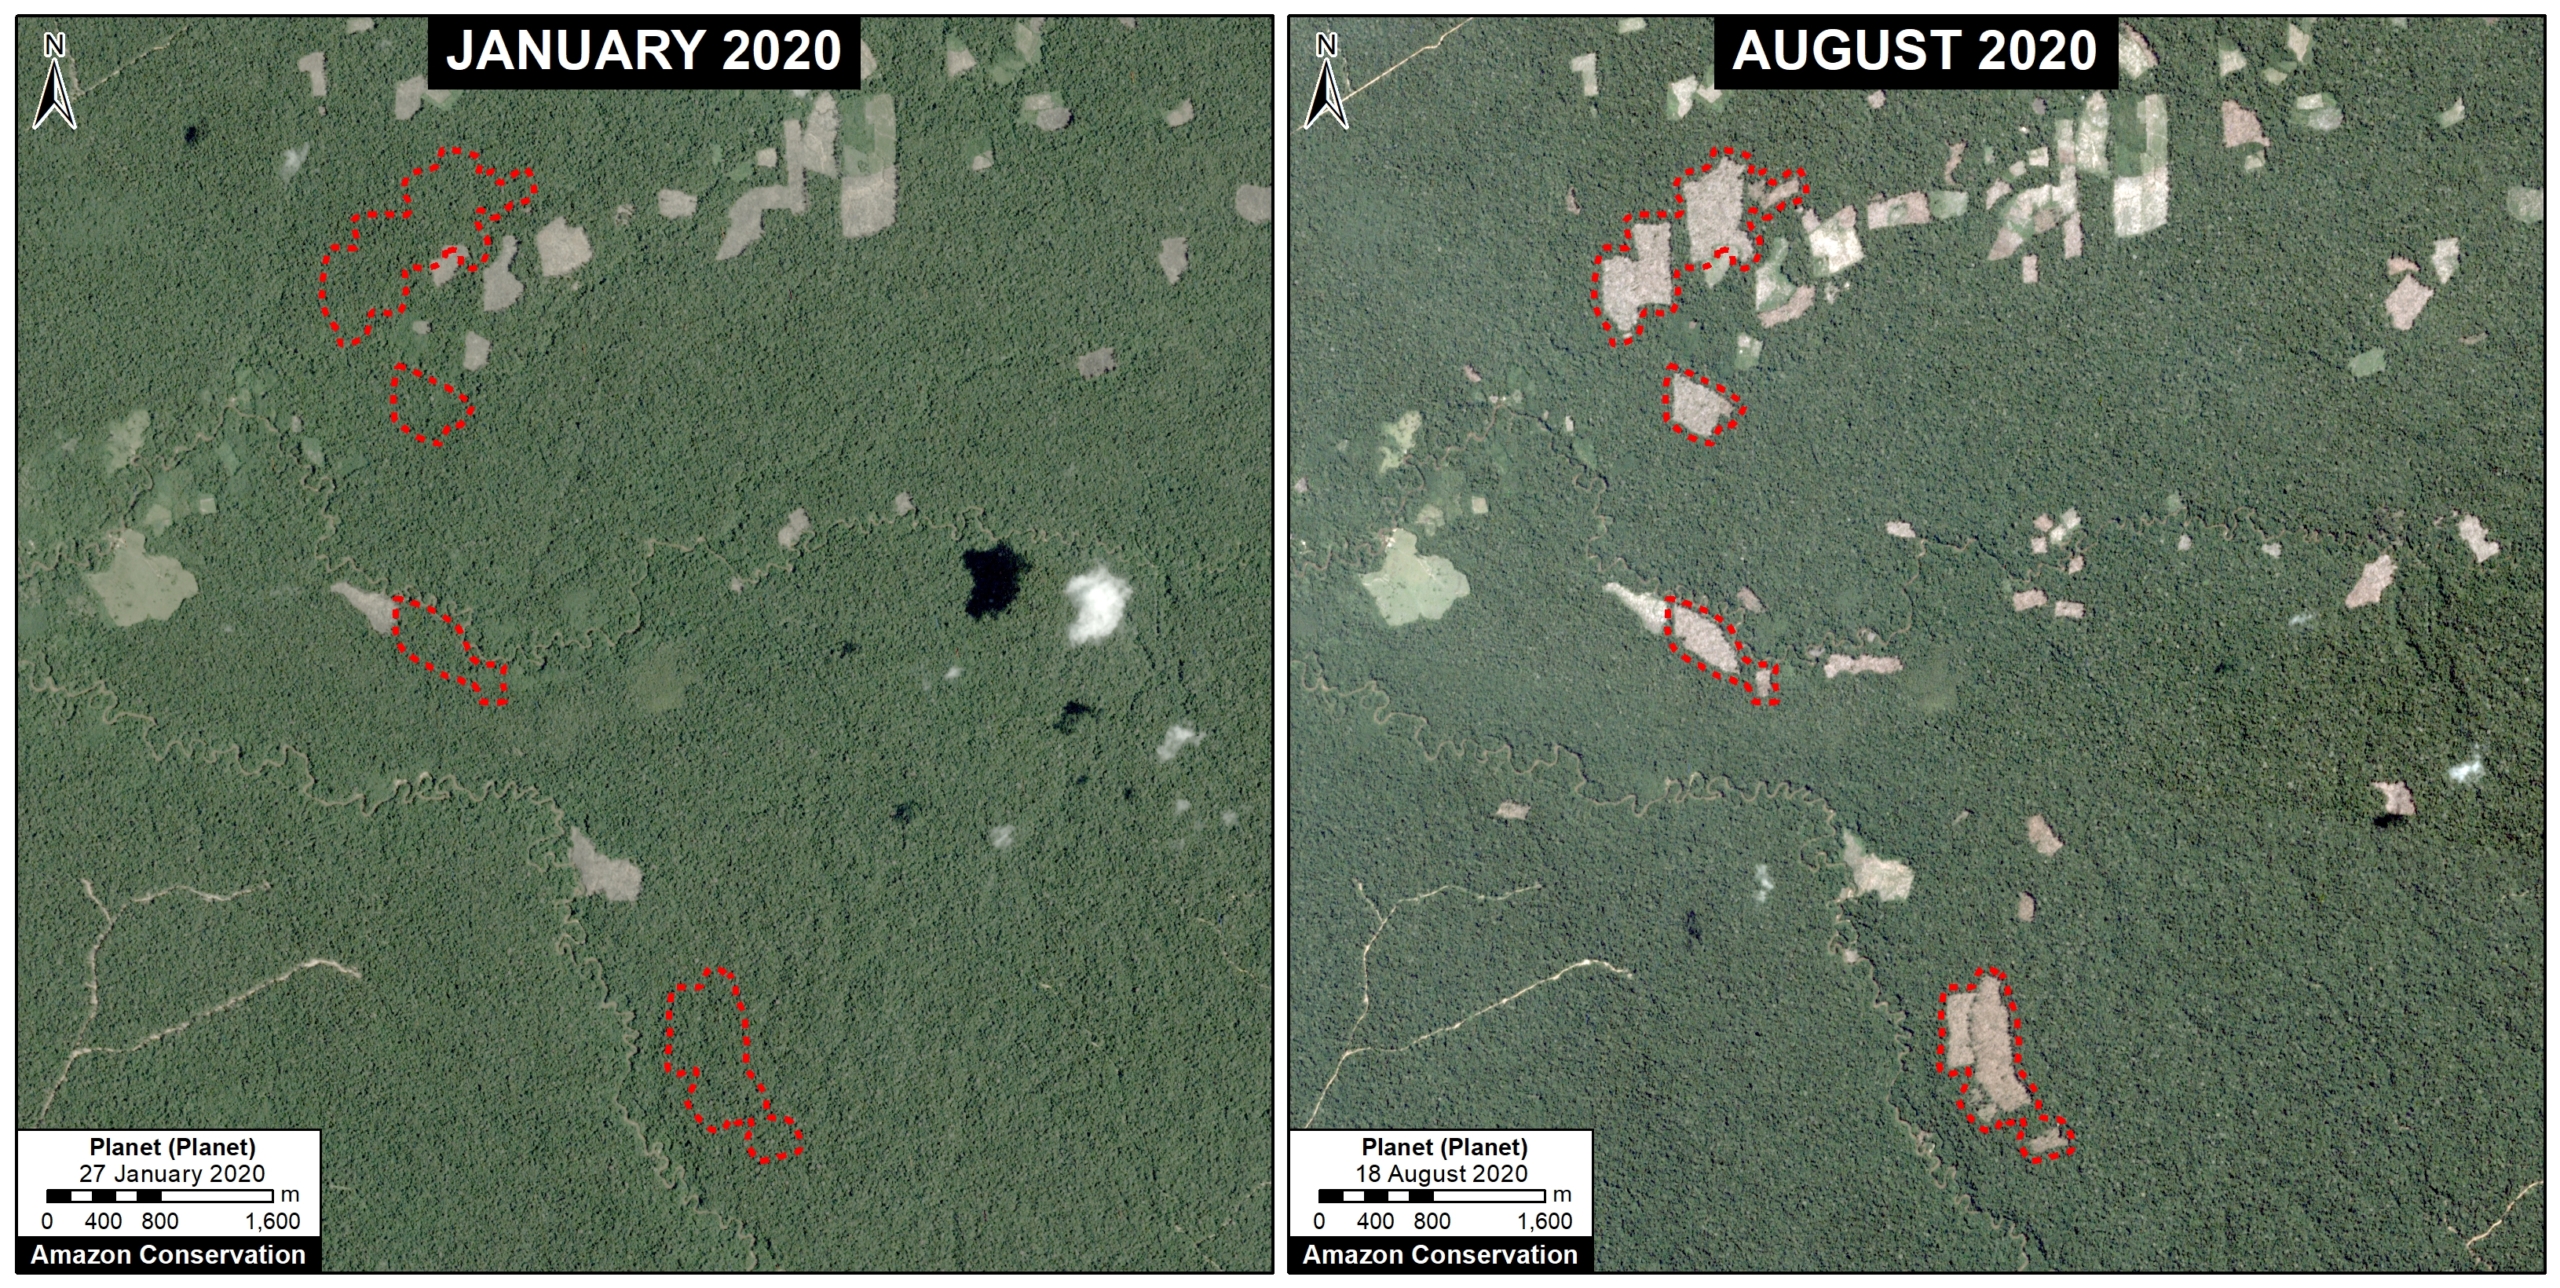
C. Mennonite Colony (near Tierra Blanca)

We reported last year that a new colony of Mennonites caused the deforestation of 4,200 acres (1,700 hectares) between 2017 and 2019 in the Loreto region (MAAP #112). The following image shows the additional deforestation of 820 acres (332 hectares) in 2020 between January (left panel) and August (right panel).

Mennonite case (near Tierra Blanca). Data: Planet, MAAP.

3. Small-scale Agriculture
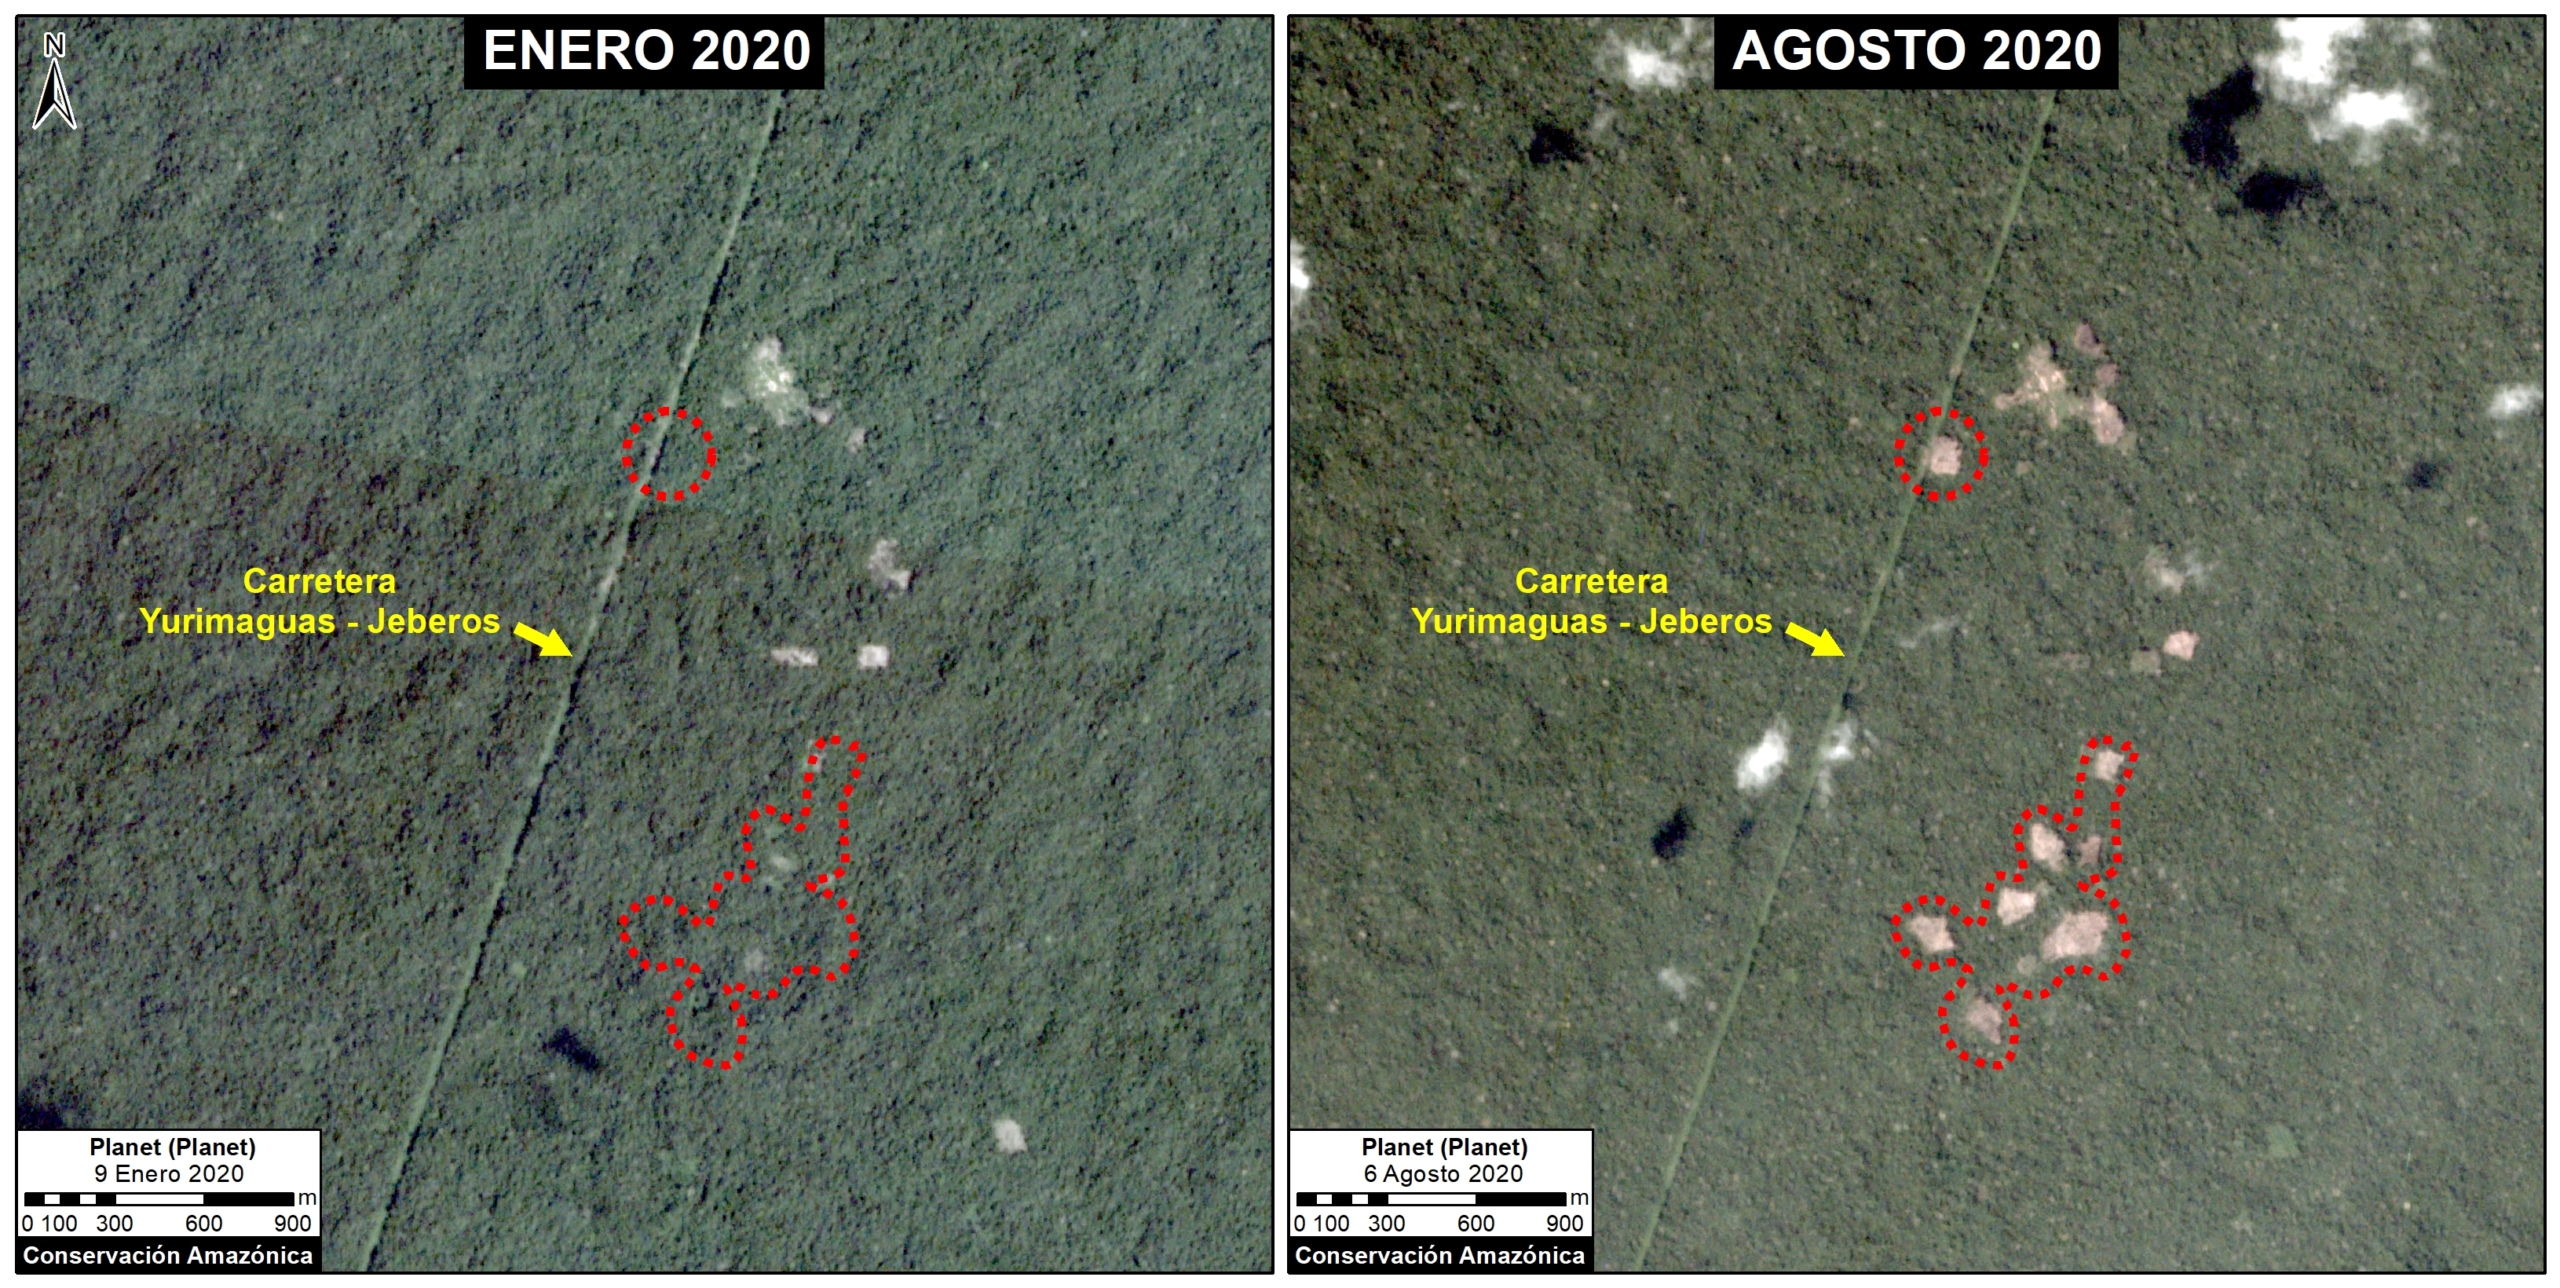
D. Jeberos

In 2018, we reported on the construction of a new road (65 km) cutting through primary forest in the Loreto region, between the city of Yurimaguas and the town of Jeberos (MAAP #84). The following image shows the deforestation of 40 acres (16 hectares) along the new road in 2020, between January (left panel) and August (right panel).
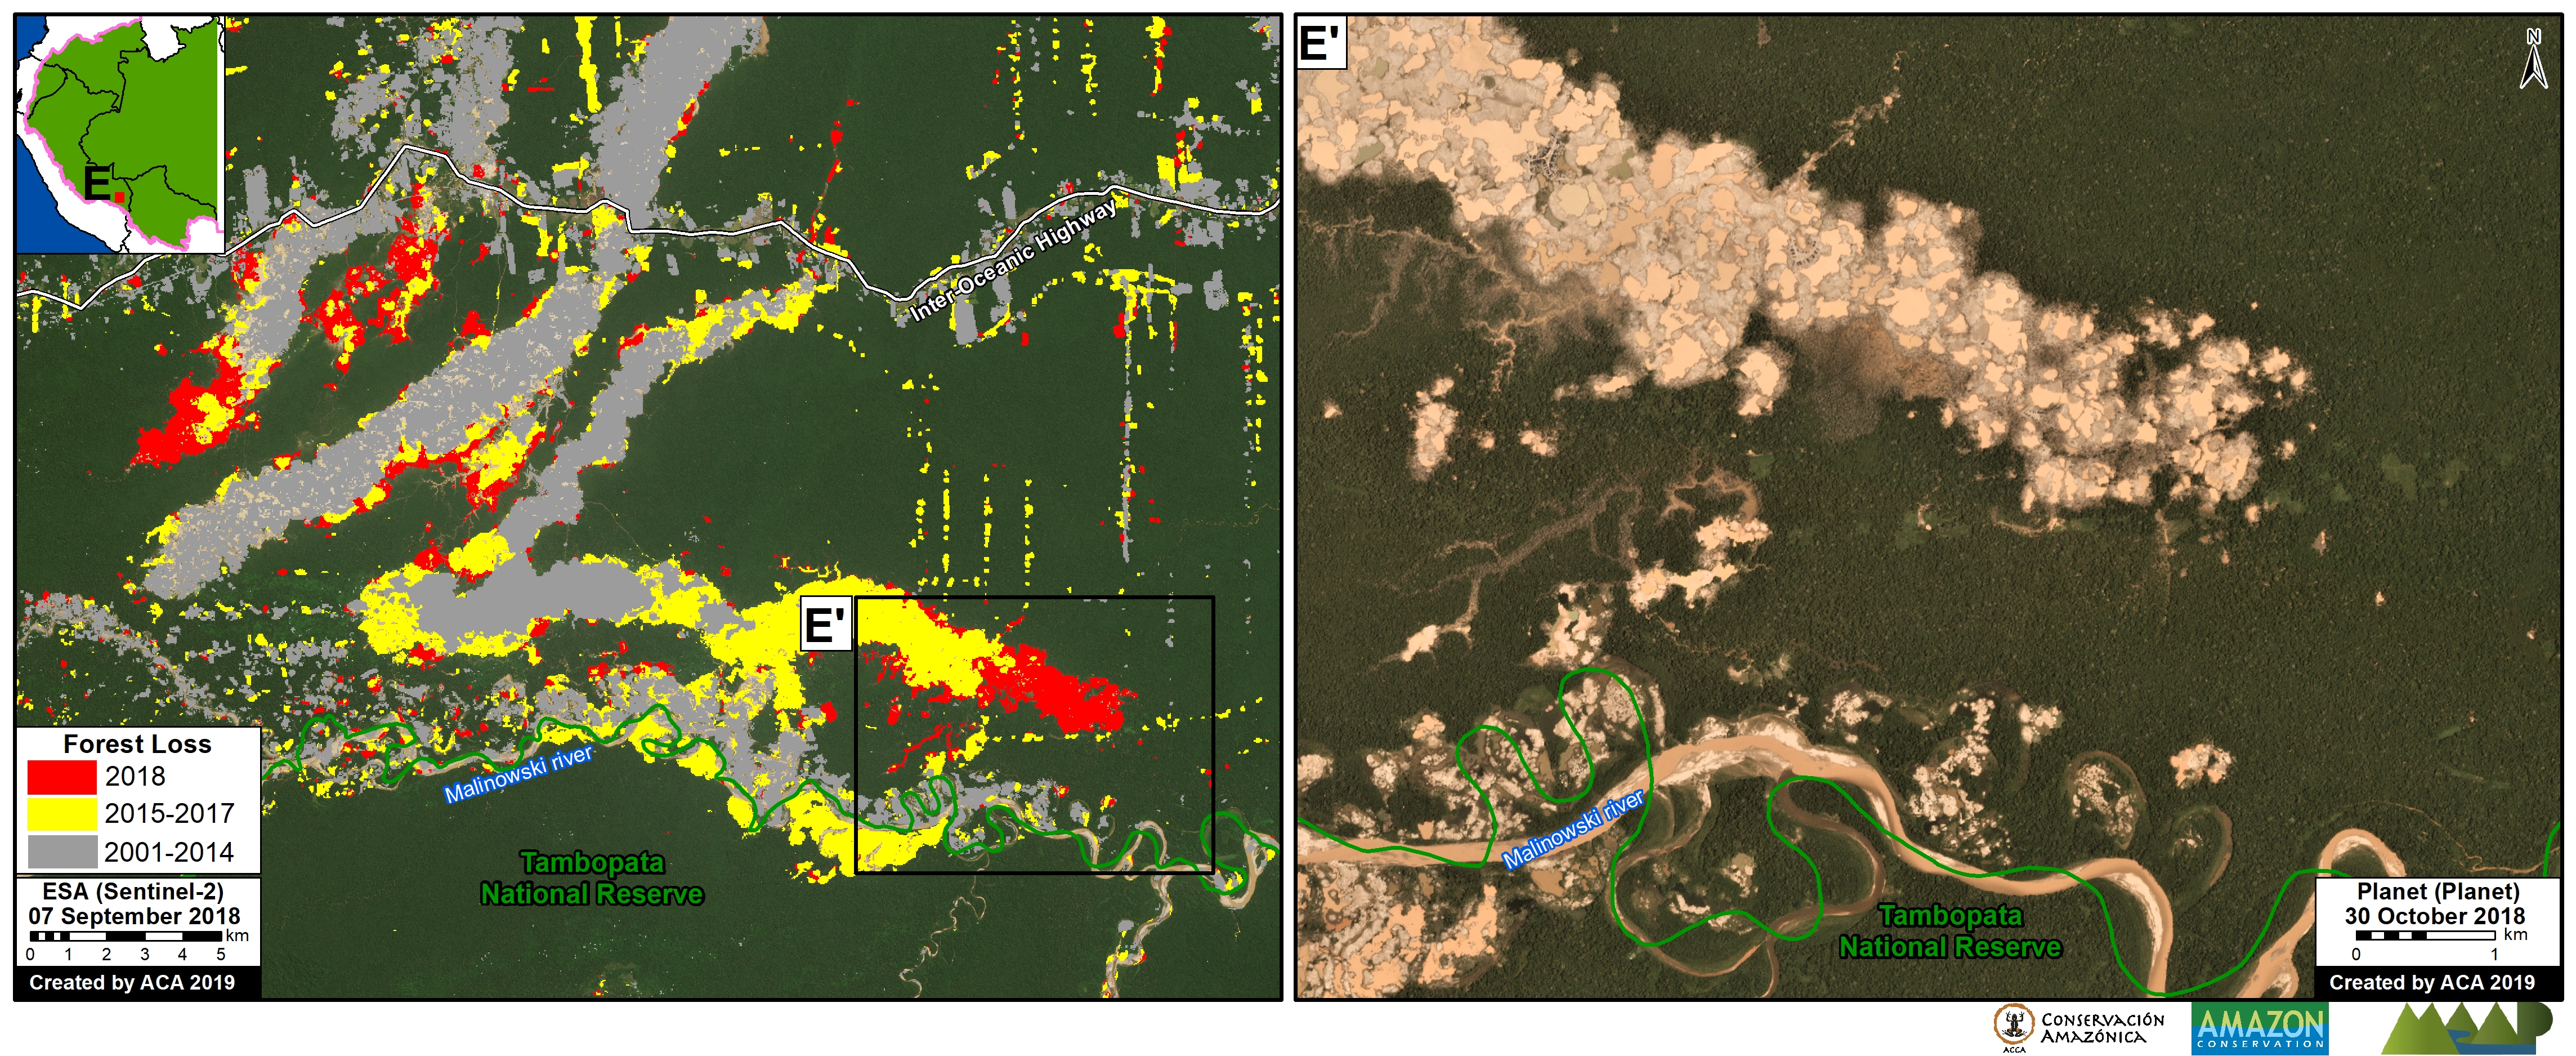
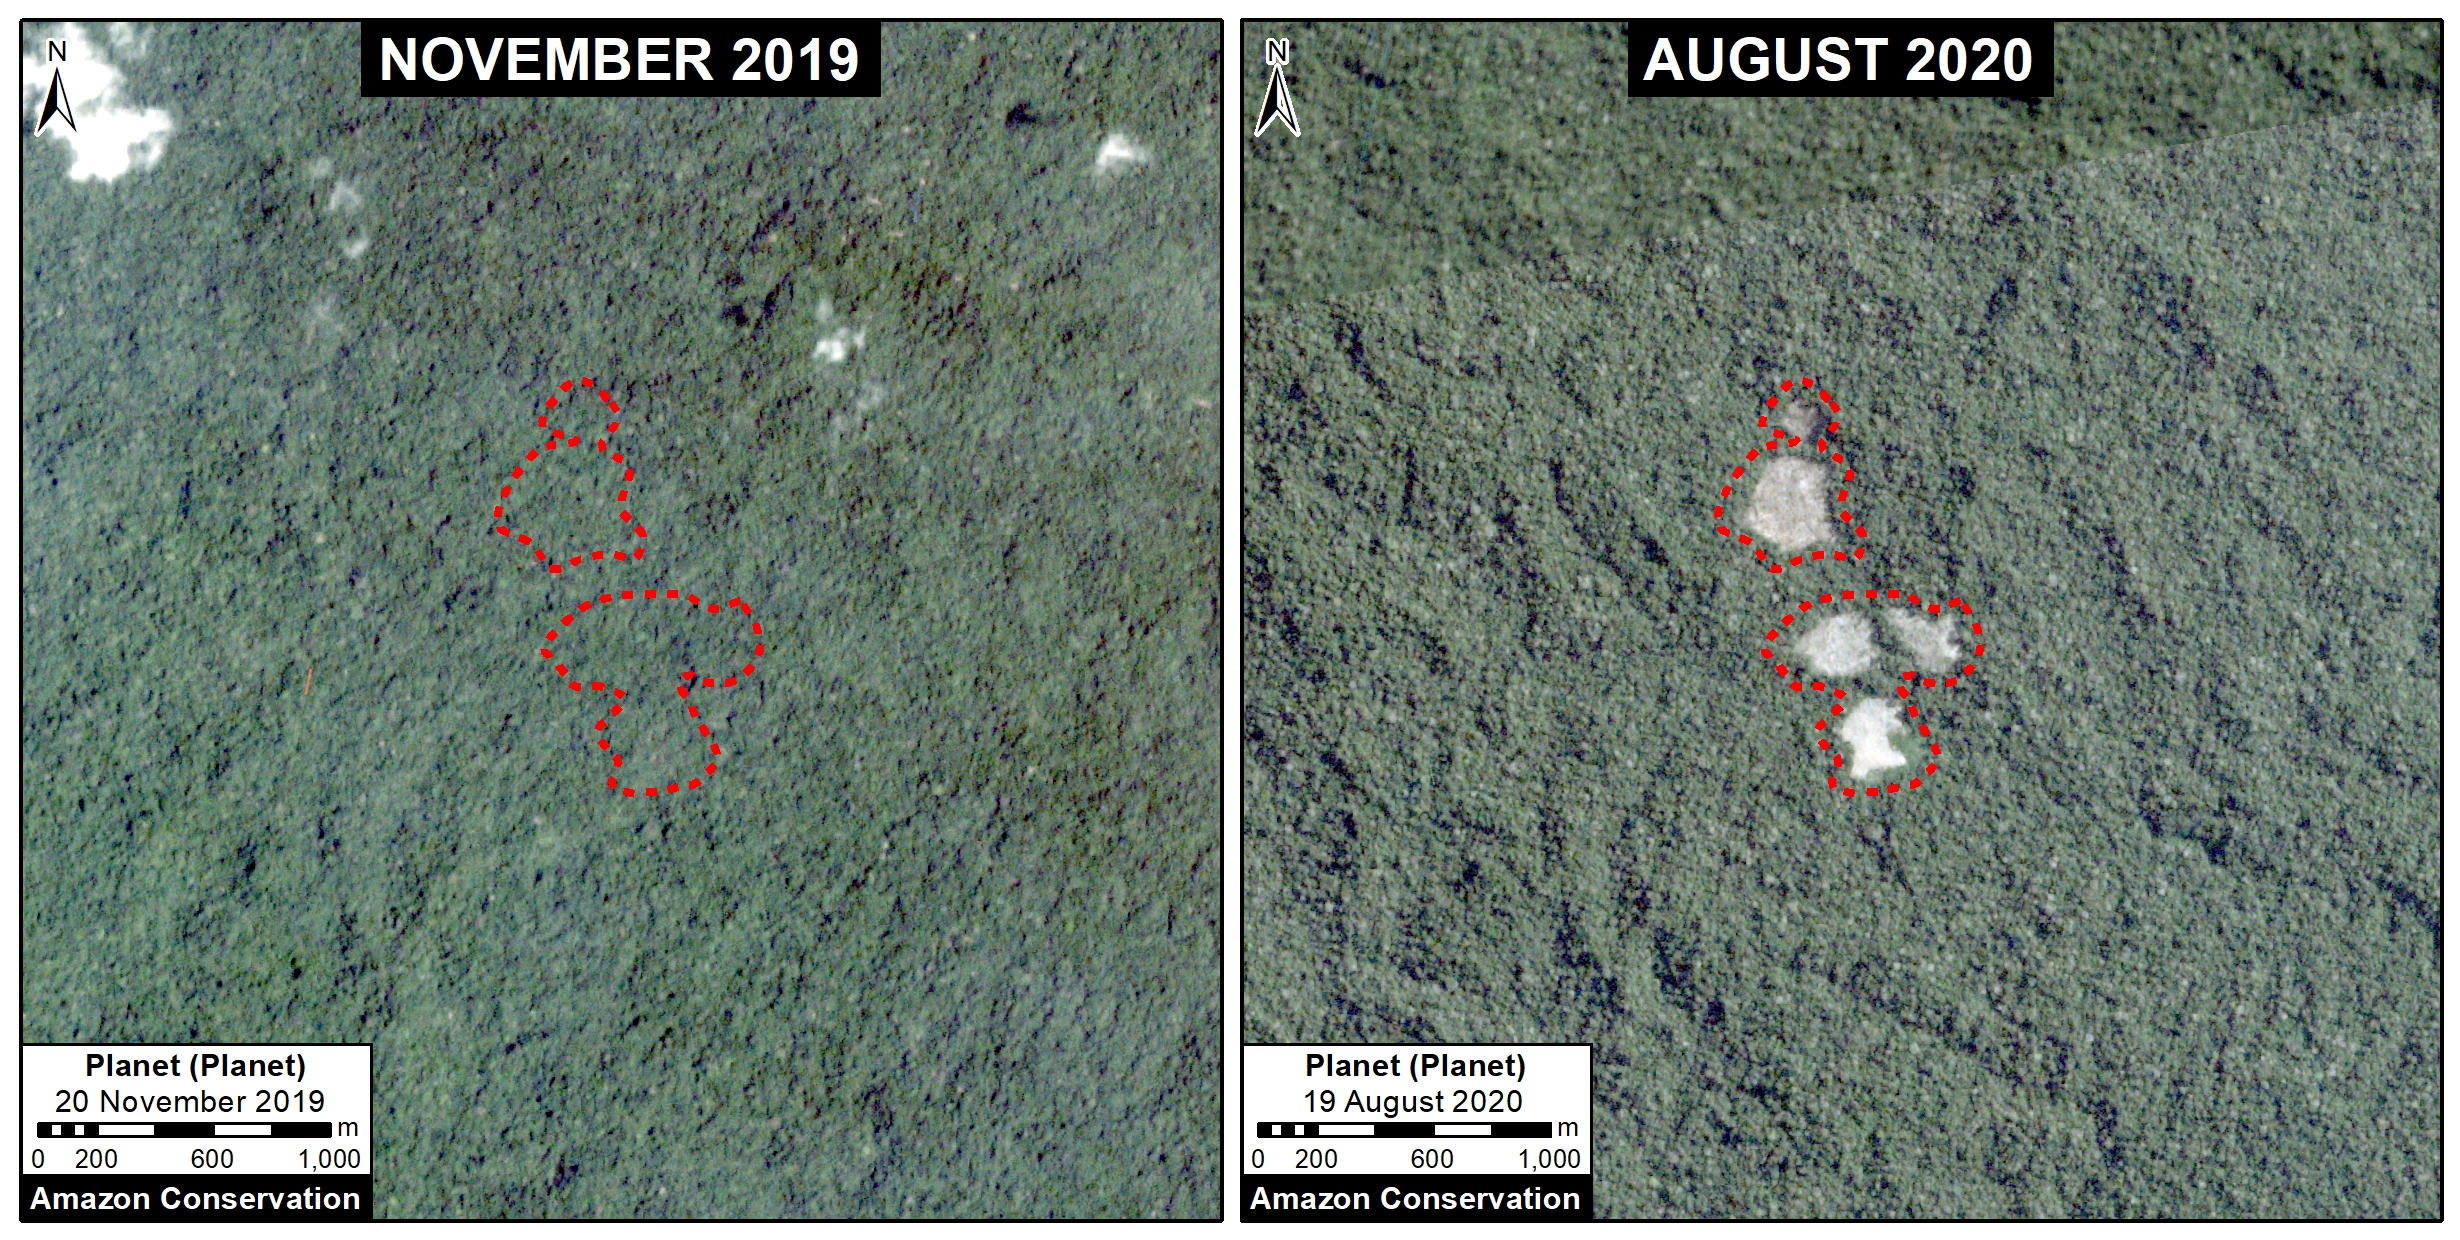
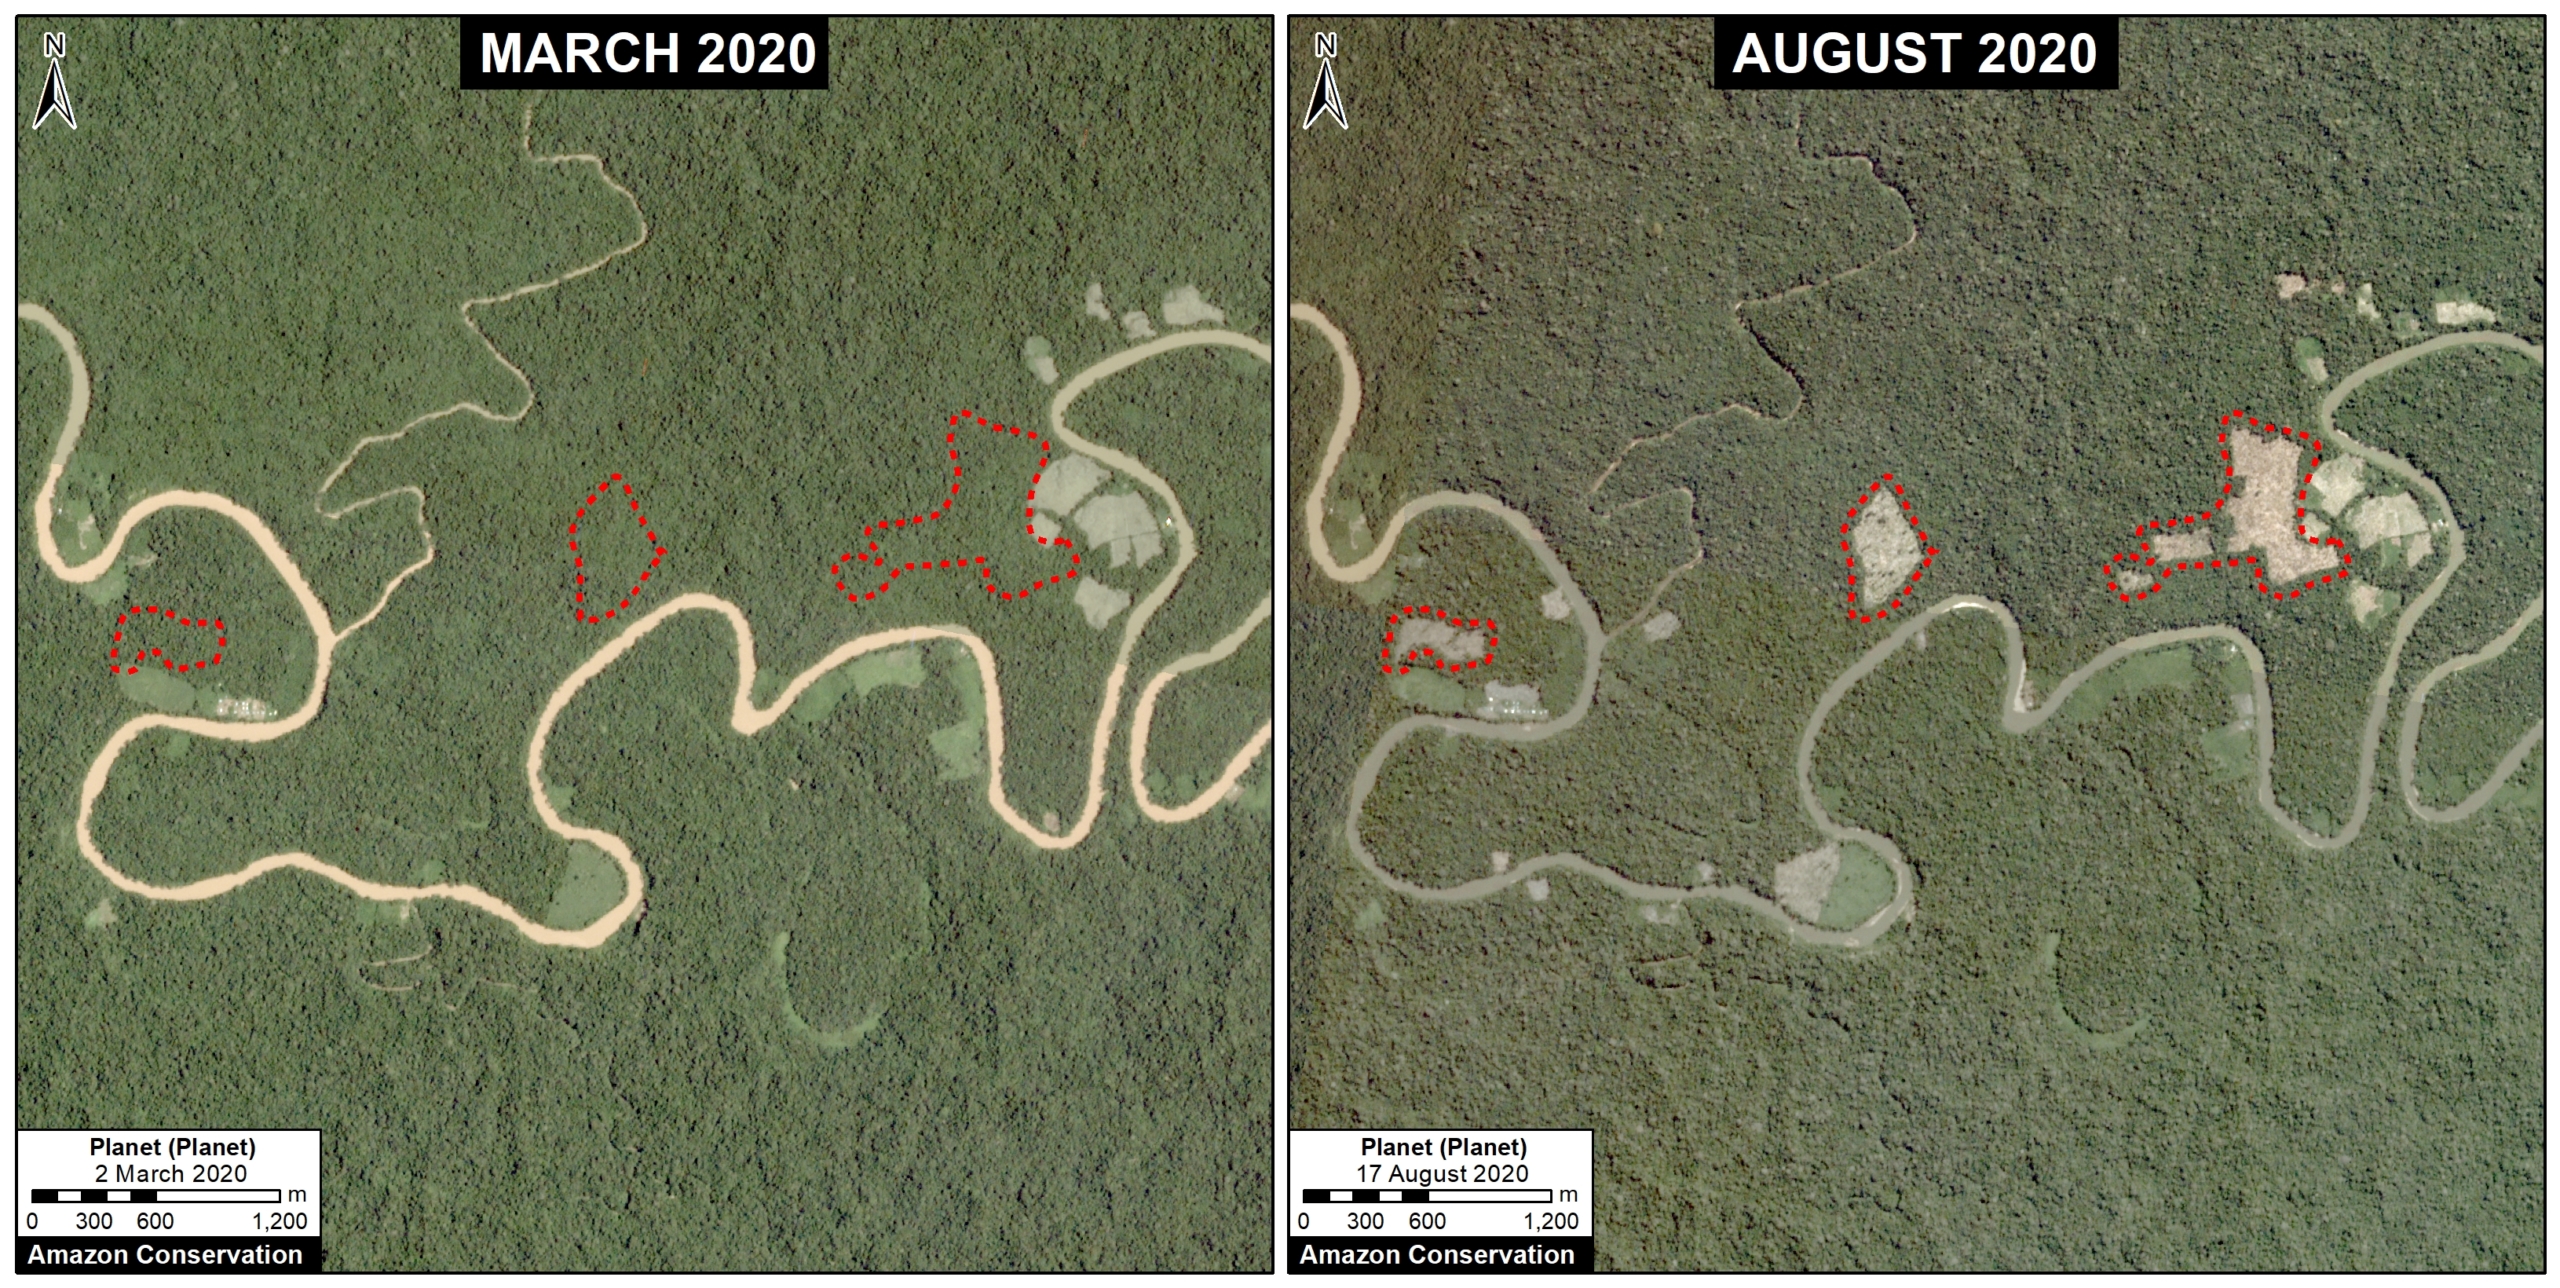
Jeberos case (near Tierra Blanca). Data: Planet, MAAP.


E. Las Piedras

The following image shows the deforestation of 64 acres (26 hectares) of primary forest in a Brazil-nut concession along the Las Piedras River in the Madre de Dios region, between November 2019 (left panel) and August 2020 (right panel) .
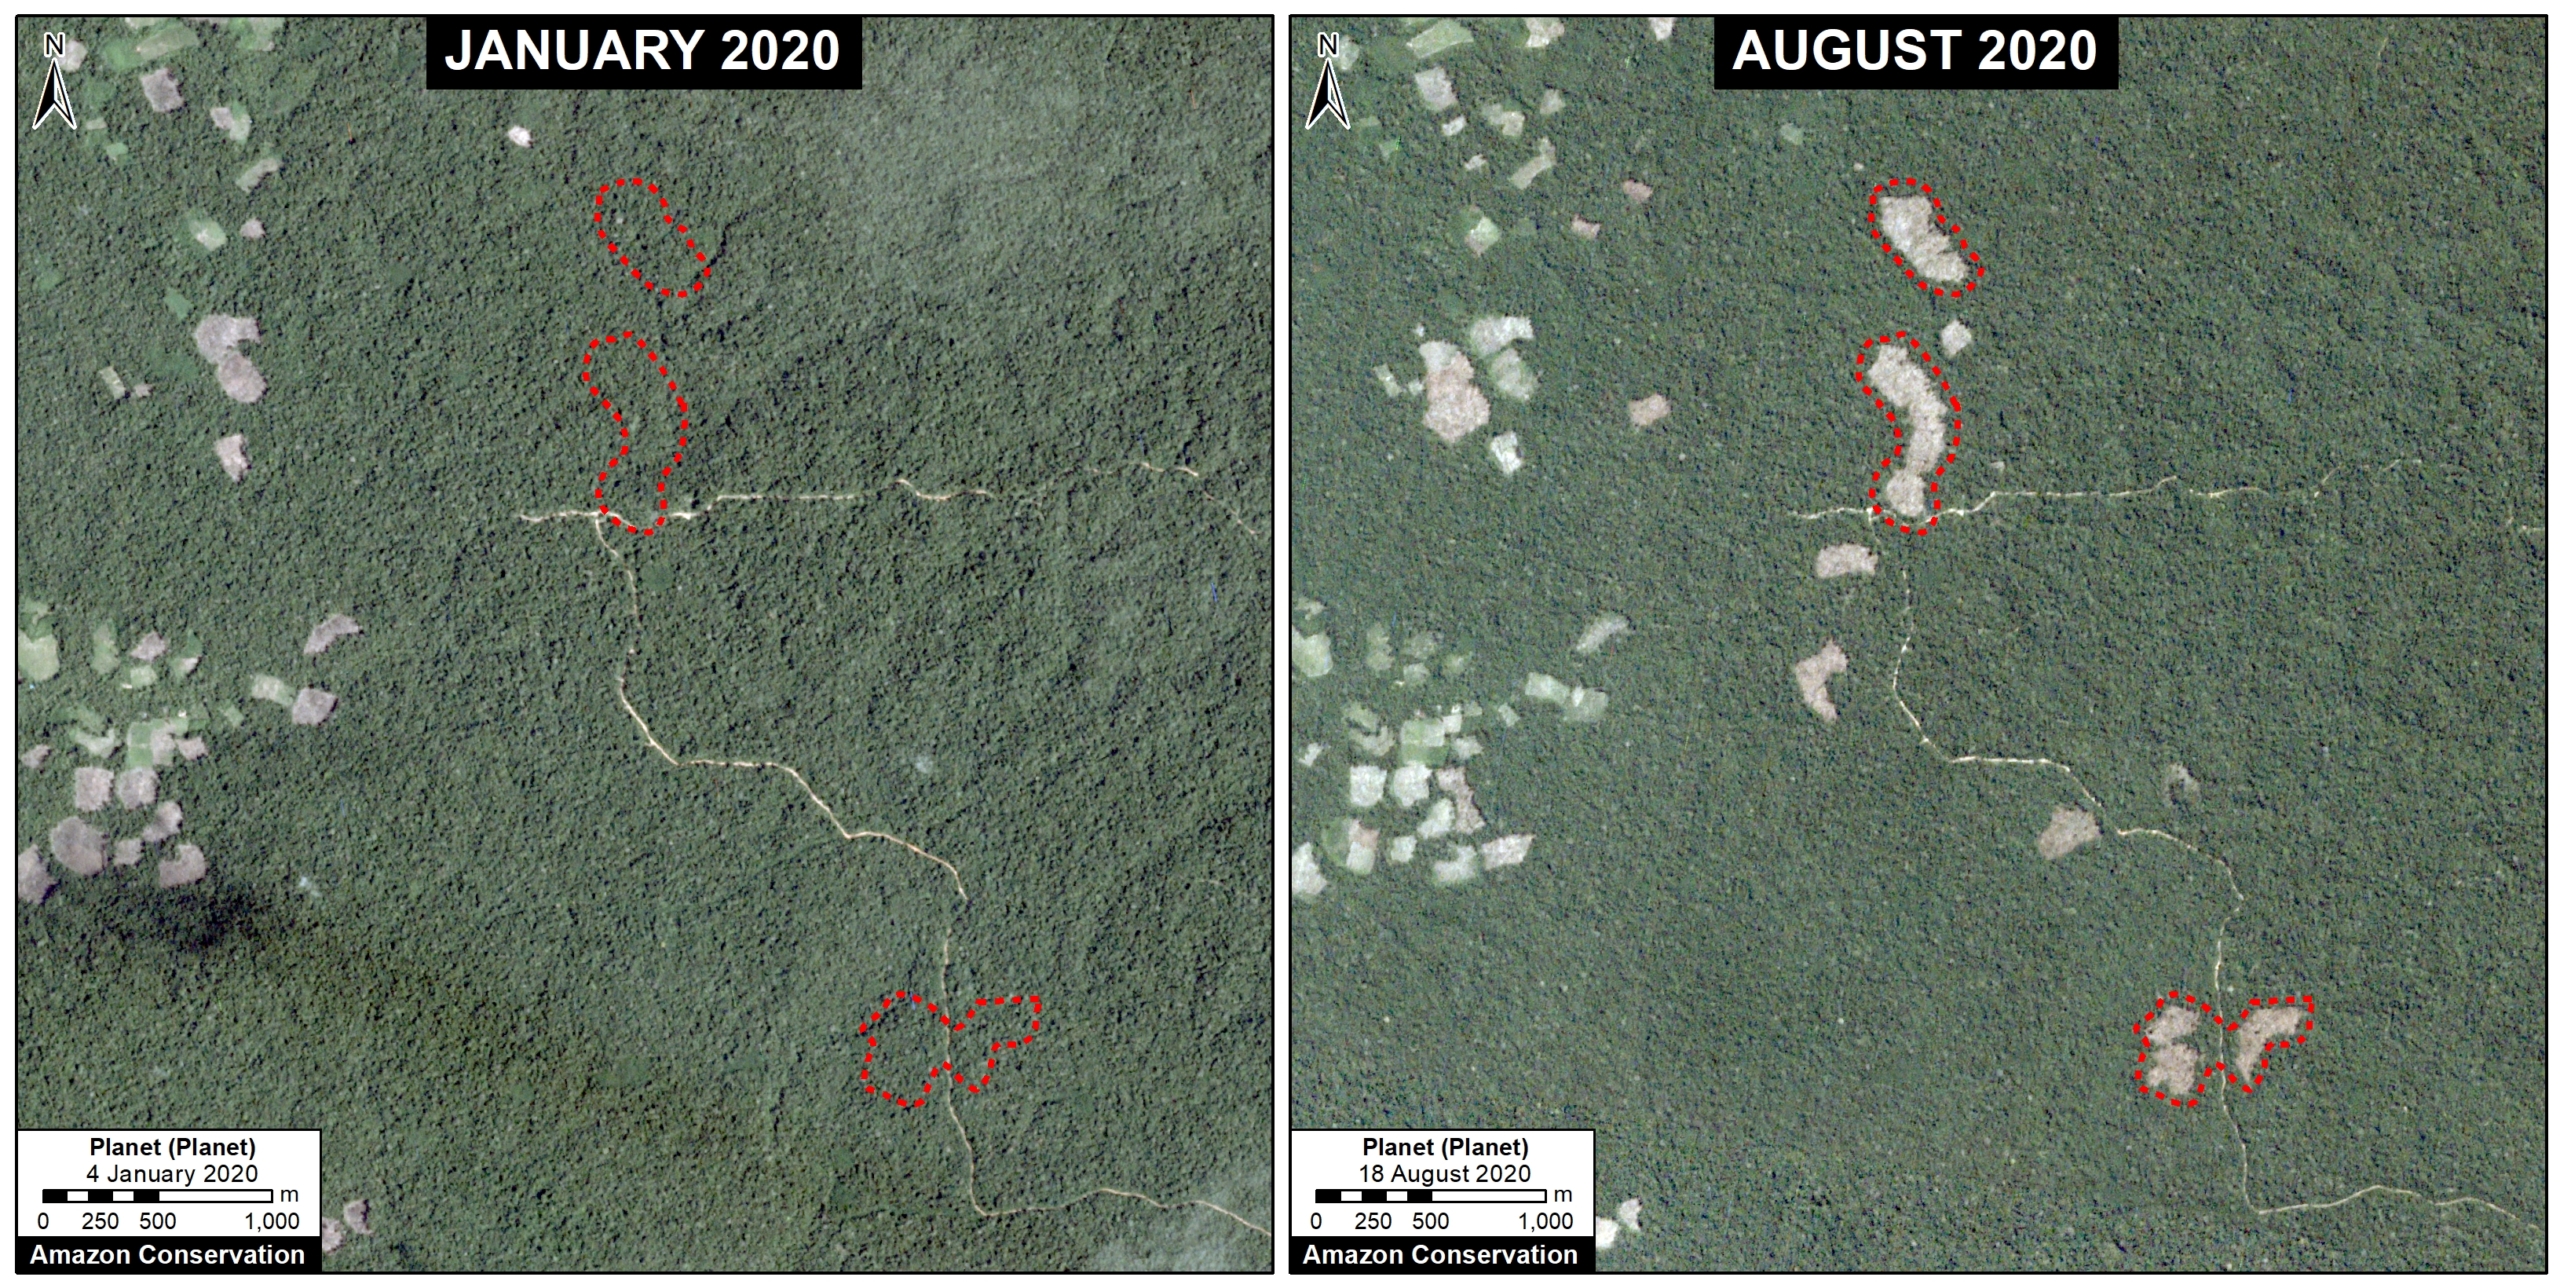
Las Piedras case. Data: Planet, MAAP.

F. Bolognesi

The following image shows an example of deforestation (580 acres or 235 hectares) in one of the areas with the highest concentration of forest loss, located in the Ucayali region.

Bolognesi case. Data: Planet, MAAP.

G. Santa Maria de Nieva

The following image shows an example of deforestation(346 acres or 140 hectares) in another one of the areas with the highest concentration of forest loss, located in the Amazonas region.

Santa Maria de Nieva case. Data: Planet, MAAP.

H. Mishahua River

The following image shows the recent deforestation of 168 acres (68 hectares) along the Mishahua River, in the Ucayali region. Just to the north, we documented extensive deforestation along the Sepahua River in 2019, where it also appears to be starting up again in 2020.

Mishahua case. Data: Planet, MAAP.

I. South of Sierra del Divisor National Park

The following image shows an example of deforestation (166 acres or 67 hectares) in another one of the areas with the highest concentration of forest loss, located south of the Sierra del Divisor National Park in the Ucayali region.

Mishahua case. Data: Planet, MAAP.


Metodology

The analysis was based on early warning GLAD alerts from the Universidad de Maryland and Global Forest Watch.

To identify the deforestation hotspots, we conducted a kernel density estimate. This type of analysis calculates the magnitude per unit area of a particular phenomenon, in this case forest cover loss. We conducted this analysis using the Kernel Density tool from Spatial Analyst Tool Box of ArcGIS. We used the following parameters:

Search Radius: 15000 layer units (meters)
Kernel Density Function: Quartic kernel function
Cell Size in the map: 200 x 200 meters (4 hectares)
Everything else was left to the default setting.

For the Base Map, we used the following concentration percentages: Medium: 7-10%; High: 11-20%; Very High: >20%.

Acknowledgements

We thank S. Novoa and G. Palacios for helpful comments to earlier versions of this report.

This work was supported by the following major funders: Erol Foundation, Norwegian Agency for Development Cooperation (NORAD), and International Conservation Fund of Canada (ICFC).

Citation

Finer M, Mamani N (2020) Deforestation Hotspots 2020 in the Peruvian Amazon. MAAP: 124.

MAAP #122: Amazon Deforestation 2019

Table 1. Primary forest loss for 2019 (red) compared to 2018 (orange). Data: Hansen/UMD/Google/USGS/NASA, MAAP.

Newly released data for 2019 reveals the loss of over 1.7 million hectares (4.3 million acres) of primary Amazon forest in our 5 country study area (Bolivia, Brazil, Colombia, Ecuador, and Peru).* That is twice the size of Yellowstone National Park.

Table 1 shows 2019 deforestation (red) in relation to 2018 (orange).

Primary forest loss in the Brazilian Amazon (1.29 million hectares) was over 3.5 times higher than the other four countries combined, with a slight increase in 2019 relative to 2018. Many of these areas were cleared in the first half of the year and then burned in August, generating international attention.

Primary forest loss rose sharply in the Bolivian Amazon (222,834 hectares), largely due to uncontrolled fires escaping into the dry forests of the southern Amazon.

Primary forest loss rose slightly in the Peruvian Amazon (161,625 hectares) despite a relatively successful crackdown on illegal gold mining, pointing to small-scale agriculture (and cattle) as the main driver.

On the positive side, primary forest loss decreased in the Colombian Amazon (91,400 hectares) following a major spike following the 2016 peace accords (between the government and FARC). It is worth noting, however, that we have now documented the loss of 444,000 hectares (over a million acres) of primary forest in the Colombian Amazon in the past four years since the peace agreement (see Annex).

*Two important points about the data. First, we use annual forest loss from the University of Maryland to have a consistent source across all five countries. Second, we applied a filter to only include loss of primary forest (see Methodology).

2019 Deforestation Hotspots Map

The Base Map below shows the major 2019 deforestation hotspots across the Amazon.

2019 deforestation hotspots across the Amazon. Data: Hansen/UMD/Google/USGS/NASA, MAAP.

Many of the major deforestation hotspots were in Brazil. Early in the year, in March, there were uncontrolled fires up north in the state of Roraima. Further south, along the Trans-Amazonian Highway, much of the deforestation occurred in the first half of the year, followed by the high profile fires starting in late July. Note that many of these fires were burning recently deforested areas, and were not uncontrolled forest fires (MAAP #113).

The Brazilian Amazon also experienced escalating gold mining deforestation in indigenous territories (MAAP #116).

Bolivia also had an intense 2019 fire season. Unlike Brazil, many were uncontrolled fires, particularly in the Beni grasslands and Chiquitano dry forests of the southern Bolivian Amazon (MAAP #108).

In Peru, although illegal gold mining deforestation decreased (MAAP #121), small-scale agriculture (including cattle) continues to be a major driver in the central Amazon (MAAP #112) and an emerging driver in the south.

In Colombia, there is an “arc of deforestation” in the northwestern Amazon. This arc includes four protected areas (Tinigua, Chiribiquete and Macarena National Parks, and Nukak National Reserve) and two Indigenous Reserves (Resguardos Indígenas Nukak-Maku and Llanos del Yari-Yaguara II) experiencing substantial deforestation (MAAP #120). One of the main deforestation drivers in the region is conversion to pasture for land grabbing or cattle ranching.

Annex – Colombia peace accord trend

Annex 1. Deforestation of primary forest in the Colombian Amazon, 2015-20. Data: Hansen/UMD/Google/USGS/NASA, UMD/GLAD. *Until May 2020

Methodology

The baseline forest loss data presented in this report were generated by the Global Land Analysis and Discovery (GLAD) laboratory at the University of Maryland (Hansen et al 2013) and presented by Global Forest Watch. Our study area is strictly what is highlighted in the Base Map.

For our estimate of primary forest loss, we used the annual “forest cover loss” data with density >30% of the “tree cover” from the year 2001. Then we intersected the forest cover loss data with the additional dataset “primary humid tropical forests” as of 2001 (Turubanova et al 2018). For more details on this part of the methodology, see the Technical Blog from Global Forest Watch (Goldman and Weisse 2019).

For boundaries, we used the biogeographical limit (as defined by RAISG) for all countries except Bolivia, where we used the Amazon watershed limit (see Base Map).

All data were processed under the geographical coordinate system WGS 1984. To calculate the areas in metric units, the projection was: Peru and Ecuador UTM 18 South, Bolivia UTM 20 South, Colombia MAGNA-Bogotá, and Brazil Eckert IV.

Lastly, to identify the deforestation hotspots, we conducted a kernel density estimate. This type of analysis calculates the magnitude per unit area of a particular phenomenon, in this case forest cover loss. We conducted this analysis using the Kernel Density tool from Spatial Analyst Tool Box of ArcGIS. We used the following parameters:

Search Radius: 15000 layer units (meters)
Kernel Density Function: Quartic kernel function
Cell Size in the map: 200 x 200 meters (4 hectares)
Everything else was left to the default setting.

For the Base Map, we used the following concentration percentages: Medium: 7%-10%; High: 11%-20%; Very High: >20%.

References

Goldman L, Weisse M (2019) Explicación de la Actualización de Datos de 2018 de Global Forest Watch. https://blog.globalforestwatch.org/data-and-research/blog-tecnico-explicacion-de-la-actualizacion-de-datos-de-2018-de-global-forest-watch

Hansen, M. C., P. V. Potapov, R. Moore, M. Hancher, S. A. Turubanova, A. Tyukavina, D. Thau, S. V. Stehman, S. J. Goetz, T. R. Loveland, A. Kommareddy, A. Egorov, L. Chini, C. O. Justice, and J. R. G. Townshend. 2013. “High-Resolution Global Maps of 21st-Century Forest Cover Change.” Science 342 (15 November): 850–53. Data available on-line from: http://earthenginepartners.appspot.com/science-2013-global-forest.

Turubanova S., Potapov P., Tyukavina, A., and Hansen M. (2018) Ongoing primary forest loss in Brazil, Democratic Republic of the Congo, and Indonesia. Environmental Research Letters  https://doi.org/10.1088/1748-9326/aacd1c 

Acknowledgements

We thank G. Palacios for helpful comments to earlier versions of this report.

This work was supported by the following major funders: Norwegian Agency for Development Cooperation (NORAD), Gordon and Betty Moore Foundation, International Conservation Fund of Canada (ICFC), Metabolic Studio, Erol Foundation, MacArthur Foundation, and Global Forest Watch Small Grants Fund (WRI).

Citation

Finer M, Mamani N (2020) 2019 Amazon Deforestation. MAAP: 122.

MAAP #121: Reduction of Illegal Gold Mining in the Peruvian Amazon

Base Map. Illegal gold mining deforestacion in the protected area buffer zones of the southern Peruvian Amazon, 2017-2019. Data: MAAP. Click to enlarge image.

Thanks to the support of the USAID, via the Prevent Project, dedicated to the prevention and combat of environmental crimes in the Amazon, we conducted a detailed analysis of recent illegal gold mining deforestation in the southern Peruvian Amazon.

The objective is to understand the trends from early 2017 to June 2020 (which includes the first part of the mandatory quarantine issued by the Peruvian government as of March 16, 2020 due to the coronavirus pandemic).

We focus on the buffer zones of two protected areas in the Madre de Dios region: Tambopata National Reserve and Bahuaja Sonene National Park (see Base Map).*

This area includes La Pampa, the current highest intensity illegal mining zone in the country. In February 2019, the Peruvian government launched Operation Mercury  to confront the illegality in La Pampa and surrounding areas.

The Base Map shows that gold mining deforestation in La Pampa decreased over 90% following Operation Mercury.

However, illegal gold mining does continue after Operation Mercury (including during the coronavirus state of emergency), but at lower rates. Thus, current snapshots may be misleading and recent context is important.

On the Base Map, the red arrows indicate the areas with the most recent illegal activity (click the image to enlarge). See below for more details.

Main Results

Table 1. Illegal gold mining deforestation before (yellow) and after (red) Operation Mercury in the buffer zones of Madre de Dios. Data: MAAP.

The Base Map and Table 1 illustrate the following key results:

  • In La Pampa, we documented mining deforestation of 173 hectares (428 acres) per month before Operation Mercury (January 2018 – February 2019). After the intervention, deforestation was reduced to 14 hectares (36 acres) per month (March 2019 – May 2020), a decrease of 92%.
    .
  • Upstream, in the Alto Malinowski, we documented the mining deforestation of 61 hectares (150 acres) per month before Operation Mercury. After the intervention, deforestation was reduced to 28 hectares (69 acres) per month, a decrease of 53%.
    .
  • Downstream, in the Apaylon area, we documented the mining deforestation of 2.9 hectares (7 acres) per month, before Operation Mercury. After the intervention, deforestation increased to 4 hectares (10 acres) per month, an increase of 41%. Apaylon is main area in the buffer zone where deforestation has increased.
    .
  • Within Tambopata National Reserve, we documented the mining deforestation of 6.5 hectares (16 acres) per month, before Operation Mercury. After the intervention, deforestation was reduced to 0.5 hectares (1.2 acres) per month, a decrease of 93%.
    .
  • Overall, illegal gold mining does continue in the buffer zones of Madre de Dios, but at lower rates than the previous two years. We documented the gold mining deforestation of 797 hectares (1,670 acres) after Operation Mercury.
    .
  • Regarding the speculation that illegal activity would increase during the coronavirus pandemic, we have not documented any major increase or surge in the buffer zones of Madre de Dios.* Illegal mining does continue, however, we documented the deforestation of 80 hectares (198 acres) during the quarantine.
    .

Reduction of 90% in La Pampa

The following images show the major decrease in gold mining deforestation in La Pampa after Operation Mercury. Image 1 shows the rapid deforestation before Operation Mercury, between January 2017 (left panel) and February 2019 (right panel). Image 2 shows how the deforestation decreased after Operation Mercury, between February 2019 (left panel) and May 2020 (right panel). The red dot represents a reference point between the images.

Image 1. Rapid gold mining deforestation in La Pampa before Operation Mercury, between January 2017 (left panel) and February 2019 (right panel). Data: Planet.
Image 2. Mining deforestation decreased in La Pampa after Operation Mercury, between February 2019 (left panel) and May 2020 (right panel). Data: Planet.

Displaced Miners?

Table 2. Deforestation by illegal gold mining before (yellow) and after (red) Operation Mercury in two other threatened areas. Data: MAAP.

There has also been speculation that the focus of Operation Mercury in La Pampa would lead to illegal miners moving to other areas.* Base Map 2 shows two of the most threatened areas: Camanti and Pariamanu.

These are the main results for these two areas:

  • In Camanti (located in the buffer zone of Amarakaeri Communal Reserve), we documented the gold mining deforestation of 13.3 hectares (33 acres) per month before Operation Mercury. After the intervention, deforestation was reduced to 6.1 hectares (15 acres) per month, a decrease of 54%.
    .
  • In Pariamanu, we documented  the mining deforestation of 2.5 hectares (6 acres) per month before Operation Mercury. After the intervention, it increased to 4.2 hectares (10 acres) per month, an increase of 70%.
    .
  • In summary, illegal gold mining continues in these two areas outside La Pampa. We documented the mining deforestation of 175 hectares (432 acres) after Operation Mercury (including 22 hectares during the pandemic). There is some evidence that miners are being displaced to Pariamanu, but there has not been a surge in Camanti.
Base Map 2. Main mining areas in the south of the Peruvian Amazon. Click to enlarge image.

Statement of the Peruvian Protected Area Agency (SERNANP)

El Servicio Nacional de Áreas Naturales Protegidas por el Estado (SERNANP) nos ha comunicado lo siguiente:

  • La actividad de control y vigilancia en la Reserva Nacional Tambopata es permanente y las autoridades (SERNANP, Policía Nacional del Perú, Fiscalías Especializadas en Materia Ambiental, y Marina de Guerra del Perú) continúan interviniendo a todas las actividades de minería ilegal, manteniendo el 100%.
  • Las zonas de amortiguamiento son espacios que están sujetos a la intervención de las autoridades de la Operación Mercurio (no del SERNANP). Se han realizado intervenciones continuas e interdicciones tanto en  las zonas indicadas en el reporte, como en Apaylon y Camanti.
    ,
  • Cabe mencionar que la Operación Mercurio, durante el 2019 y sobre todo en el 2020 (Incluyendo el período de cuarentena) ha ampliado sus operativos mas allá de la Pampa, lo cual explica porque en Camanti las cifras también se ha reducido.  En el segundo semestre de 2020 y en el 2021, se espera que los operativos es amplíen a otras zonas de Madre de Dios.

*Notes

Acknowledgments

We thank R. Segura, M. Castro, E. Ortiz, M. Silman, M. E. Gutierrez, S. Novoa, H. Balbuena, M. Allemant, and G. Palacios for their helpful comments on this report.

This report was conducted with technical assistance from USAID, via the Prevent project. Prevent is an initiative that, over the next 5 years, will work with the Government of Peru, civil society, and the private sector to prevent and combat environmental crimes in Loreto, Ucayali and Madre de Dios, in order to conserve the Peruvian Amazon.

This publication is made possible with the support of the American people through USAID. Its content is the sole responsibility of the authors and does not necessarily reflect the views of USAID or the US government.

Citation

Finer M, Mamani N (2020) Reduction of Illegal Gold Mining in the Peruvian Amazon. MAAP:

MAAP #116: Amazon Gold Mining, Part 2: Brazil

Base Map. Major gold mining deforestation zones across the Amazon. Data: MAAP.

We present the second part of our series on Amazon gold mining, with a focus on the Brazil*

Specifically, we focus on mining in indigenous territories in the Brazilian Amazon.

Extractive activities, such as gold mining, are constitutionally not permitted on indigenous lands, but the Bolsonaro administration is advancing a bill (PL 191) that would reverse this.

The Base Map indicates three Brazilian indigenous territories where we identified recent major gold mining deforestation:

  1. Munduruku (Pará)
  2. Kayapó (Pará)
  3. Yanomami (Roraima)

We documented the gold mining deforestation of 10,245 hectares (25,315 acres) across all three indigenous territories over the past three years (2017 – 2019). That is the equivalent of 14,000 soccer fields.

Below, see more detailed data, including a series of satellite GIFs of the recent gold mining deforestation in each territory.

*Part 1 looked at the Peruvian Amazon (see MAAP #115). For information on Suriname, see this report from Amazon Conservation Team. For all other countries see this resource from RAISG.


Graph 1. Gold mining deforestation in three indigenous territories in the Brazilian Amazon.

Mining Deforestation Increasing

In 2019, all three territories experienced an increase in gold mining deforestation.

In Munduruku Territory, we documented the loss of 3,456 hectares due to mining activity between 2017 and 2019. Note the major spike in 2019, where mining deforestation reached 2,000 hectares.

In Kayapó Territory, we documented the loss of 5,614 hectares between 2017 and 2019. Note that mining deforestation also reached 2,000 hectares in 2019.

In Yanomami Territory, we documented the loss of 1,174 hectares between 2017 and 2019. Note that mining deforestation reached 500 hectares in 2019.

Overall,  44% (4,500 hectares) of the gold mining deforestation occurred in 2019, indicating an increasing trend.

A. Munduruku (Pará)

The GIF below shows an example of gold mining deforestation in Munduruku Territory between 2017 and 2019.

Gold mining deforestation in Munduruku Territory between 2017 and 2019. Data: Planet, MAAP.

B. Kayapó (Pará)

The GIF below shows an example of gold mining deforestation in Kayapó Territory between 2017 and 2019.

Gold mining deforestation in Kayapó Territory between 2017 and 2019. Data: Planet, MAAP.

C. Yanomami (Roraima)

The GIF below shows an example of gold mining deforestation in Yanomami Territory between 2017 and 2019.

Gold mining deforestation in Yanomami Territory between 2017 and 2019. Data: Planet, MAAP.

Annex: Detailed Territory Maps

Below see detailed gold mining deforestation maps for all three Brazilian indigenous territories detailed in this report. Click each image to enlarge.

Gold mining deforestation in Munduruku Territory between 2017 and 2019. Data: MAAP. Click to enlarge.
Gold mining deforestation in Kayapó Territory between 2017 and 2019. Data: MAAP. Click to enlarge.
Gold mining deforestation in Yanomami Territory between 2017 and 2019. Data: MAAP. Click to enlarge.

Acknowledgements

We thank S. Novoa (ACCA), V. Guidotti de Faria (Imaflora), and G. Palacios for helpful comments to earlier versions of this report.

This work was supported by the following major funders: Global Forest Watch Small Grants Fund (WRI), Norwegian Agency for Development Cooperation (NORAD),  International Conservation Fund of Canada (ICFC), Metabolic Studio, and Erol Foundation.

Citation

Finer M, Mamani N (2020) Amazon Gold Mining, part 2: Brazil. MAAP: 116.

MAAP #115: Illegal Gold Mining in the Amazon, part 1: Peru

Base Map. The main illegal gold mining areas in the Peruvian Amazon. Data: MAAP.

In a new series, we highlight the main illegal gold mining frontiers in the Amazon.

Here, in part 1, we focus on Peru. In the upcoming part 2, we will look at Brazil.

The Base Map indicates our focus areas in Peru*:

  • Southern Peru (A. La Pampa, B. Alto Malinowski, C. Camanti, D. Pariamanu);
  • Central Peru (E. El Sira).

Notably, we found an important reduction in gold mining deforestation in La Pampa (Peru’s worst gold mining area) following the government’s launch of Operation Mercury in February 2019.

Illegal gold mining continues, however, in three other major areas of the southern Peruvian Amazon (Alto Malinowski, Camanti, and Pariamanu), where we estimate the mining deforestation of 5,300 acres (2,150 hectares) since 2017.

Of that total, 22% (1,162 acres) occurred in 2019, indicating that displaced miners from Operation Mercury have NOT caused a surge in these three areas.

Below, we show a series of satellite videos of the recent gold mining deforestation (2017-19) in each area.

*Recent press reports indicate the increase in illegal gold mining activity in northern Peru (Loreto region), along the Nanay and Napo Rivers, but we have not yet detected associated deforestation.

A. La Pampa (Southern Peru)

In MAAP #104, we reported a major reduction (92%) of gold mining deforestation in La Pampa during the first four months of Operation Mercury, a governmental mega-operation to confront the illegal mining crisis in this area.

The following video shows how gold mining deforestation has declined considerably since February 2019, the beginning of the operation. Note the rapid deforestation during the years 2016-18, followed by a sudden stop in 2019.

B. Alto Malinowski (Southern Peru)

The following video shows gold mining deforestation in a section of the upper Malinowski River (Madre de Dios region). We estimate the mining deforestation of 4,120 acres (1,668 hectares) throughout the Alto Malinowski area during the 2017 – 2019 period.

Of that total, 20% (865 acres) occurred in 2019, indicating that displaced miners from Operation Mercury have not caused a surge in this area adjacent to La Pampa.

According to our analysis of governmental information (see Annex 2), the recent mining activity is likely illegal because: a) much of it occurs outside of titled mining concessions, b) and all of it occurs outside of the mining corridor established for legal mining activity (see Annex 1).

Note that the mining deforestation is within the Kotsimba Indigenous Community territory. However, it has not penetrated Bahuaja Sonene National Park, in part due to the actions of the Peruvian Protected Areas Service (SERNANP).

C. Camanti (Southern Peru)

The following video shows the gold mining deforestation of 944 acres (382 hectares) in the Camanti district (Cusco region), during the 2017 – 2019 period.

Of that total, 21% (198 acres) occurred in 2019, indicating that there has been no increase in mining activity in this area since the beginning of Operation Mercury in February (in contrast to press reports that have suggested that many displaced miners have moved to this area).

According to governmental information (see Annex 2), this mining activity is likely illegal because: a) much of it occurs outside of titled mining concessions, b) all occurs outside of the mining corridor, and c) all occurs inside both a protected forest (Bosque Protector) and buffer zone of the Amarakaeri Communal Reserve.

SERNANP (Peruvian Protected Areas Service) informed us that in December 2019, as part of Operation Mercury, the Public Ministry (Ministerio Público) led an interdiction with the support of law enforcement. Machinery, mining camps, and mercury were destroyed or removed during the raid. In 2020, as part of an extension of Operation Mercury, the Environmental Prosecutor’s Office (FEMA) of the Public Ministry announced that the buffer zone of the Amarakaeri Communal Reserve will be constantly monitored.

D. Pariamanu (Southern Peru)

The following video shows gold mining activity along a section of the Pariamanu River (Madre de Dios region). We estimate the gold mining deforestation of 245 acres (99 hectares) in the Pariamanu area, during the 2017 – 2019 period.

Of that total, 40% (99 acres) occurred in 2019, indicating that there has been a slight increase in mining activity since the beginning of Operation Mercury in February. This finding suggests that displaced miners may be moving to this area.

According to governmental information (see Annex 2), this mining activity is likely illegal because it is not within active mining concessions and outside the mining corridor. Morevoer,  the mining deforestation is within Brazil nut forestry concessions.

E. El Sira (Central Peru)

The following video shows the gold mining deforestation of 52 acres (21 hectares) in the buffer zone of El Sira Communal Reserve (Huánuco region), during the 2017 – 2019 period.


Although the mining activity occurs in an active mining concession, a recent report indicates that it is illegal because it does not have the deforestation authorization.

Annex 1: Mining Corridor

The mining corridor is the area that the Peruvian Government has defined as potentially legal for mining activity in the Madre de Dios region via a formalization process. As of 2019, over 100 miners have been formalized in Madre de Dios.

In general, mining activity in the corridor is considered legal, either formaly (the formalization process is completed with environmental and operational permits approved) or informaly (in the process of formalization). Thus, mining activity within the corridor is not considered illegal since it is not a prohibited area.

The following two videos show examples of gold mining deforestation in the mining corridor during 2019.

Annex 2: Land Use Map

For greater context, we present a map of qualifying titles directly related to the mining sector, in southern Peru. Layers include the mining corridor (see above), mining concession status (titled, pending, revoked), indigenous territories, and protected areas.

Land use map for southern Peruvian Amazon mining areas. Data: GEOCATMIN/INGEMMET. Click to enlarge.

Acknowledgements

We thank E. Ortiz (AAF), A. Flórez (SERNANP), P. Rengifo (ACCA), A. Condor (ACCA), A. Folhadella (Amazon Conservation), and G. Palacios for helpful comments to earlier versions of this report.

This work was supported by the following major funders: NASA/USAID (SERVIR), Norwegian Agency for Development Cooperation (NORAD), Gordon and Betty Moore Foundation, International Conservation Fund of Canada (ICFC), Metabolic Studio, Erol Foundation, MacArthur Foundation, and Global Forest Watch Small Grants Fund (WRI).

Citation

Finer M, Mamani N (2020) Illegal Gold Mining Frontiers, part 1: Peru. MAAP: 115.

MAAP #105: From satellite to drone to legal action in the Peruvian Amazon

ACOMAT member flying a drone for monitoring. Source: ACCA.

Amazon Conservation, in collaboration with its Peruvian sister organization, is implementing a project aimed at linking cutting-edge technology (satellites and drones) with legal action, in the southern Peruvian Amazon (Madre de Dios region).

The project is building a comprehensive deforestation monitoring system with a local group of forestry concessionaires, known as ACOMAT,* who manage over 486,000 acres (see Base Map).

The monitoring system has three basic steps:

1) Real-time deforestation monitoring with satellite-based early warning forest loss alerts.*

2) Verify and document the alerts with drone overflights.*

3) Initiate a criminal complaint with the local environmental prosecuter’s office* (or an administrative complaint with the relevant forestry authorities) if suspected illegalities are found.

Below, we describe 6 cases (A-E) that have been generated from this comprehensive monitoring system.

It is important to emphasize that this type of monitoring system, featuring local forest custodians (such as concessionaires and indigenous communities) is possible to replicate in the Amazon and other tropical forests.

This innovative project is largely funded by the Norwegian Agency for Development Cooperation (NORAD) and International Conservation Fund of Canada (ICFC).

Base Map. The 6 Acomat cases (A-F) described in this report. Data: ACCA, MINAM/PNCB, SERNANP.

Case A. Illegal logging in the “Los Amigos” Conservation Concession

This evidence in this case was obtained from a drone overflight of an area that was the subject of an early warning forest loss alert within Los Amigos Conservation Consession (a conservation area where logging is not permitted). The overflight documented the illegal logging of the timber species known locally as tornillo (Cedrelinga cateniformis) within the concession (see image below).  The drone images were presented to the environmental prosecuter’s office in Madre de Dios as part of a criminal complaint.

Case A. Illegal logging in the Conservation Concession “Los Amigos”, identified with a drone flying over. Source: ACCA.

Case B. Illegal mining in the “Sonidos de la Amazonía” Ecotourism Concession      

The owner of the Sonidos de la Amazonía Ecotourism Concession received an early warning forest loss alert on his cellphone. She then organized a drone overflight and documented active illegal gold mining activity, including infrastructure (see image below). The drone images were presented to the environmental prosecuter’s office in Madre de Dios as part of a criminal complaint.

Case B. Illegal mining in the Tourism Concession “Sonidos de la Amazonía,” identified with drone images. Source: ACCA.

Case C. Illegal mining in the “AGROFOCMA” Forestry Concession    

The owner of the AGROFOCMA forestry (logging) concession received an early warning forest loss alert on his cellphone. He then organized a drone overflight and documented active illegal gold mining activity, including infrastructure (see image below). The drone images were presented to the environmental prosecuter’s office in Madre de Dios as part of a criminal complaint.

Case C. Illegal mining in the Forest Concession “AGROFOCMA,” identified with drone images. Source: ACCA.

Case D. Illegal mining in the “Inversiones Manu” Forestry Concession     

The owner of the Inversiones Manu forestry (logging) concession received an early warning forest loss alert on his cellphone. He then organized a drone overflight and documented active illegal gold mining activity, including workers and infrastructure (see image below). The drone images were presented to the environmental prosecuter’s office in Madre de Dios as part of a criminal complaint.

Case D. Illegal mining in the Forest Concession “Inversiones Manu,” identified with drone images. Source: ACCA.

Case E. Illegal logging in the “Sara Hurtado” Brazil Nut Concession 

The owner of the Sara Hurtado Brazil Nut Concession received an early warning forest loss alert on her cellphone. She then organized a drone overflight and documented active illegal logging activity, including cedar wood planks (see image below). The drone images were presented to the environmental prosecuter’s office in Madre de Dios as part of a criminal complaint.

In a related case, drones also captured images of a nearby collection center and transport truck for the recently logged planks. These images were also presented to the environmental prosecuter’s office as part of a sixth case.

Case E. Illegal logging in the Forest Concession “Sara Hurtado” identified with drone images. Source: ACCA.

*Notes

ACOMAT is the “Asociación de Concesionarios Forestales Maderables y no Maderables de las Provincias del Manu, Tambopata y Tahuamanu.”

The early warning alerts are generated by the Peruvian government (Geobosques/MINAM). GLAD alerts can also be used (these are generated by the University of Maryland and presented by Global Forest Watch). In our case, the concessionaires receive Geobosques alerts in their emails.

We used quadricopter drones. Obtained images are very-high resolution (<5 cm).

The local environmental prosecuter’s office is the “Fiscalía Especializada en Materia Ambiental (FEMA) de Madre de Dios.”

Acknowledgements

We thank S. Novoa (ACCA), H. Balbuena (ACCA), E. Ortiz (AAF), T. Souto (ACA), P. Rengifo (ACCA), A. Condor (ACCA), y G. Palacios for helpful comments on earlier drafts of this report.

This work supprted by the following funders:  Norwegian Agency for Development Cooperation (NORAD), International Conservation Fund of Canada (ICFC), MacArthur Foundation, Metabolic Studio.

Citation

Guerra J, Finer M, Novoa S (2019) From satellite to drone to legal action in the Peruvian Amazon. MAAP: 105.


MAAP #104: Major Reduction in Illegal Gold Mining from Peru’s Operation Mercury

Graph 1. Illegal gold mining deforestation in La Pampa, 2017-19. Data: ACA, MAAP.

In February 2019, the Peruvian government launched Operation Mercury (Operación Mercurio), a major multi-sectoral crackdown on the illegal gold mining crisis in the area known as La Pampa,* located  in the southern Peruvian Amazon (Madre de Dios region). Note that this area is not within Tambopata National Reserve, but in its buffer zone.

In this report, we present the results of our analysis on the initial impacts of this Operation.

We found a major reduction in gold mining deforestation in La Pampa in 2019, compared to the same time period (February – June) of the previous two years (see Graph 1).

In fact, the gold mining deforestation decreased 92% between 2018 (900 hectares) and 2019 (67 hectares), representing the situation before and after the start of Operation Mercury.

The Base Map illustrates how the expansion of gold mining deforestation greatly dropped in 2019 compared to the two previous years, especially in the eastern front. The letters (A-C) correspond to the location of the Zooms, below.

The analysis also reveals, however, that the gold mining deforestation in La Pampa has not yet been completely eradicated and continues in numerous remote and isolated areas.

Base Map. Illegal gold mining deforestation in La Pampa. Data: ACCA, MAAP, SERNANP.

Zoom A1 shows the critical eastern front of the gold mining deforestion between February (left panel) and June (right panel) 2019, the first five months of Operation Mercury. While the rapid eastward expansion of the front has greatly decreased, the red circles indicate areas where we have detected isolated mining activity.

Zoom A1. Eastern front of the gold mining deforestation in La Pampa. Data: ESA, MAAP.

High Resolution Zooms

Zoom B shows the eradication of one of the biggest mining camps in La Pampa between 2018 (left panel) and 2019 (right panel).

Zoom B. Eradication of major gold mining camp. Data: Maxar.

The following Zooms show examples of the persistence of isolated illegal gold mining activity and infrastructure in La Pampa, with recent (June 2019) high resolution satellite and drone images. The letters (A2, C1, C2) correspoind to the Base Map, above.

Zoom A2. Data: Maxar, MAAP.
Zoom C1. Data: ACCA.
Zoom C2. Data: ACCA.

Google Earth Engine App

We present a new app, developed with Google Earth Engine, that allows an interactive visualization of the evolution of gold mining deforestation in La Pampa. The app allows the user to take advantage of Google’s powerful computers to compare (with a slider) different dates from a large archive of Sentinel-1 satellite images (see screenshot, below). Sentinel-1 is radar, so there are no clouds in the images.

https://luciovilla.users.earthengine.app/view/mining-monitoring-by-sar-sentinel-1


Screen shot of the app. Data: ESA, MAAP

Notes 

*La Pampa is the sector located in the buffer zone of Tambopata National Reserve, delimited by the northern boundary of the reserve, the Malinowski River and the Interoceanic Highway.

Full study area of La Pampa (shaded). Data: ACCA, MAAP.

Acknowledgements

We thank S. Novoa (ACCA), H. Balbuena (ACCA), E. Ortiz (AAF), T. Souto (ACA), P. Rengifo (ACCA), A. Condor (ACCA), y G. Palacios for helpful comments on earlier drafts of this report.

This work supprted by the following funders:  Norwegian Agency for Development Cooperation (NORAD), International Conservation Fund of Canada (ICFC), MacArthur Foundation, Metabolic Studio, and Global Forest Watch Small Grants Fund (WRI).

Citation

Villa L, Finer M (2019) Major Reduction in Illegal Gold Mining from Peru’s Operation Mercury. MAAP: 104.

MAAP #100: Western Amazon – Deforestation Hotspots 2018 (a regional perspective)

Base Map. Deforestation Hotspots in the western Amazon. Data: Hansen/UMD/Google/USGS/NASA, GFW, SERNANP, SNAP, SINAP, SERNAP, RAISG

For the 100th MAAP report, we present our first large-scale western Amazon analysis: Colombia, Peru, Ecuador, Bolivia, and western Brazil (see Base Map).

We use the new 2018 data for forest cover loss, generated by the  University of Maryland (Hansen et al 2013) and presented by Global Forest Watch.

These data indicate 2.5 million acres of forest cover loss in the western Amazon in 2018.*

We conducted an additional analysis that indicates, of this total, 1.9 million acres were primary forest.*

To identify deforestation hotspots consistently across this vast landscape, we conducted a kernel density analysis (see Methodology).

The Base Map shows the hotspots in yellow, orange and red, indicating areas with medium, high, and very high forest loss concentrations, respectively.

Next, we focus on five zones of interest (Zooms A-E) in Colombia, Brazil, Bolivia, and Peru. For all images, please click to enlarge.

*Forest Cover Loss: 5 acres per minute. Almost half (49%) occurred in Brazil, followed by Peru (20%), Colombia (20%), Bolivia (8%), and Ecuador (3%). see Annex.

**Primary Forest Loss: 3.5 acres per minute. Over half (53%) occurred in Brazil, followed by Peru (20%), Colombia (18%), Bolivia (7%), and Ecuador (2%). see Annex.

Colombia

The largest concentration of 2018 forest loss is in the northeast Colombian Amazon (494,000 acres). Out of this total, 11% (56,800 acres) occurred in national parks. National experts indicate that land grabbing has emerged as a leading direct driver of deforestation (Arenas 2018). See MAAP #97 for more information.

Zoom A shows the forest loss expanding towards western Chiribiquete National Park, including distinct deforestation in this protected area during 2018.

Zoom B shows the extensive 2018 deforestation (30,000 acres) within Tinigua National Park. A recent news report indicates that cattle ranching is one of the factors related to this deforestation.

Zoom A. Colombia-Chiribiquete. Data: Hansen/UMD/Google/USGS/NASA, SINAP, Planet, ESA
Zoom B. Colombia – Tinigua. Data: Hansen/UMD/Google/USGS/NASA, SINAP, Planet, ESA

Brazil (border with Bolivia)

Another important result is the contrast between northern Bolivia (Pando department) and adjacent side Brazil (states of Acre, Amazonas, and Rondônia). Zoom C shows several deforestation hotspots on the Brazilian side, while the Bolivian side is much more intact.

Zoom C. Brazil, Bolivia border. Data: Hansen/UMD/Google/USGS/NASA, ESA, RAISG

Bolivia

In Bolivia, the major forest loss hotspots are further south. Zoom D shows the recent deforestation (5,000 acres in 2018) due to agricultural activity associated with one of the first major Mennonite settlements in Beni department (Kopp 2015). The other Mennonite settlements are located further south.

Zoom D. Bolivia, Black River Mennonite settlement. Data: Hansen/UMD/Google/USGS/NASA, SERNAP, Planet

Peru

The Hansen data indicates over 200,000 acres of forest loss during 2018 in the Peruvian Amazon. One of the most important deforestation drivers, especially in southern Peru, is gold mining. We estimate 23,000 acres of gold mining deforestation during 2018 in the southern Peruvian Amazon (see MAAP #96).

Zoom E shows the most emblematic case of gold mining deforestation: the area known as La Pampa.

It is important to emphasize, however, that in February 2019 the Peruvian government launched “Operation Mercury 2019” (Operación Mercurio 2019), a multi-sectoral and comprehensive mega-operation aimed at eradicating illegal mining and associated crime in La Pampa, as well as promote development in the region.

Zoom D. Peru – La Pampa. Data: Hansen/UMD/Google/USGS/NASA, SERNAP, Planet

Annex

Annex. Forest cover and primary forest loss in the western Amazon.  Data: Hansen/UMD/Google/USGS/NASA, Global Forest Watch.

Methods

The 2018 forest loss data presented in this report were generated by the Global Land Analysis and Discovery (GLAD) laboratory at the University of Maryland (Hansen et al 2013) and presented by Global Forest Watch. Our study area is strictly what is presented in the Base Map: the areas within the Amazonian biogeographic boundary of the western Amazon.

Specifically, for our estimate of forest cover loss, we multiplied the annual “forest cover loss” data by the density percentage of the “tree cover” from the year 2000 (values >30%).

For our estimate of primary forest loss, we intersected the forest cover loss data with the additional dataset “primary humid tropical forests” as of 2001 (Turubanova et al 2018). For more details on this part of the methodology, see the Technical Blog from Global Forest Watch (Goldman and Weisse 2019).

All data were processed under the geographical coordinate system WGS 1984. To calculate the areas in metric units the UTM (Universal Transversal Mercator) projection was used: Peru and Ecuador 18 South, Colombia 18 North, Western Brazil 19 South and Bolivia 20 South.

Lastly, to identify the deforestation hotspots, we conducted a kernel density estimate. This type of analysis calculates the magnitude per unit area of a particular phenomenon, in this case forest cover loss. We conducted this analysis using the Kernel Density tool from Spatial Analyst Tool Box of ArcGIS. We used the following parameters:

Search Radius: 15000 layer units (meters)
Kernel Density Function: Quartic kernel function
Cell Size in the map: 200 x 200 meters (4 hectares)
Everything else was left to the default setting.

For the Base Map, we used the following concentration percentages: Medium: 10%-20%; High: 21%-35%; Very High: >35%.

References

Arenas M (2018) Acaparamiento de tierras: la herencia que recibe el nuevo gobierno de Colombia. Mongabay, 2 AGOSTO 2018. https://es.mongabay.com/2018/08/acaparamiento-de-tierras-colombia-estrategias-gobierno/

Goldman L, Weisse M (2019) Technical Blog: Global Forest Watch’s 2018 Data Update Explained. https://blog.globalforestwatch.org/data-and-research/blog-tecnico-explicacion-de-la-actualizacion-de-datos-de-2018-de-global-forest-watch

Hansen, M. C., P. V. Potapov, R. Moore, M. Hancher, S. A. Turubanova, A. Tyukavina, D. Thau, S. V. Stehman, S. J. Goetz, T. R. Loveland, A. Kommareddy, A. Egorov, L. Chini, C. O. Justice, and J. R. G. Townshend. 2013. “High-Resolution Global Maps of 21st-Century Forest Cover Change.” Science 342 (15 November): 850–53. Data available on-line from: http://earthenginepartners.appspot.com/science-2013-global-forest.

Kopp Ad (2015) Las colonias menonitas en Bolivia. Tierra. http://www.ftierra.org/index.php/publicacion/libro/147-las-colonias-menonitas-en-bolivia

Planet Team (2017). Planet Application Program Interface: In Space for Life on Earth. San Francisco, CA. https://api.planet.com

Turubanova S., Potapov P., Tyukavina, A., and Hansen M. (2018) Ongoing primary forest loss in Brazil, Democratic Republic of the Congo, and Indonesia. Environmental Research Letters  https://doi.org/10.1088/1748-9326/aacd1c 

Acknowledgements

We thank M. Terán (ACEAA), M. Weisse (GFW/WRI), A. Thieme (UMD), R. Catpo (ACCA) and A. Cóndor (ACCA) for helpful comments to this report.

Citation

Finer M, Mamani N (2019) Western Amazon – Deforestation Hotspots 2018 (a regional perspective). MAAP: 100.

MAAP #98: Deforestation Hotspots in the Peruvian Amazon, 2018

Base Map. 2018 Deforestación Hotspots. Data: PNCB/MINAM, SERNANP

Thanks to early warning forest loss alerts,* we are able to make an initial assessment of the 2018 deforestation hotspots in the Peruvian Amazon.

The Base Map highlights the medium (yellow) to high (red) hotspots. In this context, hotspots are the areas with the highest density of forest loss alerts.

Note that the most intense hotspots are concentrated in the southern Peruvian Amazon, particularly the Madre de Dios region. In previous years, intense hotspots were also concentrated in the central Peruvian Amazon.

Next, we focus on 5 hotspots of interest (Zooms A-E).

A. La Pampa (Madre de Dios)
B. Bahuaja Sonene National Park (surroundings) (Madre de Dios, Puno)
C. Iberia (Madre de Dios)
D. Organized Deforestation (Ucayali, Loreto)
E. Central Amazon (Ucayali, Huánuco)

*The data presented in this report is an estimate based on early warning data generated by the National Program of Forest Conservation for the Mitigation of Climate Change of the Ministry of the Environment of Peru (PNCB/MINAM). We also analyzed University of Maryland GLAD alerts, obtained from Global Forest Watch.


A. La Pampa (Madre de Dios)

Zoom A shows two important cases in the southern Peruvian Amazon (Madre de Dios region). First, gold mining deforestation south of the Interoceanic Highway in the area known as La Pampa. It is important to emphasize that the Peruvian government just started “Operation Mercury 2019” (Operación Mercurio 2019), a multi-sectoral and comprehensive mega-operation aimed at eradicating illegal mining and associated crime in La Pampa, as well as promote development in the region. Second, deforestation due to agricultural activity north of the highway. As in all the zoom maps below, pink indicates forest loss in 2018.

Zoom A. La Pampa. Data: PNCB/MINAM, SERNANP, ACCA, ESA

B. Bahuaja Sonene National Park (surroundings) (Madre de Dios, Puno)

Zoom B also shows two important cases in the southern Peruvian Amazon (regions of Madre de Dios and Puno), surrounding Bahuaja Sonone National Park. First, to the north of the park, is gold mining deforestation along the upper Malinowski River. The Peruvian protected areas agency (SERNANP) points out that they have limited the deforestation south of the river (direction towards the national park) due to their intensified patrols on that side. Second, to the south of the park, is non-mining (partly agricultural) deforestation.

Zoom B. Bahuaja Sonene (surroundings). Data: PNCB/MINAM, SERNANP, Planet

C. Iberia (Madre de Dios)

Zoom C takes us to the other side of Madre de Dios, around the town of Iberia, near the border with Brazil and Bolivia. This area is experiencing extensive deforestation due to agricultural activity. There most intense deforestation is just of Iberia, where a religious community of farmers (Arca Pacahuara) is reportedly establishing large corn plantations (References 1-2). Much of the 2018 (and 2017) deforestation is occurring within forest concessions, where agriculture is not permitted.

Zoom C. Iberia. Data: PNCB/MINAM, SERNANP, Planet

D. Organized Deforestation (Ucayali, Loreto)

In 2018 we documented two similar cases in the central Peruvian Amazon. Both have similar forms of organized deforestation, characterized by what seems to be agricultural plots arranged along new access roads. Zoom D shows the Masisea case (left panel, zoom D1) and the Sarayaku case (right panel, zoom D2). See MAAP #92 for more information.

Zoom D. Organized deforestation. Data: PNCB/MINAM, SERNANP, ESA

E. Central Amazon (Ucayali, Huánuco)

As in previous years, there was extensive deforestation in the central Peruvian Amazon (Ucayali and Huánuco regions). Zoom E shows an example: small and medium-scale deforestation surrounding a pair of large-scale oil palm plantations. Some of the recent deforestation is occurring within “Permanent Production Forests,” forestry-zoned areas where agriculture is not permitted. This area also corresponds to the proposed territorial title of the indigenous Shipibo community of Santa Clara de Uchunya (see here for more information).

Zoom E. Central Amazon. Data: PNCB/MINAM, SERNANP, ESA

Methodology

We conducted this analysis using the Kernel Density tool from Spatial Analyst Tool Box of ArcGIS, using the following parameters:

Search Radius: 15000 layer units (meters)
Kernel Density Function: Quartic kernel function
Cell Size in the map: 200 x 200 meters (4 hectares)
Everything else was left to the default setting.

The data presented in this report is an estimate based on early warning data generated by the National Program of Forest Conservation for the Mitigation of Climate Change of the Ministry of the Environment of Peru (PNCB/MINAM). We also analyzed University of Maryland GLAD alerts, obtained from Global Forest Watch.

References

1. CIFOR 2016

2. GOREMAD 2016

Planet Team (2017). Planet Application Program Interface: In Space for Life on Earth. San Francisco, CA. https://api.planet.com

Citation

Finer M, Mamani N (2018) Deforestation Hotspots in the Peruvian Amazon, 2018. MAAP: 98.

MAAP #96: Gold Mining Deforestation at Record High Levels in Southern Peruvian Amazon

Gold mining deforestation has been at record high levels in both 2017 and 2018 in the southern Peruvian Amazon.

Based on an analysis of nearly 500 high-resolution satellite images (from Planet and DigitalGlobe), we estimate the deforestation of 18,440 hectares across southern Peru during these last two years. That is equivalent to 45,560 acres (or 34,400 American football fields) in just two years.

The Base Map highlights this recent deforestation, with 2017 in red and 2018 in pink. The Reference Map in Annex 1 shows our full study area.

Base Map. Gold mining deforestation in southern Peruvian Amazon. Data: USGS/NASA, MAAP, SERNANP.

2017 had the highest gold mining deforestation on record at the time: 9,160 hectares (22,635 acres). According to recent research led by CINCIA (Centro de Innovación Científica Amazónica), this was the highest annual total on record dating back to 1985*.

In 2018, we found the gold mining deforestation was even higher: 9,280 hectares (22,930 acres).

Thus, combined, 2017-18 had the highest two-year deforestation total on record: 18,440 hectares (45,565 acres).

Note the location of Zooms (A-C) shown in greater detail below. These zooms represent three of the most threatened areas: A) La Pampa, B) Upper Malinowski, and C) Camanti.

Click (or right click) to enlarge (or download) images.

*CINCIA reports 9,860 hectares of gold mining deforestation in 2017 (CINCIA 2018, Caballero Espejo et al 2018), an estimate even higher than ours.

Zoom A: La Pampa

Image A shows the gold mining deforestation of 1,685 hectares (4,164 acres) between 2017 (left panel) and 2018 (right panel) in an area known as La Pampa (Madre de Dios region). Red indicates the major deforestation fronts.

Image A. La Pampa. Data: Planet, MAAP

As seen in the Land Use Map below (Annex 2), most of the recent mining deforestation in La Pampa is clearly illegal, concentrated in reforestation concessions and the buffer zone of Tambopata National Reserve.

According to the web portal GEOCATMIN (Geological Information System and Mining Register), developed by INGEMMET (Geological Mining and Metallurgical Institute of Peru), all titled mining concessions in the area are currently “without mining activity.” None are in authorized Exploration or Exploitation phase. Most of the mining activity is outside these concessions and in areas not authorized for mining.

Zoom B: Upper Malinowski

Image B shows the gold mining deforestation of 760 hectares (1,878 acres) between 2017 (left panel) and 2018 (right panel) along the upper stretches of the Malinowski River in the Madre de Dios region. Red indicates the major deforestation fronts.

Image B. Upper Malinowski. Data: Planet, MAAP.

As seen in the Land Use Map below (Annex 2), the recent gold mining deforestation along the Upper Malinowski is advancing in the Kotsimba Native Community and within the buffer zone of Bahuaja Sonene National Park.

According to GEOCATMIN, all titled mining concessions in the area are currently “without mining activity.” None are in authorized Exploration or Exploitation phase. Most of the mining activity is outside these concessions and in areas not authorized for mining.

Zoom C: Camanti

Image 4 shows the gold mining deforestation of 335 hectares (828 acres) between 2016 (left panel) and 2018 (right panel) in the Camanti area of the Cusco region. Red indicates the major deforestation fronts. Note the increasing proximity of the mining to Amarakaeri Communal Reserve.

Image C. Camanti. Data: Planet, MAAP.

As seen in the Land Use Map below (Annex 2), the recent gold mining in the Camanti area is advancing in mining concessions that are “in process” of titling. According to GEOCATMIN, there are no titled concessions in the area that are in Exploration or Exploitation phase.

Annex 1: Reference Map

Annex 1 features a Reference Map of our full study area. The background is white to better indicate the mining deforestation areas. It also serves as a reference map with additional labels.

Reference Map. Gold mining deforestation in southern Peruvian Amazon. Data: MAAP, SERNANP

Annex 2: Land Use Map

Annex 2 features a Land Use Map with detailed data on mining concessions and other important land designations. The mining concession data comes from the web portal GEOCATMIN (Geological Information System and Mining Register), developed by INGEMMET (Geological Mining and Metallurgical Institute of Peru). We downloaded the data on January 2, 2019.

Land use Map. Data: INGEMMET, IBC, MINAGRI, SERNANP, Planet, UMD/GLAD, MINAM/PNCB

Methodology

We analyzed high-resolution satellite imagery (DigitalGlobe and Planet) for both 2017 and 2018 and digitized all new gold mining deforestation. Given the widespread mining across a large area, we also used automated forest loss alerts based on medium resolution Landsat imagery (PNCB/MINAM) to guide our analysis.

References

Centro de Innovación Científica Amazónica (CINCIA) (2018) Tres décadas de deforestación por minería aurífera en la Amazonía suroriental peruana. Resumen de Investigación No. 1.

Caballero Espejo et al. (2018) Deforestation and Forest Degradation Due to Gold Mining in the Peruvian Amazon: A 34-Year Perspective.  Remote Sens. 2018, 10 (12), 1903; https://doi.org/10.3390/rs10121903

Asner GP and Tupayachi R (2016) Environ. Res. Lett. 12 094004.

Planet Team (2017). Planet Application Program Interface: In Space for Life on Earth. San Francisco, CA. https://api.planet.com

Acknowledgements

We thank the following colleagues for helpful comments: Miles Silman (Wake Forest Univ), Sidney Novoa (ACCA), Ronald Catpo (ACCA), Efrain Samochuallpa (ACCA), Daniela Pogliani (ACCA), Alfredo Cóndor (ACCA), and Lorena Durand (ACCA).

Citation

Finer M, Mamani N (2018) Gold Mining Deforestation at Record High Levels in Southern Peruvian Amazon. MAAP: 96.