MAAP #94: Detecting Logging in the Peruvian Amazon with High Resolution Imagery

Base Map. Logging Activities. Source: ACCA/ACA.

In MAAP # 85, we showed how medium and high-resolution satellites (such as Landsat, Planet and Sentinel-1) could be used to monitor the construction of logging roads in near-real time.

Here, we show the potential of very high-resolution satellites (such as DigitalGlobe and Planet’s Skysat), to identify the activities associated with logging, including illegal logging.

These activities include (see Base Map):
1. Selective logging of high-value trees,
2. Construction of logging roads (access roads),
3. Logging camps
4. Storage and transport

Next, we show a series of very high-resolution images (>50 centimeters), which allow clear identification of these activities.

Note that we show images of both possible legal logging in authorized areas (Images 1,2,5,6,7,9,10) and confirmed illegal logging in unauthorized areas (Images 3,4,8,11,12).*


1. Selective logging of high-value trees

The following images (1-4) show examples of selective logging. Importantly, note that Images 3 and 4 show examples of confirmed illegal logging.

Image 1: Selective logging in a forestry area (Ucayali). Data: DigitalGlobe
Image 2: Selective logging in a forestry area (Ucayali). Data: DigitalGlobe
Image 3: Confirmed illegal logging in unauthorized area. Data: DigitalGlobe
Image 4: Confirmed illegal logging in unauthorized area. Data: DigitalGlobe

2. Construction of logging roads

The following images (5-8) show examples of the construction of logging roads for access to logging areas and subsequent transport of the wood to collection areas. In Image 7, note that it is possible to identify down to the level of logging trucks. Image 8 shows an example of an illegal logging path in an unauthorized area.

Image 5. Logging road (Loreto). Data: DigitalGlobe
Image 6. Logging road (Ucayali). Data: DigitalGlobe
Image 7. Logging road and logging trucks. Data: Skysat (Planet)
Image 8. Illegal logging path. Data: DigitalGlobe

3. Logging camps

The following images (9-12) show examples of logging camps. Note that Images 11 and 12 show illegal camps in unauthorized areas.

Image 9. Logging camp in forestry area (Loreto). Data: DigitalGlobe.
Image 10. Logging camp in forestry area (Ucayali). Data: DigitalGlobe.
Image 11. Illegal logging camp in unauthorized area. Data: DigitalGlobe
Image 12. Illegal logging camp in unauthorized area. Data: DigitalGlobe

4. Storage and transport

The following images (13-15) show examples of large timber storage areas along major rivers, and the subsequent river transport by boat to the sawmills. In Figure 15, note that radar satellites (such as Sentinel-1) can relatively clearly identify timber transport ships.

Image 13. Timber storage area. Data: DigitalGlobe.
Image 14. Timber storage area. Data: DigitalGlobe.
Image 15. Detecting timber transport boats. Data: ESA (Sentinel-1B)

Annex

Before and after images. Here we show some of the images as above, but with an additional panel showing what the area looked like before the logging activity.

Image 1: Selective logging in a forestry area (Ucayali). Data: DigitalGlobe
Image 8. Illegal logging path. Data: DigitalGlobe
Image 10. Logging camp in forestry area (Ucayali). Data: DigitalGlobe.
Image 11. Illegal logging camp in unauthorized area. Data: DigitalGlobe

*Notes

We determined illegal logging by incorporating additional spatial information regarding forestry and conservation areas. Although very high resolution images allow the detection of activities related to selective logging, the determination of the legality of these activities often requires complementary and detailed information from the corresponding government entities.

Citation

Villa L, Finer M (2018) Detecting Logging in the Peruvian Amazon with High Resolution Imagery. MAAP: 94.

MAAP #91: Introducing PeruSAT-1, Peru’s new High-resolution Satellite

PeruSat-1. Credit: Airbus DS

In September 2016, Peru’s first satellite, PeruSAT-1, launched. It is Latin America’s most powerful Earth observation satellite, capturing images at a resolution of 0.70 meters.

The cutting-edge satellite was constructed by Airbus (France) and is now operated by the Peruvian Space Agency, CONIDA.

The organization Amazon Conservation was granted early access to the imagery to boost efforts related to near real-time deforestation monitoring.

Below, we present a series of PeruSAT images that demonstrate their powerful utility in terms of detecting and understanding deforestation in the Peruvian Amazon.


Gold Mining

We have reported extensively on the continuing gold mining deforestation in the southern Peruvian Amazon (see MAAP #87). We are now using PeruSAT to identify active and emerging mining deforestation fronts. For example, in the following images of an active mining zone, it is possible to clearly observe the environmental impact, and identify mining camps and wastewater pools.

PeruSAT-1 image of active gold mining. Data: ®CONIDA (2018), Distribution CONIDA, Peru; All rights reserved.
PeruSAT-1 image (zoom) of active gold mining. Data: ®CONIDA (2018), Distribution CONIDA, Peru; All rights reserved.

Agricultural Expansion

The following image shows a papaya plantation that appeared after a recent deforestation event near the Interoceanic highway in the southern Peruvian Amazon (Mavila, Madre de Dios). See MAAP #42 for more details on papaya emerging as new deforestation driver in this area.

PeruSAT-1 image of papaya plantation. Data: ®CONIDA (2018), Distribution CONIDA, Peru; All rights reserved.

Logging Roads

The following image shows, in high-resolution, a new logging road crossing primary forest in the southern Peruvian Amazon (district of Iñapari, Madre de Dios).

PeruSAT-1 image of logging road. Data: ®CONIDA (2018), Distribution CONIDA, Peru; All rights reserved.

Citation

Villa L, Finer M (2018) Introducing PeruSAT-1, Peru’s new High-resolution Satellite. MAAP: 91.

MAAP #90: Using Drones to monitor Deforestation and Illegal Logging

Drone types: helipcopter and fixed-wing (plane)

For the past three years, the organization Amazon Conservation has been working to establish a sustainable, local-based drones program for environmental monitoring in the southern Peruvian Amazon (Madre de Dios region).

This program is based on two types of drones, multi-rotor (helicopter style) and fixed-wing (airplane style).

One of the main objectives is to improve the near real-time monitoring of deforestation and illegal logging.

The monitoring is currently focused on three priority areas: 1) Brazil nut concessions, 2) forestry concessions of the local association ACOMAT, and 3) along the Interoceanic Highway (see Base Map).

Below, we show a series of drone images that we have used to identify the drivers of recent deforestation events. These drivers include gold mining, agriculture, illegal logging, cattle pasture, and natural forest loss.

Base Map. Priority areas of the Amazon Conservation drones initiative.

Interoceanic Highway

In March 2018, in collaboration with the organization ProPurús, we realized drone flights along the Interoceanic Highway in an effort to demonstrate the possible threats of building a new road along the border with Brazil (see MAAP #76). The following images show the two main threats to the area: gold mining and small/medium-scale agriculture (<50 hectares).

A. Drone image: gold mining.
B. Drone image: Deforestation from agriculture (corn)

Brazil Nut Concessions

In 2018, Amazon Conservation launched a new project, funded by Google Challenge, to develop a monitoring program for Brazil nut concessions covering a million hectares (2.47 million acres) in southern Peru. For example, the following image shows the invasion of a papaya plantation that caused the recent deforestation of five acres inside a concession.

C. Drone image: Invasión of papaya in Brazil nut concession.

ACOMAT Forestry Concessions

Since 2017, Amazon Conservation has been working on a project, financed by the Norwegian Agency for Development Cooperation (NORAD), to improve the monitoring of forest concessions of the local association ACOMAT (Association of Timber and Non-Timber Forest Concessionaires of the Provinces from Manu and Tambopata). The following images show examples of forest loss and degradation due to illegal logging, cattle grazing, natural loss (windstorm), and gold mining.

D. Drone image: illegal logging.
E. Drone image: cattle pasture.
F. Drone image: natural forest loss from windstorm.
G. Drone image: gold mining.

Citation

Garcia R, Novoa S, Castañeda C, Rengifo P, Jimenez M, Finer M (2018) Using Drones to monitor Deforestation and Illegal Logging. MAAP: 90.

MAAP #84: New Threats to the Peruvian Amazon (Part 1: Yurimaguas-Jeberos Road)

Image A: New Yurimaguas-Jeberos road crossing primary forest. Data: Planet

The efforts and international commitments of the Peruvian Government to reduce deforestation may be compromised by new projects do not have adequate environmental assessment.

In this series, we address the most urgent of these projects, those that threaten large areas of primary Amazonian forest.

We believe that these projects require urgent attention from both government and civil society to ensure an adequate response and avoid irreversible damage. For example, in the case below, it is not known whether there is an environmental impact study.

The first report of this series focuses on a new road (Jeberos – Yurimaguas) that threatens a large expanse of primary forest in the northern Peruvian Amazon (see Image A).


Yurimaguas-Jeberos Road

Image B. Data: GLAD/UMD, PNCB/MINAM, Hansen/UMD/Google/USGS/NASA

Early warning forest loss alerts (GLAD alerts from the University of Maryland and Global Forest Watch) have detected the construction of a new road between the city of Yurimaguas and the town of Jeberos, in southern Loreto region (see Image B).

We estimate that the new road is 65 km (40 miles). In the image, the arrows indicate part of the route crossing primary forest (indicated in dark green).

Although the road improves the connectivity of an isolated town, the problem is that much of it crosses primary Amazon forest and may trigger massive deforestation. It is well documented that roads are one of the main drivers of deforestation in the Amazon (see MAAP #76).

In addition, most of the route crosses “Permanent Production Forest“, a legal land classification restricted to forestry activities, not agriculture or infrastructure (Image D). The route also crosses a regional conservation priority site (Image D).

It is important to note that the Regional Government of Loreto, which is promoting and financing the project, specifically said in a press statement that the road will “encourage the expansion of the agricultural and livestock frontier in this part of the region.” That phrase can be interpreted as frankly stating that the road will cause extensive deforestation. It is a particularly troubling scenario given that Yurimaguas is already a deforestation hotspot.


Image C shows the beginning of road construction between August 2017 (left panel) and April 2018 (right panel).

Image C. Road construction. Data: Planet.

Image D shows how the road crosses Permanent Production Forest and a regional conservation priority site.

Image D. Data: GOREL, MINAGRI, MAAP

Citation

Finer M, Mamani N (2018) New Threats to the Peruvian Amazon (Part 1: Yurimaguas-Jeberos Road). MAAP: 84.

MAAP #76: Proposed Road would cross Primary Forest along Peru-Brazil Border

Image 76a. Base Map. Data: Mosaic of 16 images from Sentinel-2/ESA, July 2017

In December 2017, the Peruvian Congress approved a bill that declared it in the national interest to construct new roads in the border zone of Ucayali region, which shares a remote border with Brazil.

The main proposed road in this border area would cover 172 miles and connect the towns of Puerto Esperanza and Iñapari, in the Ucayali and Madre de Dios regions, respectively. Image 76a, a mosaic of satellite images from July 2017, illustrates just how remote and intact is the area surrounding the proposed road route.

Indigenous organizations and the Ministry of Culture have warned that the road would have major impacts on the indigenous peoples in voluntary isolation that are documented to inhabit parts of this remote area.

In this report, we add new information that complements the evaluation of possible impacts by calculating how much primary forest would be threatened as a result of road construction. We found that around 680,000 acres (275,00 hectares) of primary forest are at risk. Much of this area is within protected areas and a reserve for isolated indigenous groups.


Primary Forest

Image 76b. Data: GLCF/GSFC 2014, Hansen/UMD/Google/USGS/NASA, UMD/GLAD, PNCB/MINAM, UAC/ProPurús, SERNANP

We generated a primary forest layer based on existing satellite-based forest cover and forest loss data (see Methodology section for more details). We define primary forest as areas with intact forest cover dating back to the earliest available satellite-based data, 1990 in this case.

Image 76b shows the major results:

  • Virtually the entire route (172 miles; 277 km) crosses primary forest (dark green). Note the proliferation of forest roads in recent years around Iñapari (red lines).
  • The road would cross 3 critical protected areas and indigenous reserves: Madre de Dios Territorial Reserve, Alto Purús National Park, and Purús Communal Reserve.


Primary Forest at Risk

Imagen 76c. GLCF/GSFC 2014, Hansen/UMD/Google/USGS/NASA, UMD/GLAD, PNCB/MINAM, UAC/ProPurús

The Interoceanic Highway, the main existing road in the area, has experienced substantial deforestation within 5 km* along the length of its route (Image 76c).

Using this estimate of impact range (10 km), we calculated that at least 274,727 hectares of primary forest would be at risk if this road is constructed.

*We estimate that approximately 80% of forest loss has occurred in a 5 km radius on both sides of the Interoceanic highway.


Methodology

To generate our primary forest layer, we combined three satellite-based data sources. As baseline, we used data from the Global Land Cover Facility (2014), which identifies forest cover as of 1990. We also used this dataset to remove areas with detected forest cover change between 1990 and 2000. Next, we removed areas with detected forest loss between 2001 – 2017 identified by Hansen/UMD/Google/USGS/NASA (Hansen et al 2013) and early warning data from GLAD alerts and the National Program of Forest Conservation of the Peruvian Environment Ministry (PNBC-MINAM). As a result, combining all datasets, this methodology defines primary forest as area with intact forest from the first available satellite-based data, 1990, until 2017.

Global Land Cover Facility (GLCF) and Goddard Space Flight Center (GSFC). 2014. GLCF Forest Cover Change 2000, 2005, Global Land Cover Facility,University of Maryland, College Park.

Hansen MC et al. 2013. High-Resolution Global Maps of 21st-Century Forest Cover Change. Science 342: 850–53.

Citation

Finer M, Novoa S (2018) Proposed Road would cross Primary Forest along Peru-Brazil Border. MAAP: 76.

MAAP #75: Pope to visit Madre de Dios, region with Deforestation Crisis (Peru)

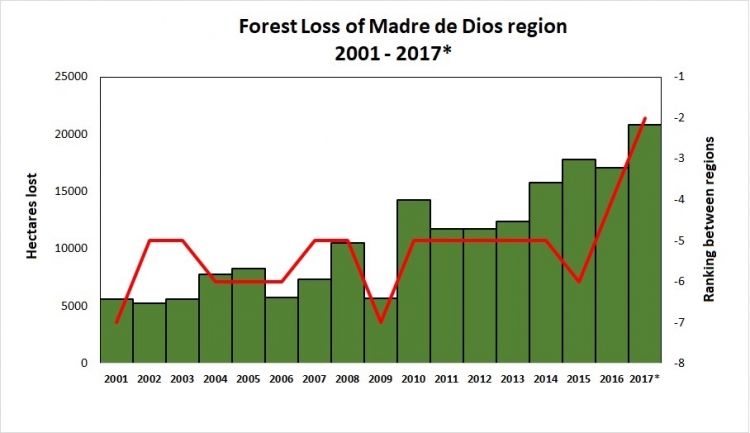
Table 76. Data: PNBC/MINAM (2001-16), UMD/GLAD (2017, until the first week of November).

Pope Francis, as part of his upcoming visit to Peru in January, will visit the Madre de Dios region in the southern Peruvian Amazon. He is expected to address issues facing the Amazon and its indigenous communities, including deforestation.

In this article, we show that Madre de Dios is experiencing a deforestation crisis, due mainly to impacts from gold mining, small-scale agriculture, and roads.

Table 76 shows the increasing trend of annual forest loss since 2001, peaking in 2017. In fact, in 2017 forest loss exceeded 20,000 hectares (49,000 acres) for the first time, doubling the loss in 2008.*

The table also shows the ranking of Madre de Dios in respect to the annual forest loss compared to all other regions of the Peruvian Amazon (see red line). For the first time, Madre de Dios is the region with the second highest forest loss total, behind only Ucayali.

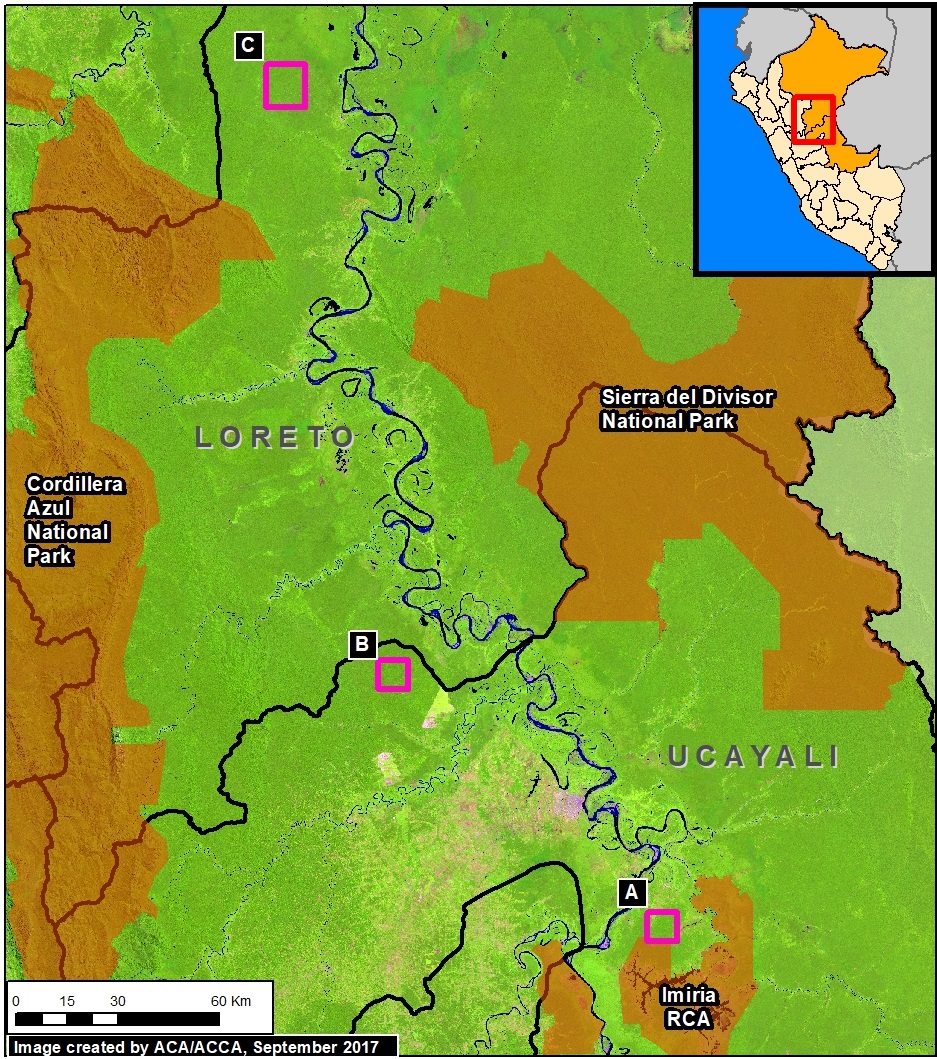
Next, we present a map of deforestation hotspots in Madre de Dios in 2017, along with satellite images of a number of the most intense hotspots.

*The total estimated forest loss in 2017 was based on early warnings alerts generated by the University of Maryland (GLAD alerts) and the Peruvian Environment Ministry (PNCB/MINAM). The estimate is 20,826 hectares as of the first week of November.

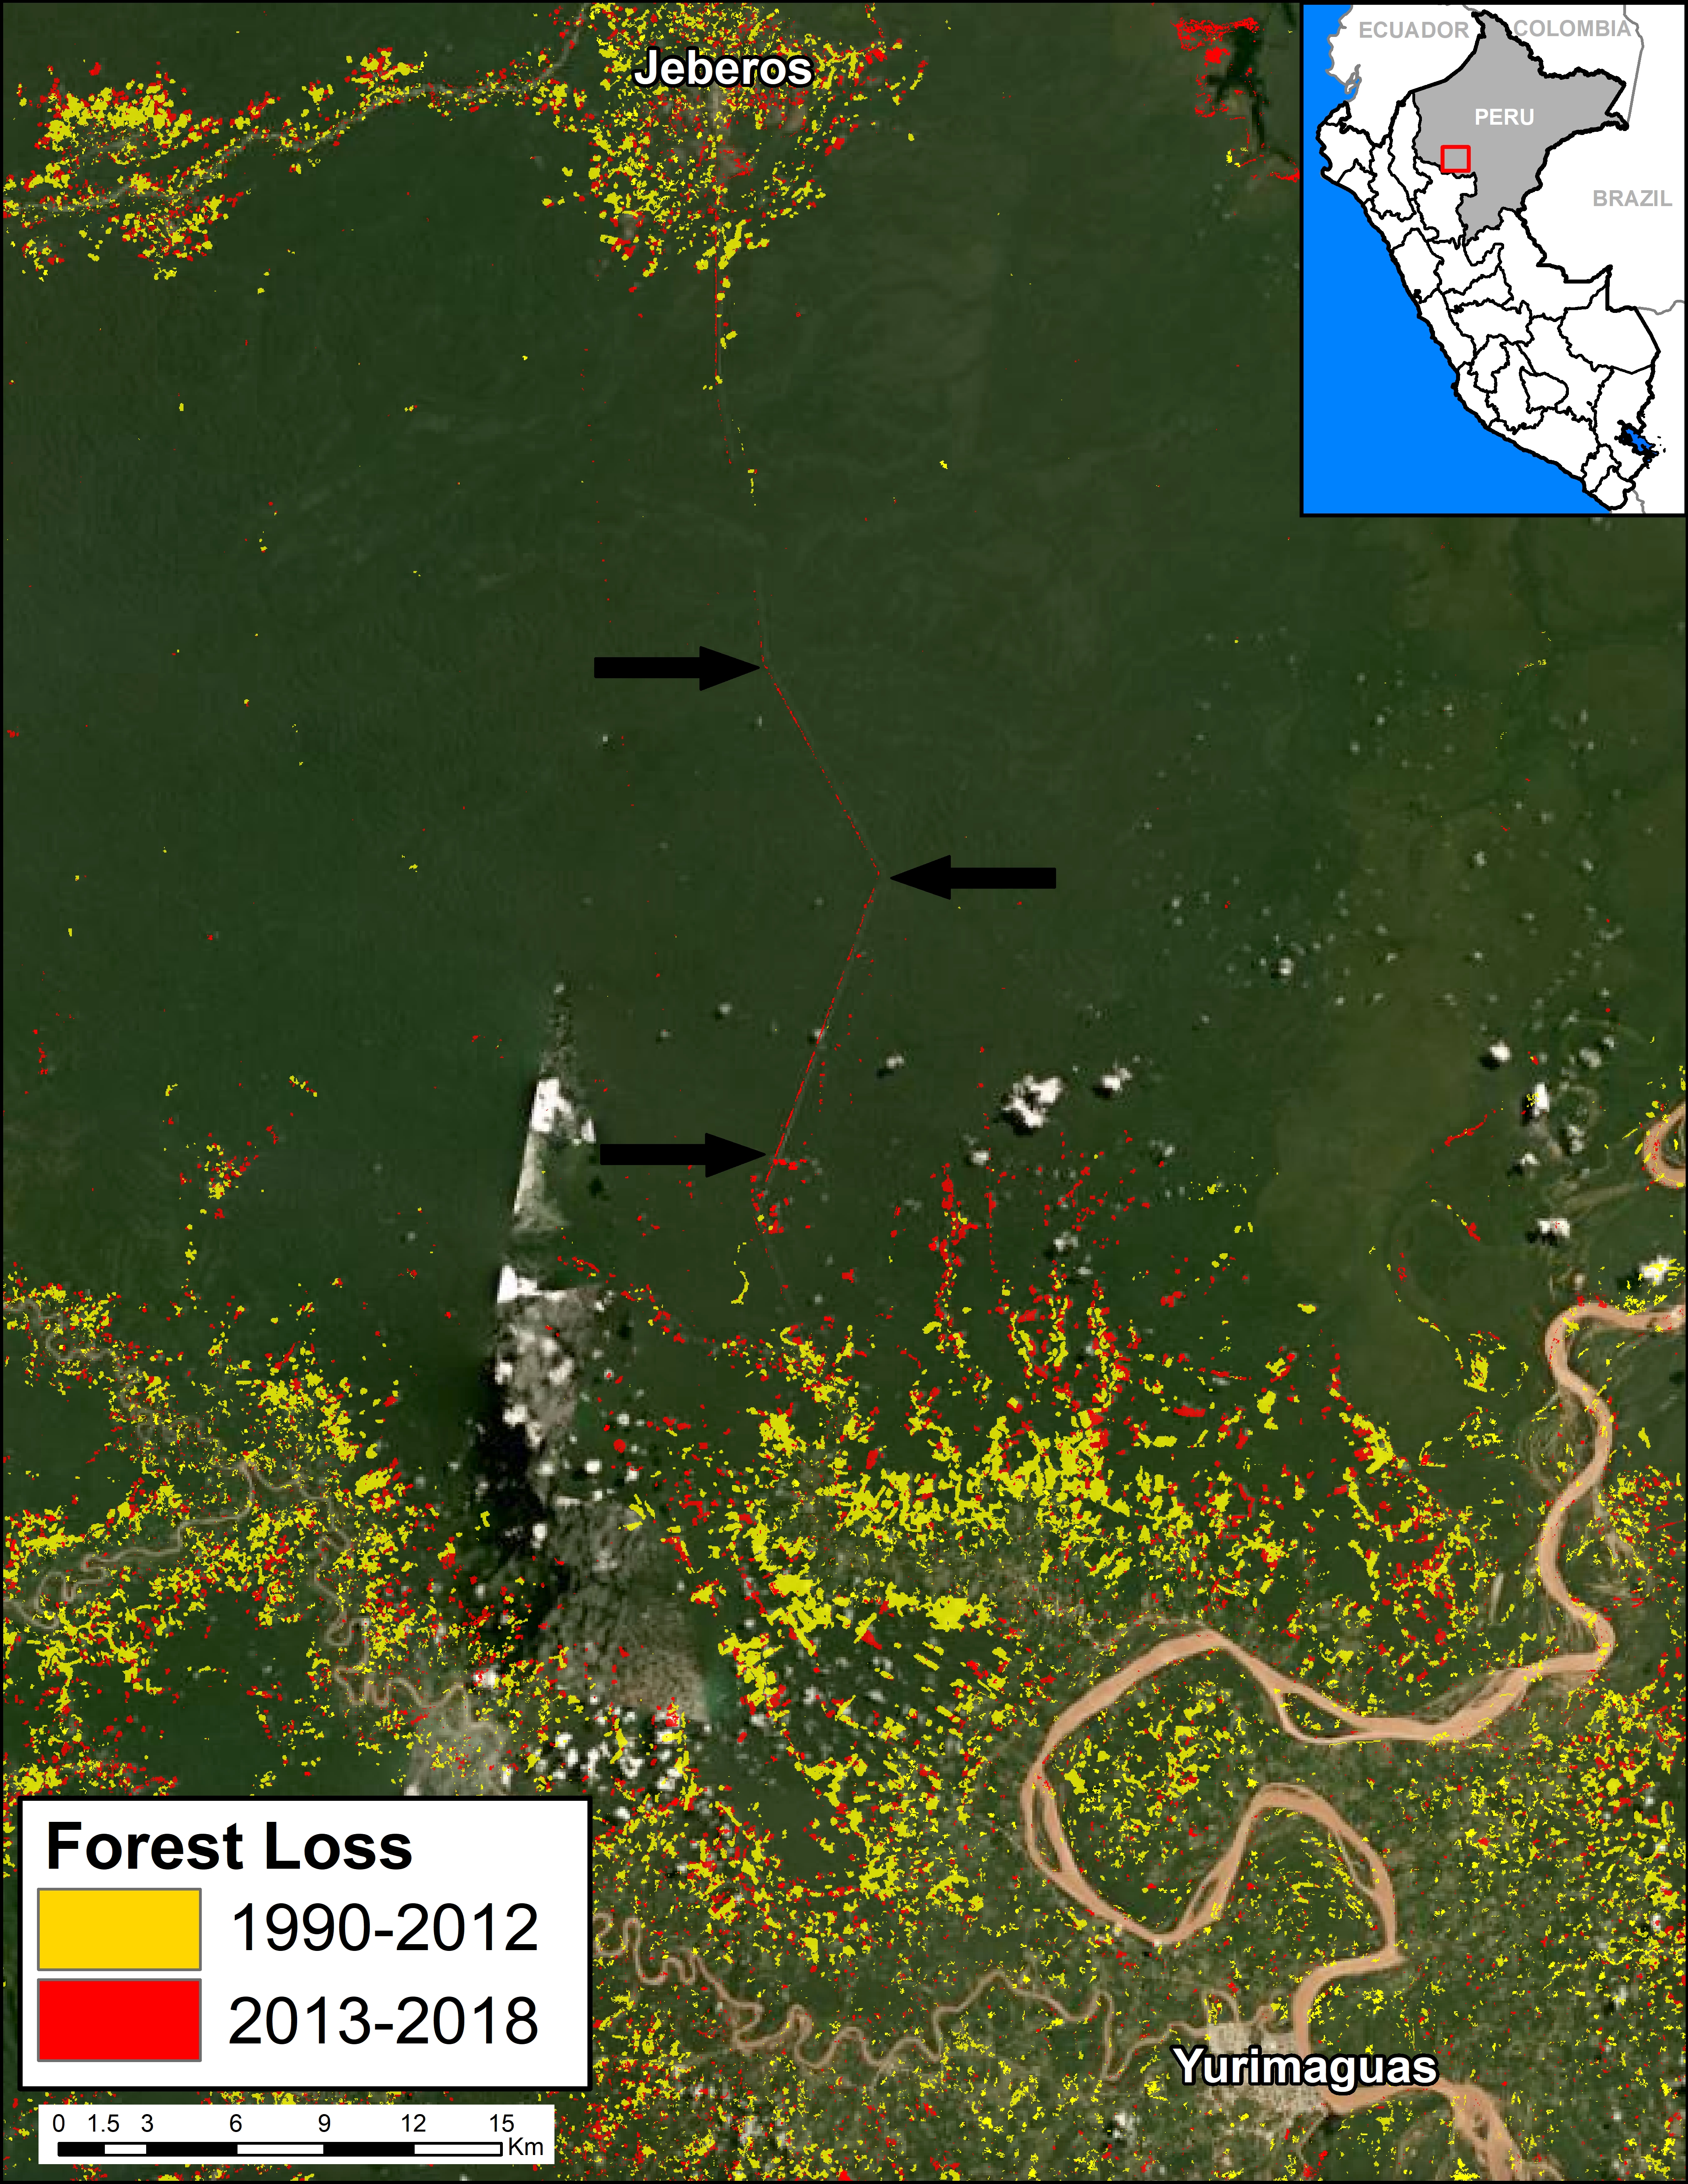
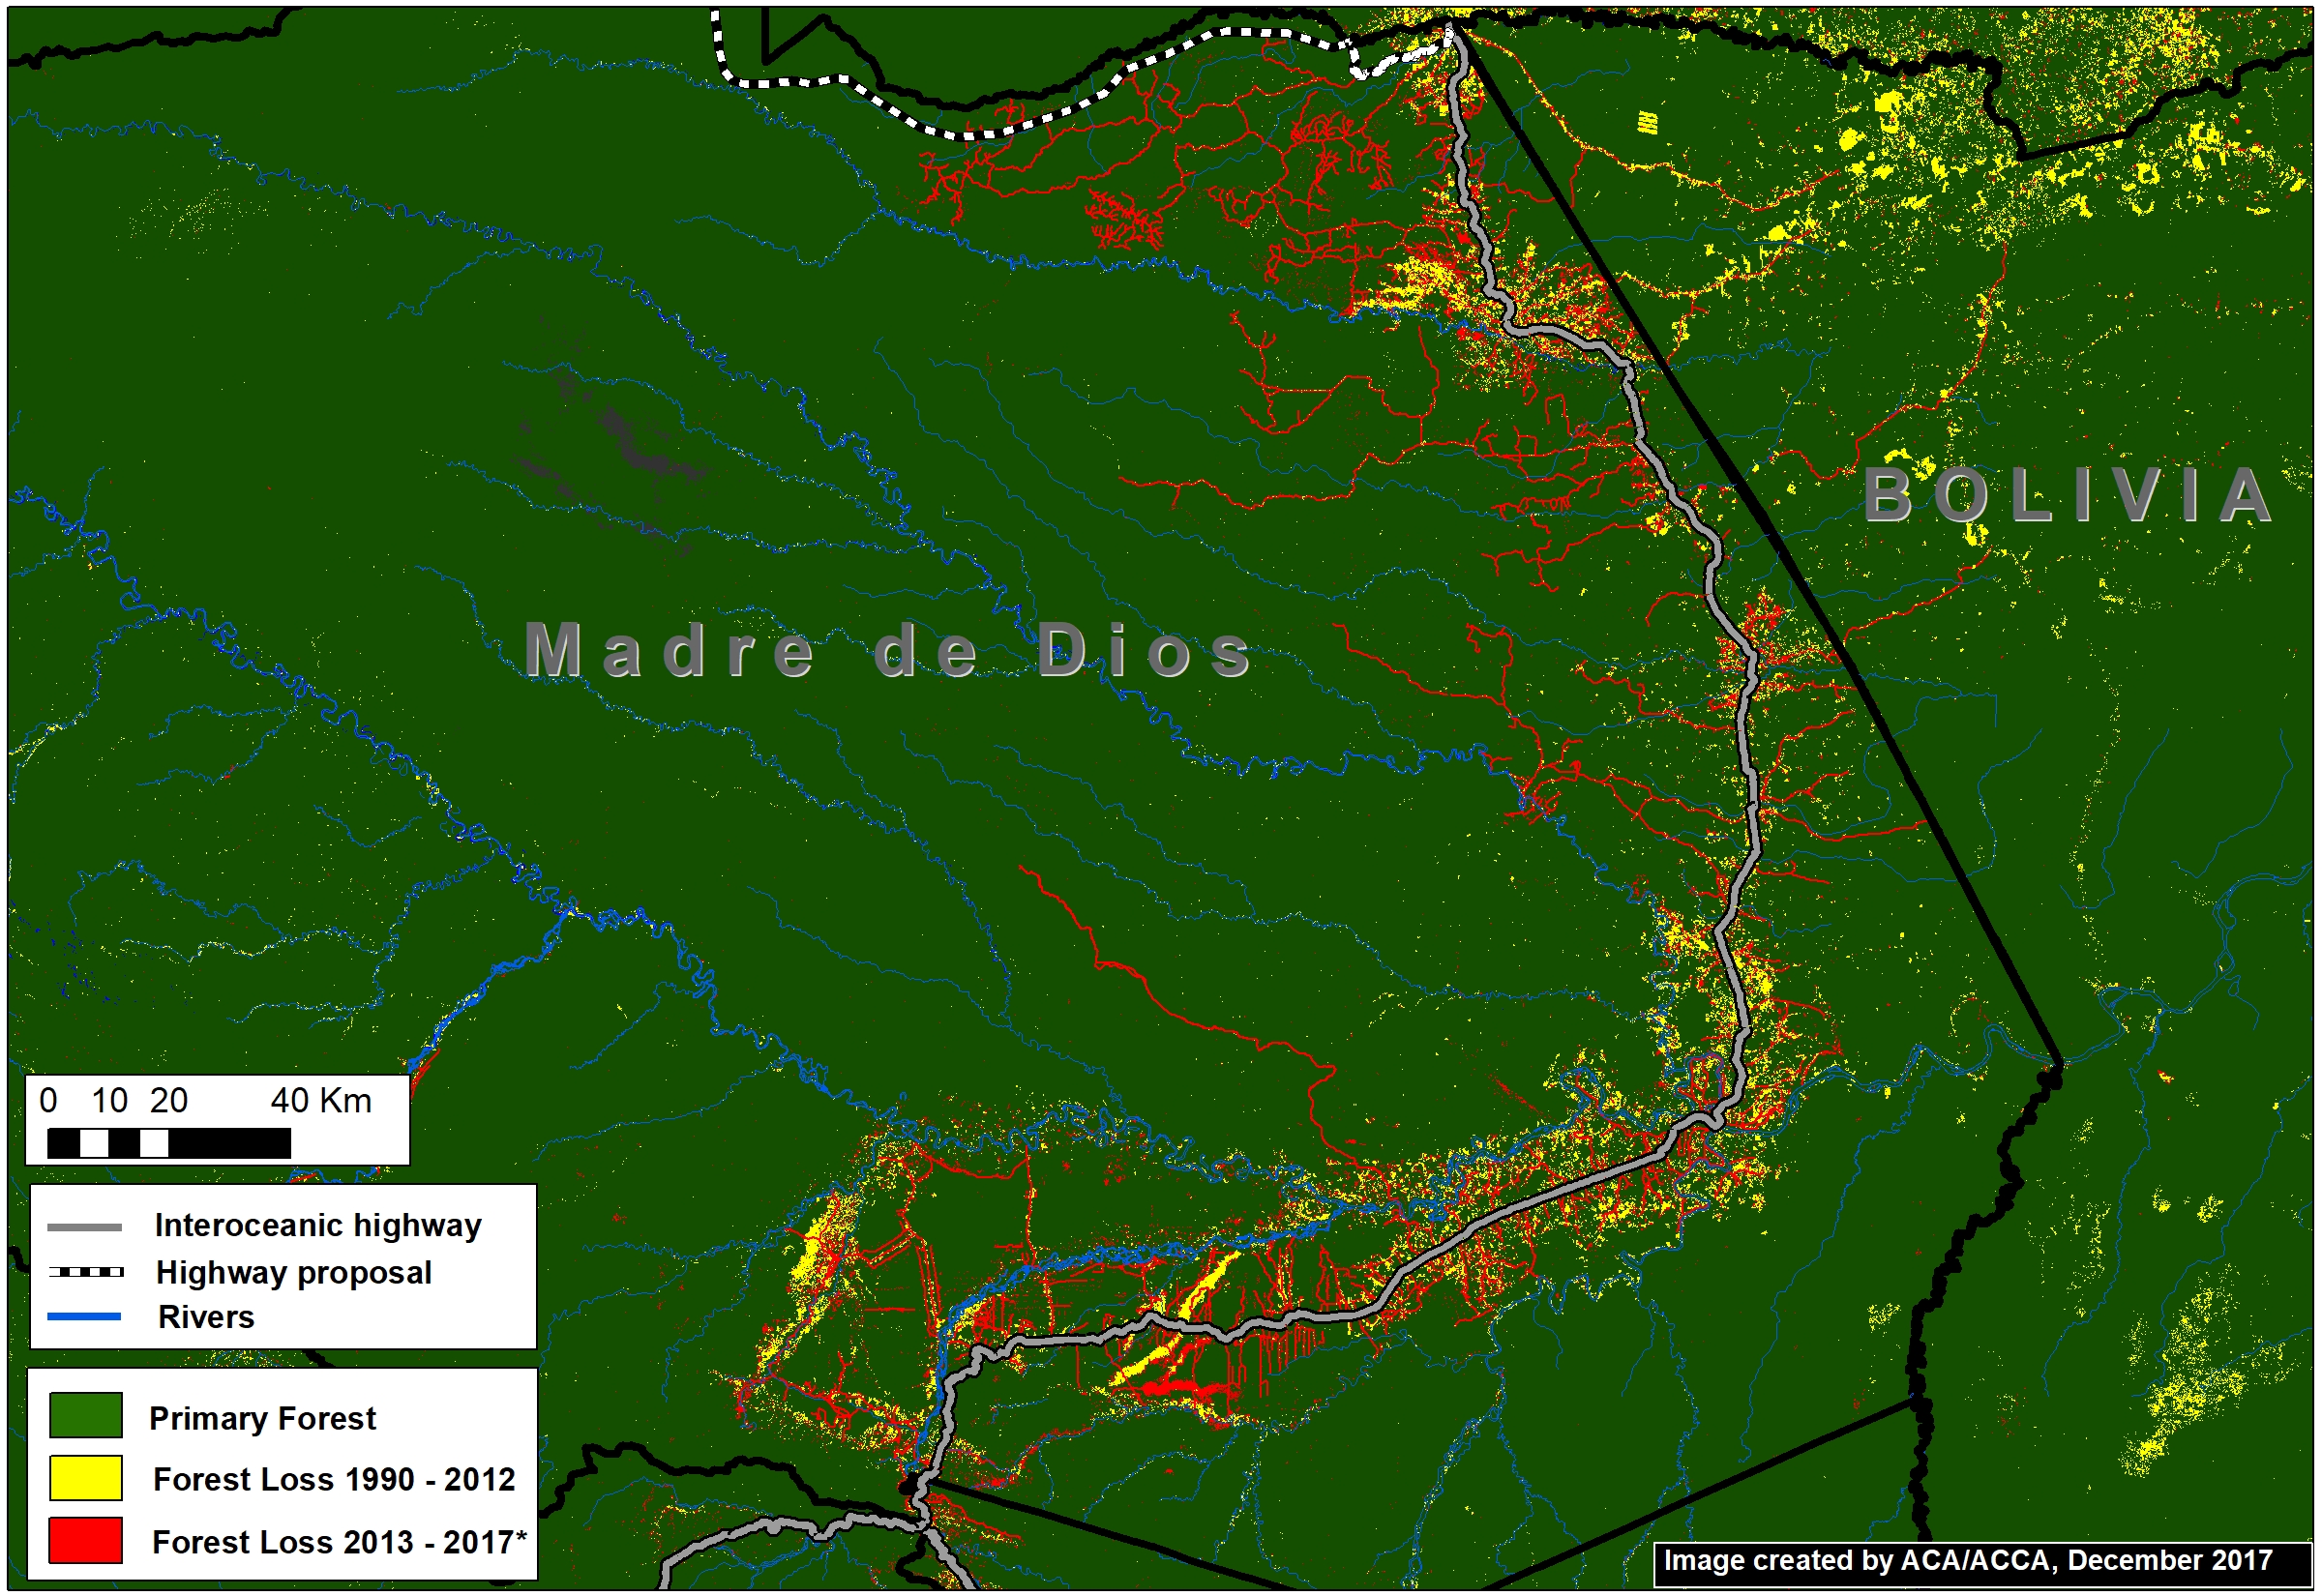
Deforestation Hotspots in Madre de Dios

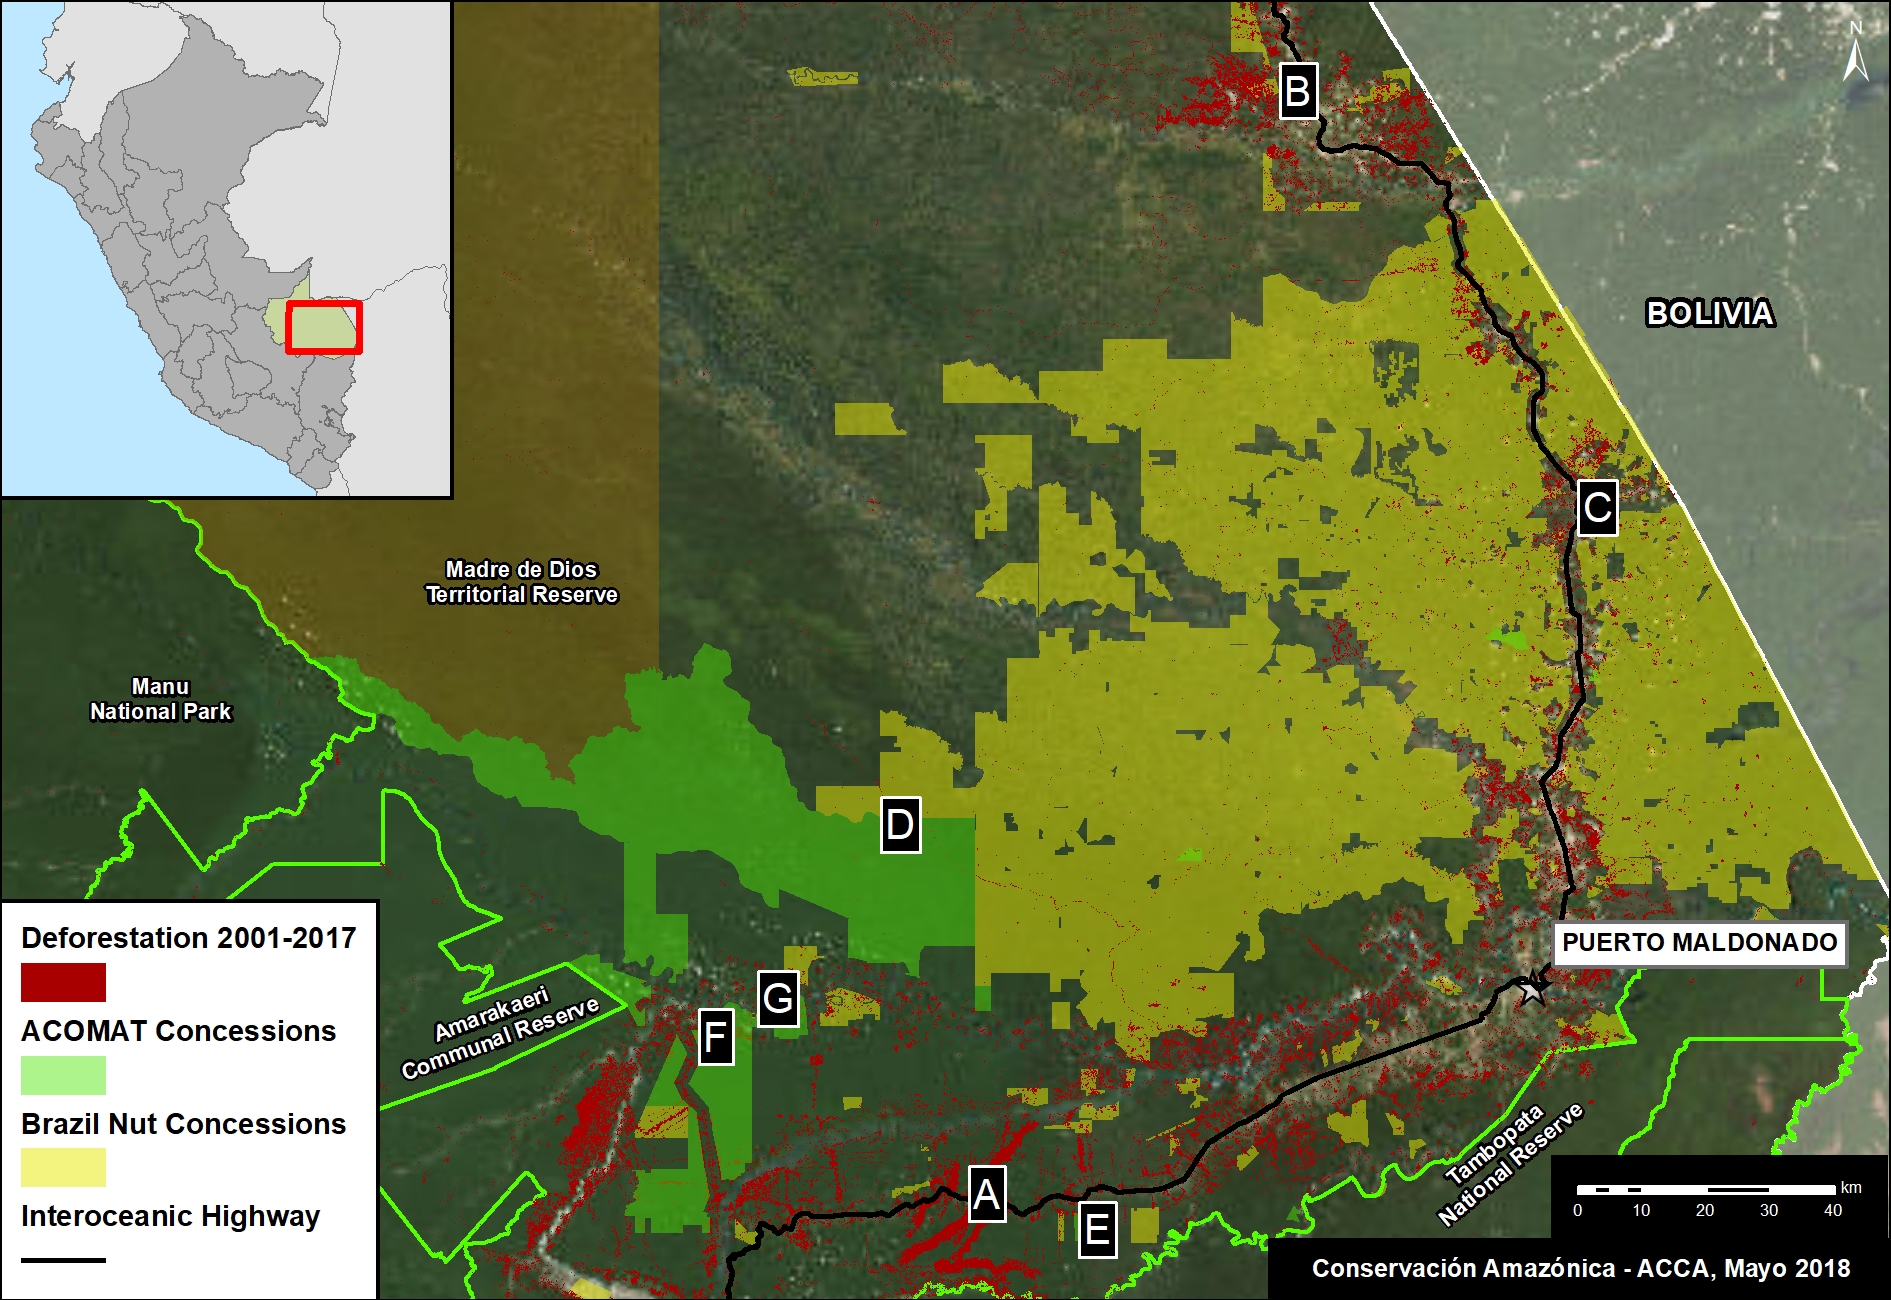
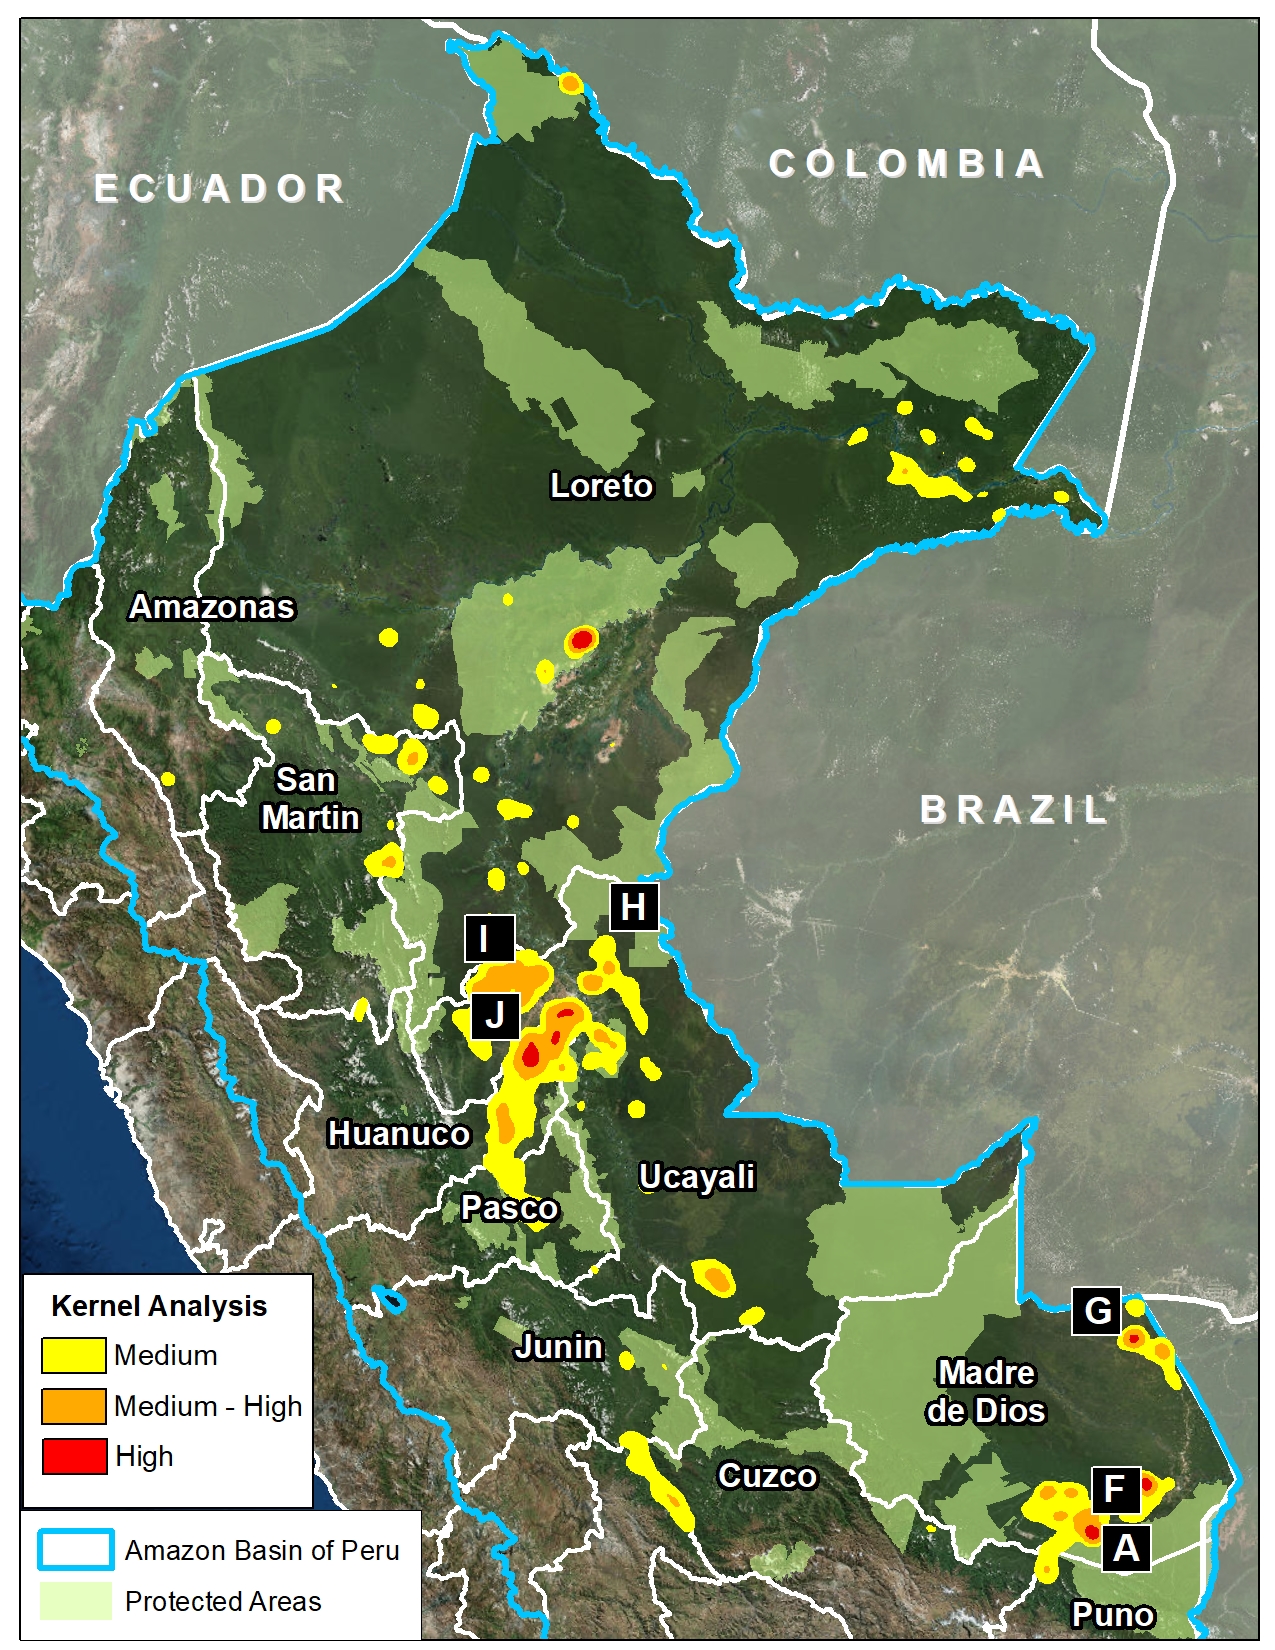
Image 76 shows a map of deforestation hotspots in Madre de Dios in 2017, based on early warning forest loss data. The colors yellow (low), orange (medium/high), and red (very high) correspond to the areas with the highest concentration of alerts, i.e. the main deforestation hotspots of 2017. Note how the majority of the forest loss is concentrated along the recently paved Interoceanic highway.

Next, we show satellite imagery for 7 hotspots (Insets A-G) that together account for the deforestation of 6,000 hectares (15,000 acres). We show that the main deforestation drivers are gold mining and small-scale agriculture.

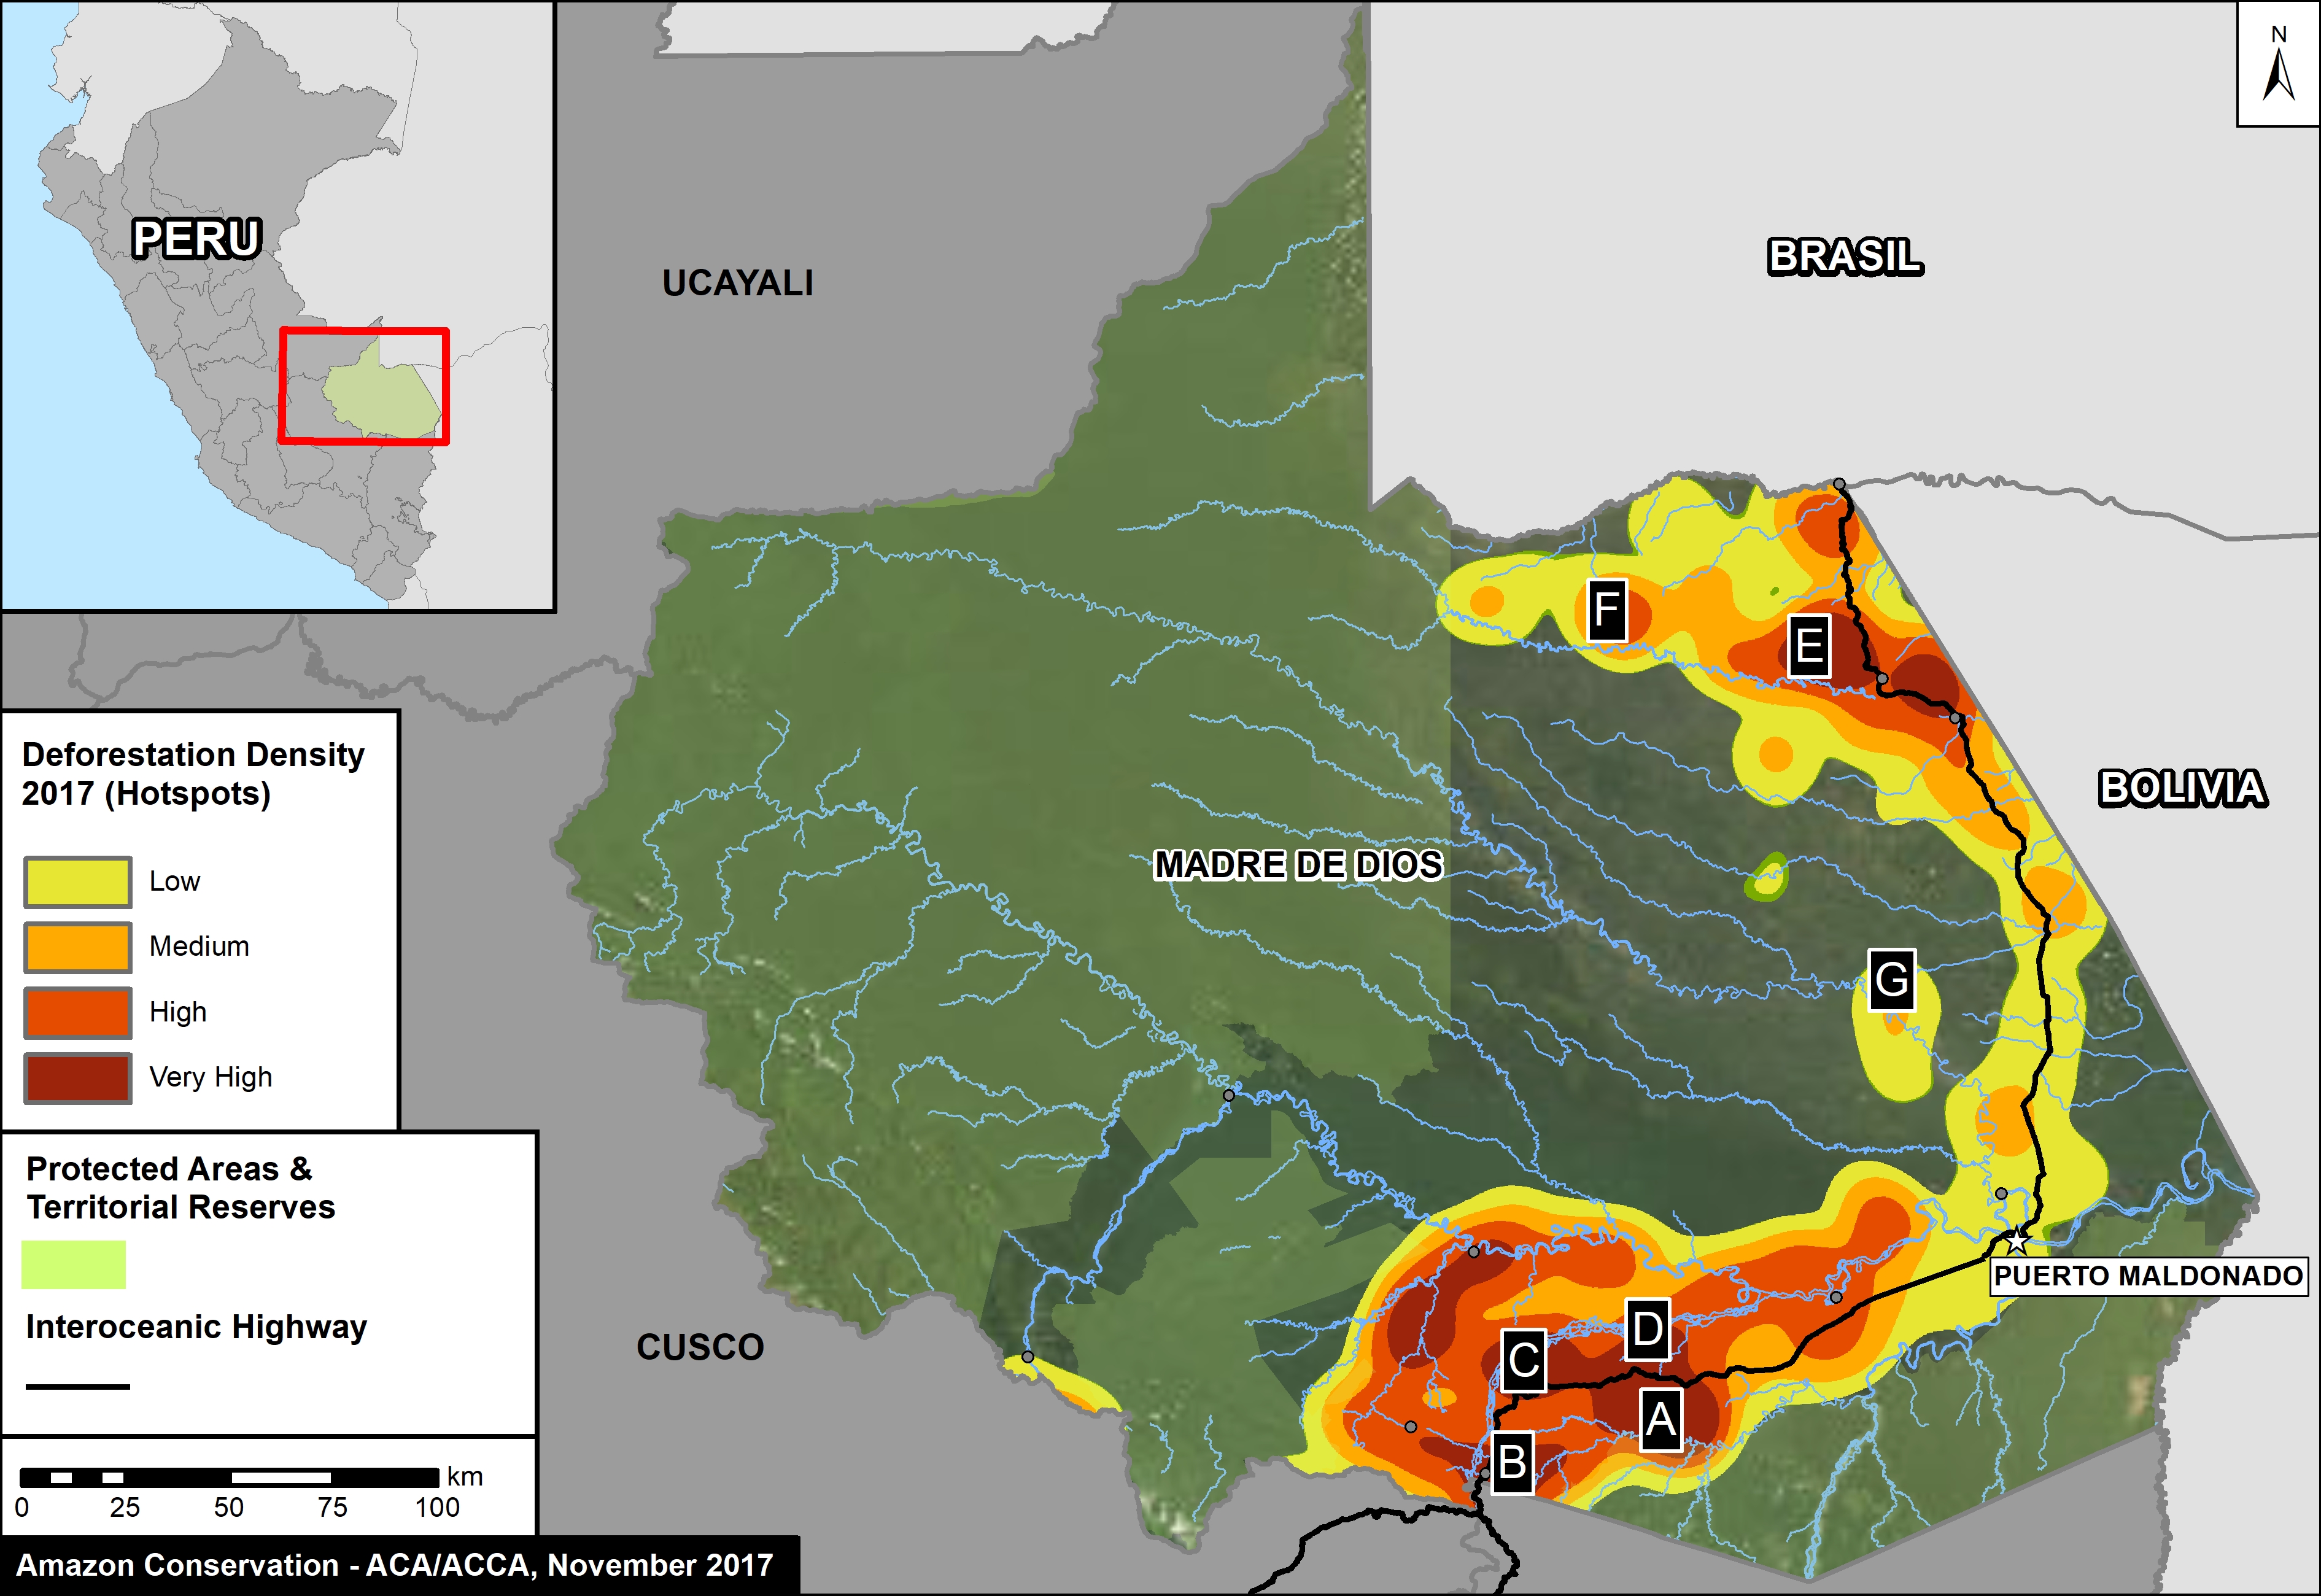
Image 76. Base Map of Hotspots in Madre de Dios in 2017. Data: PNBC/MINAM, UMD/GLAD
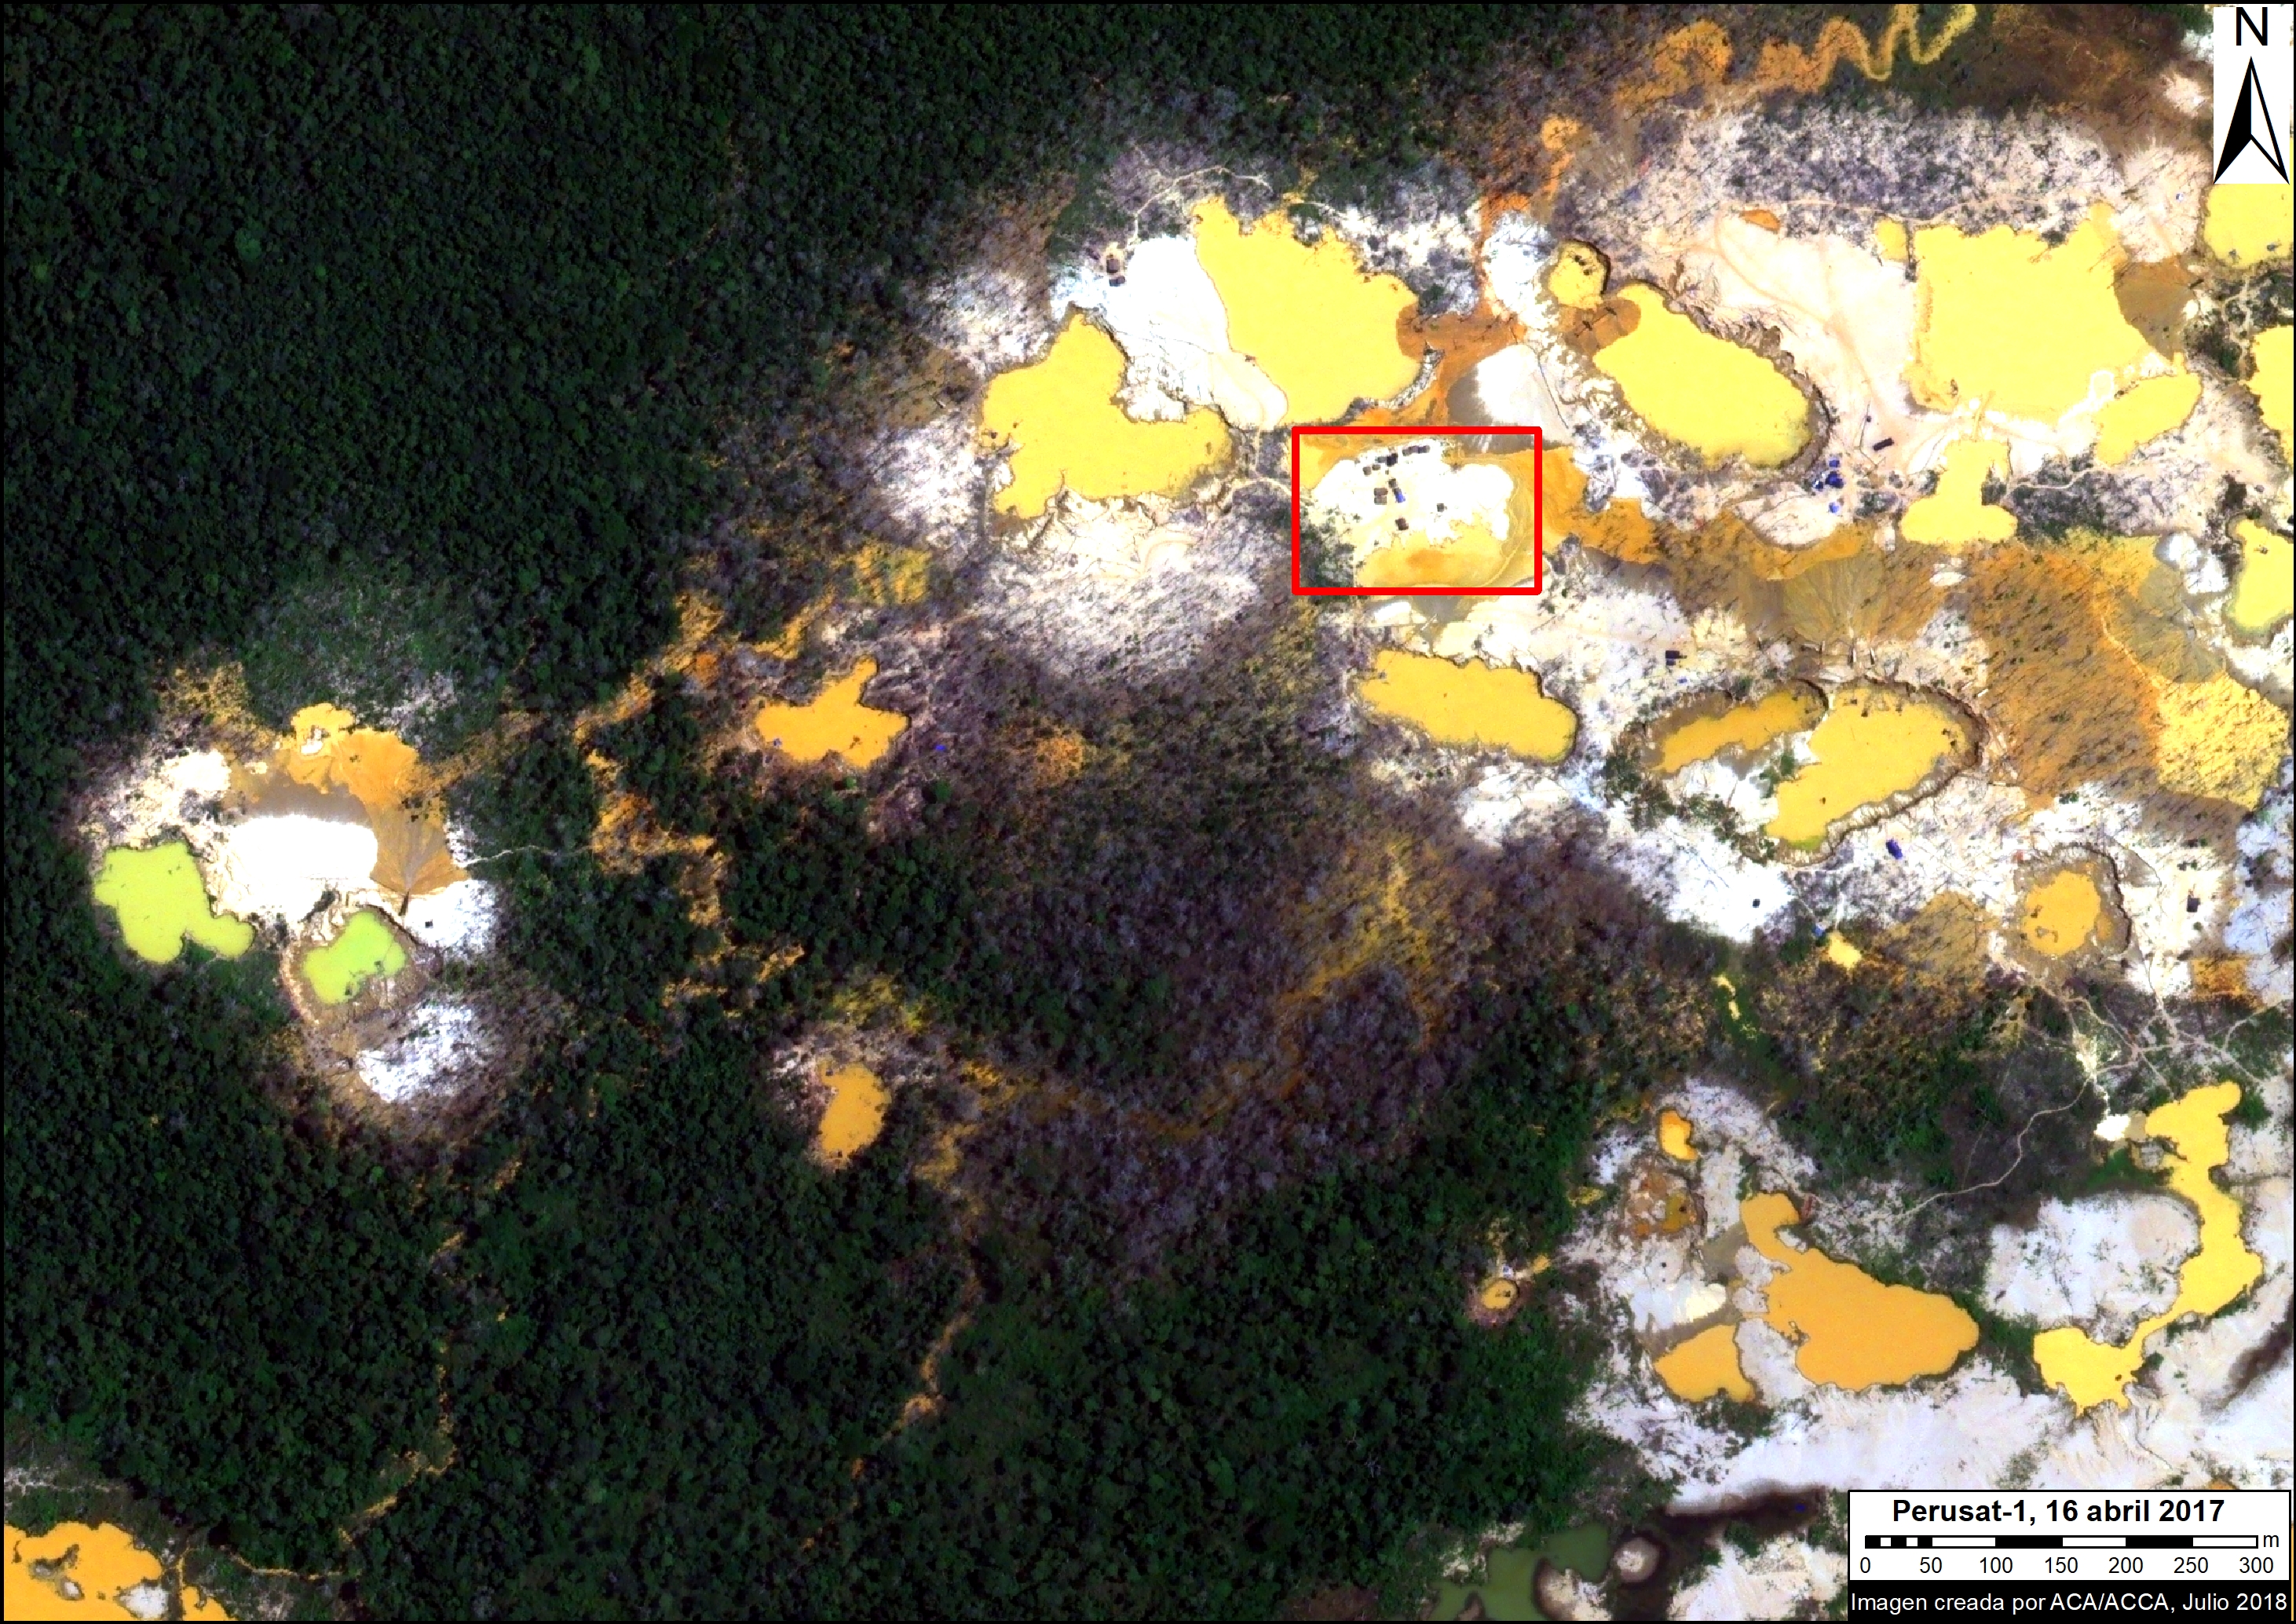
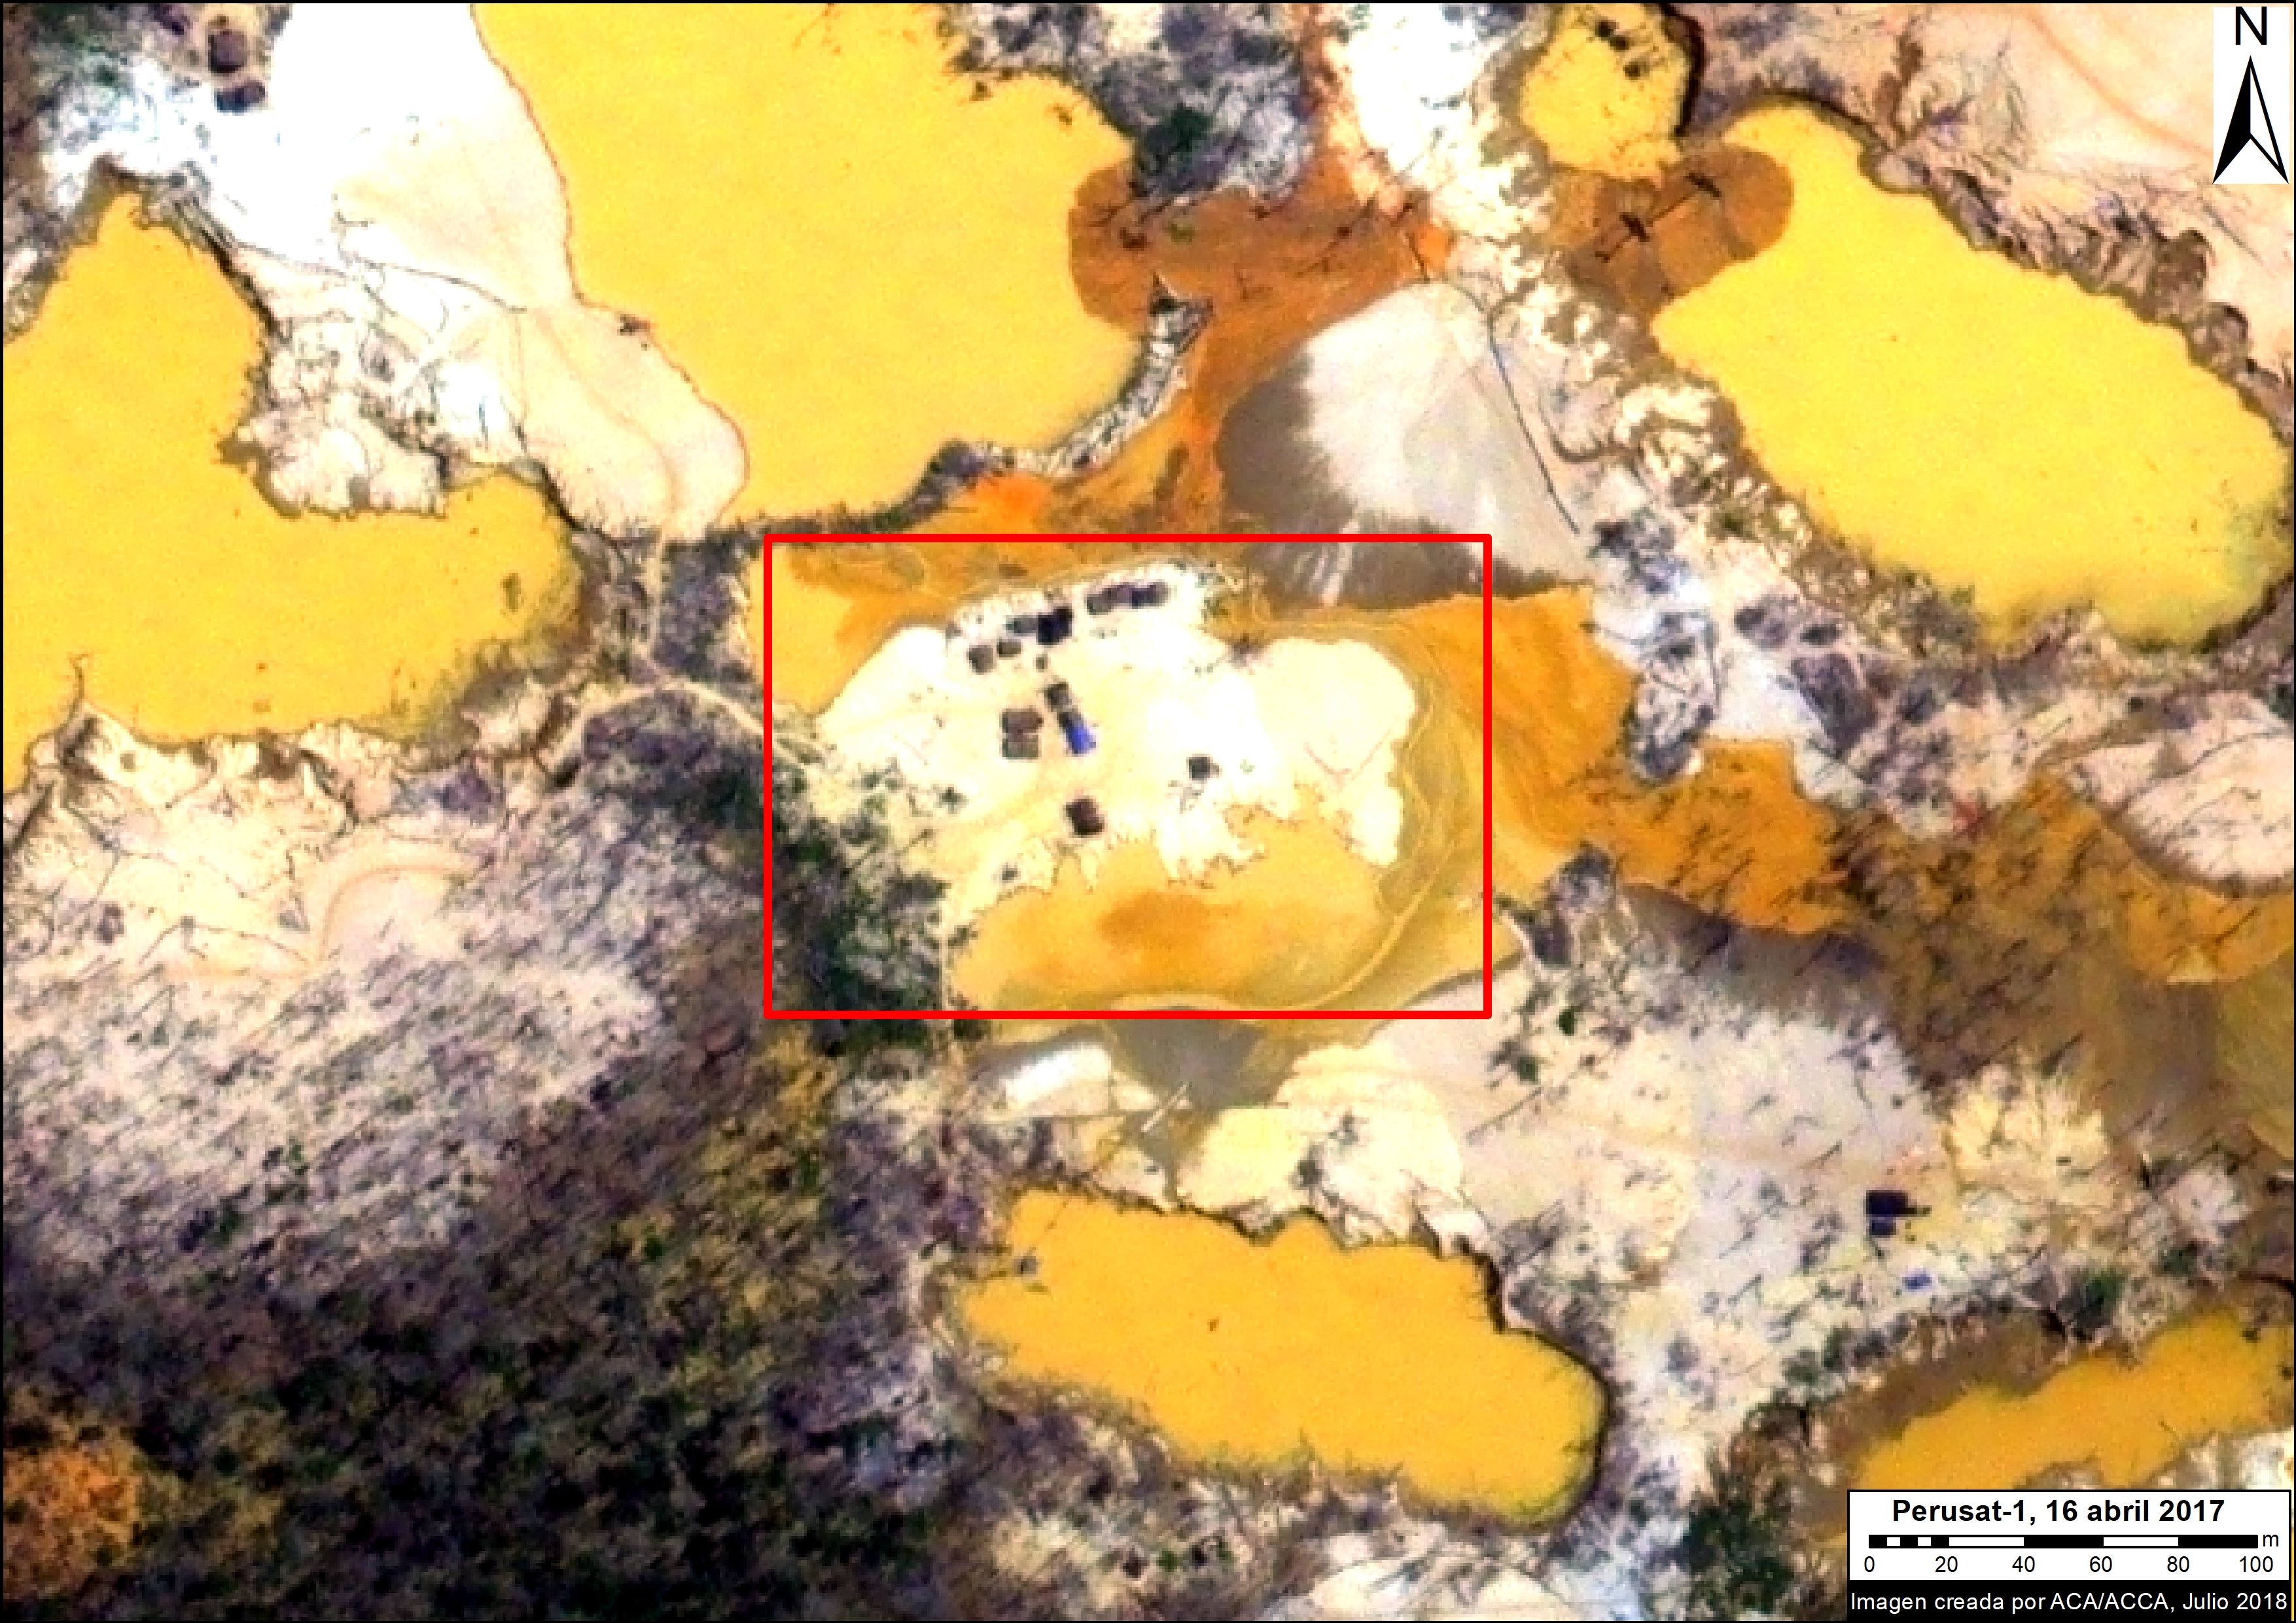
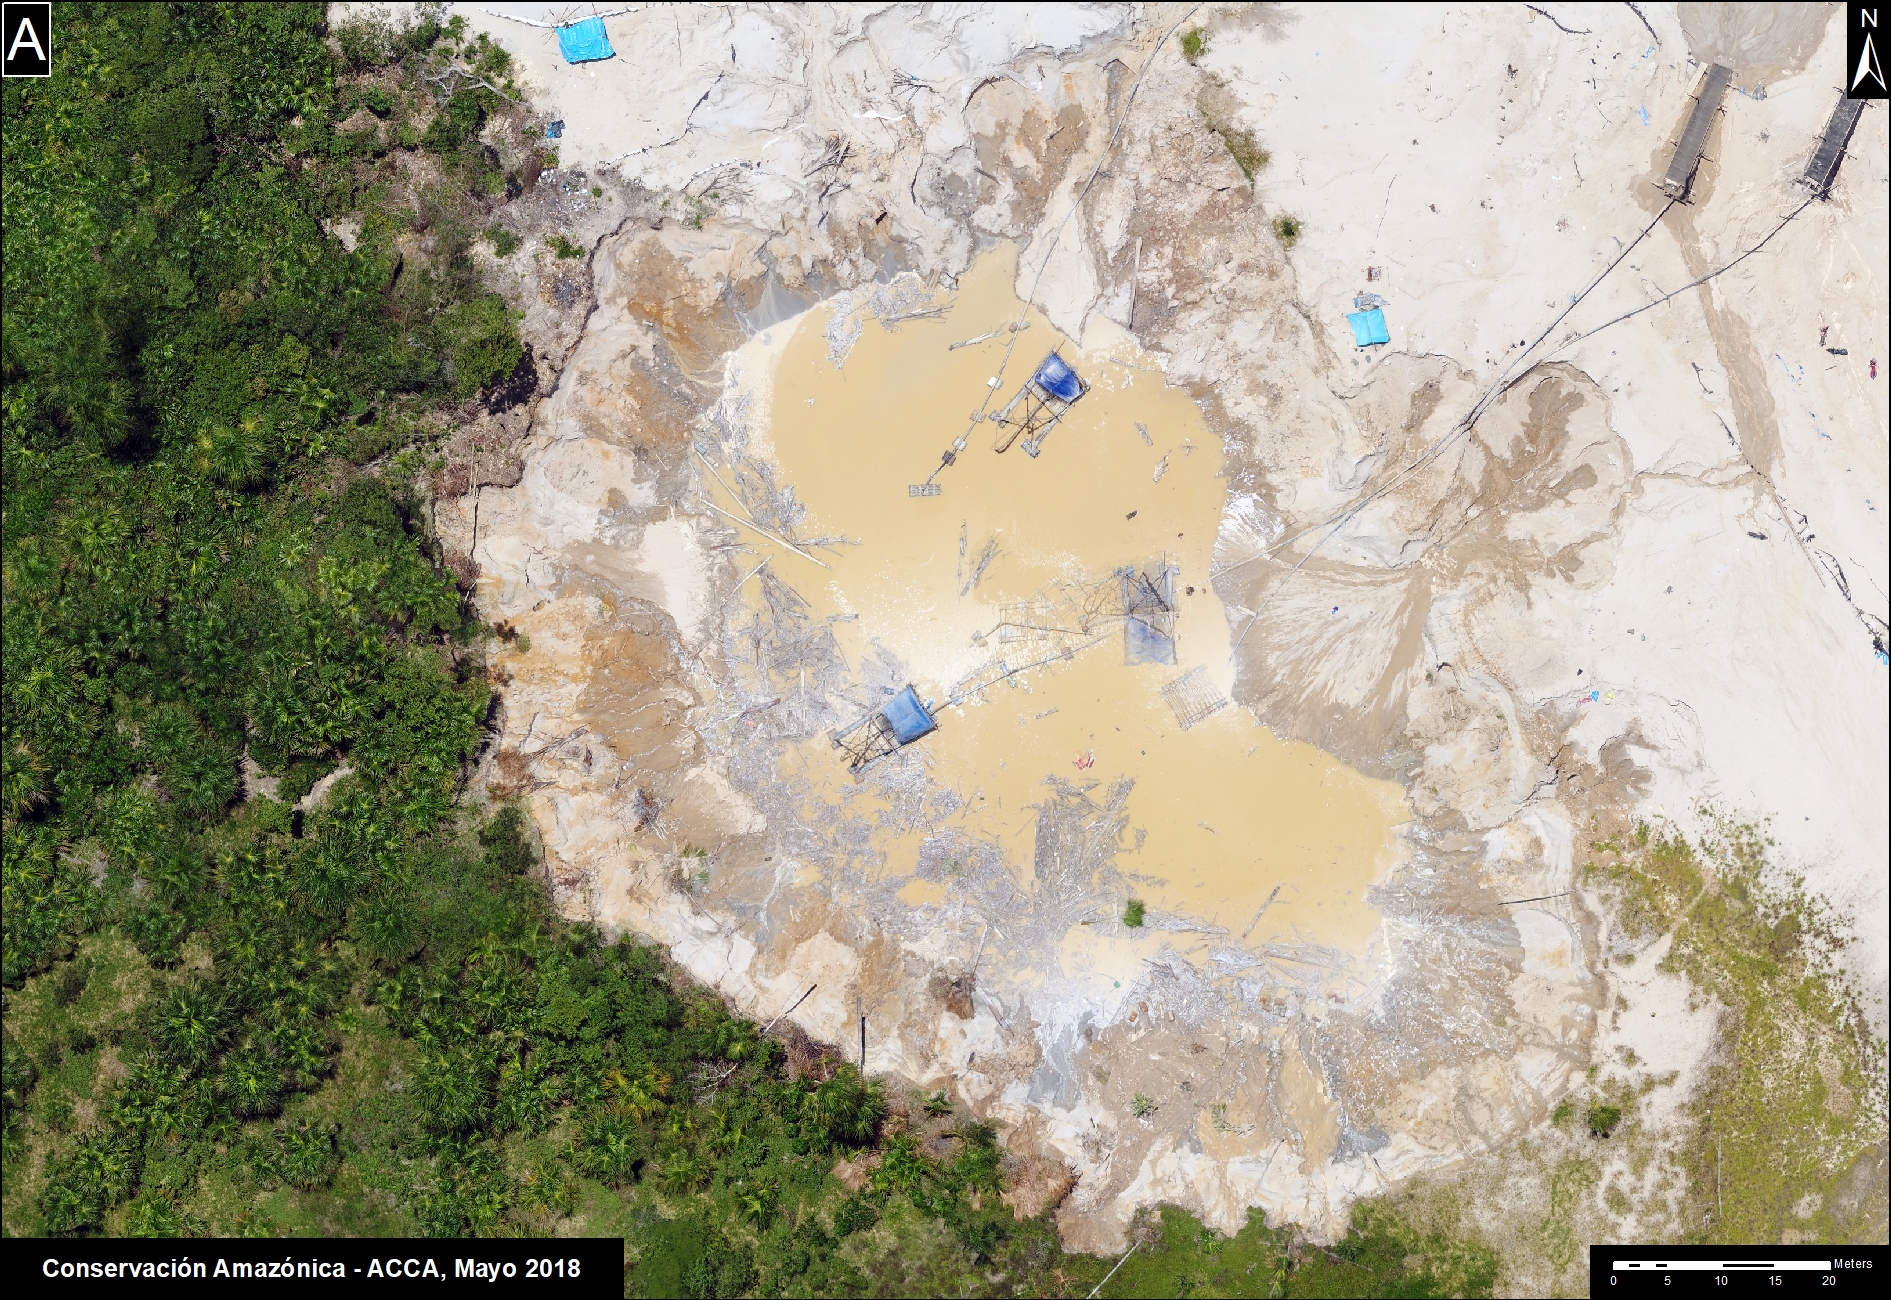
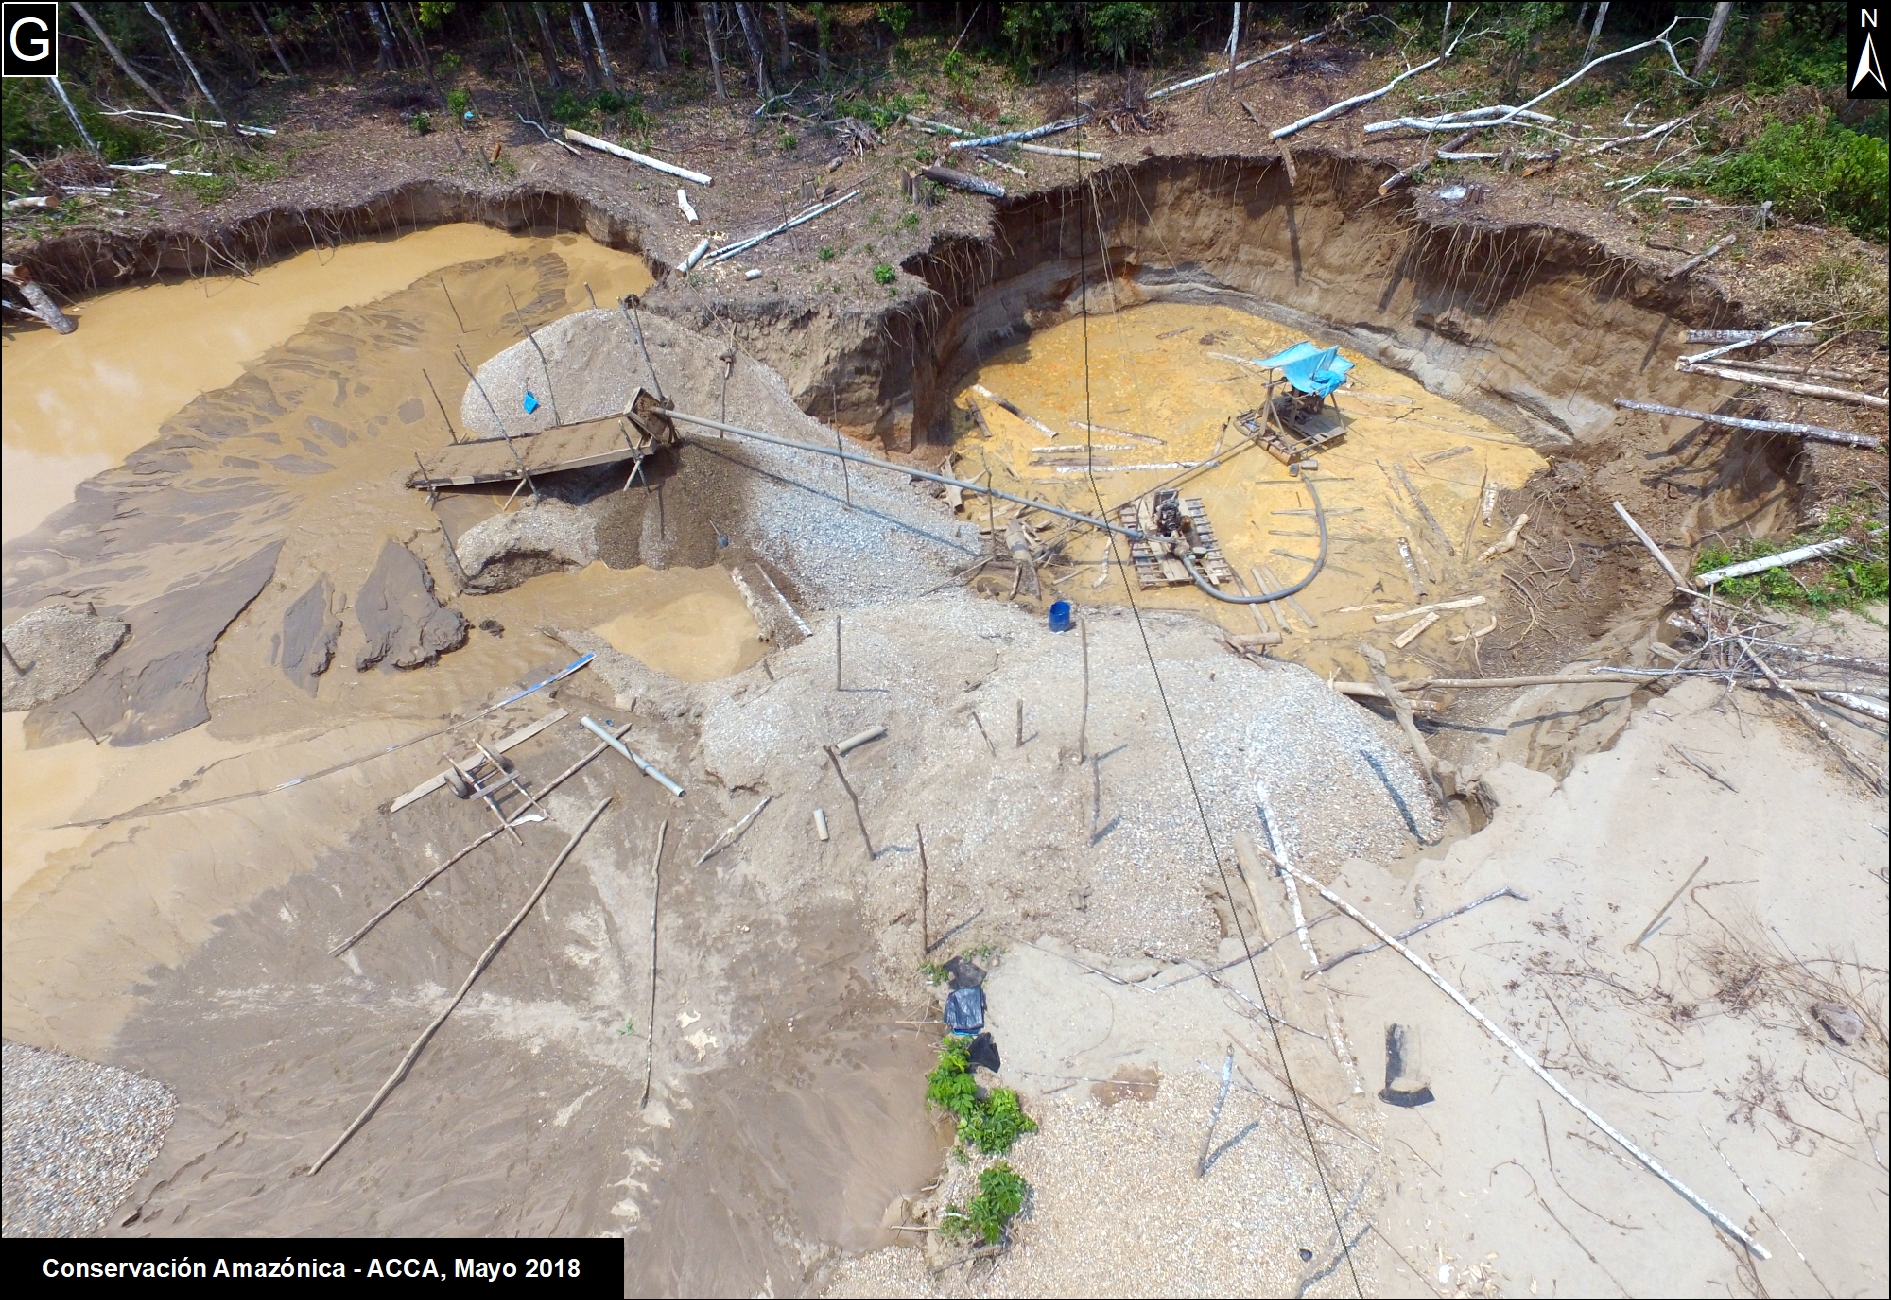
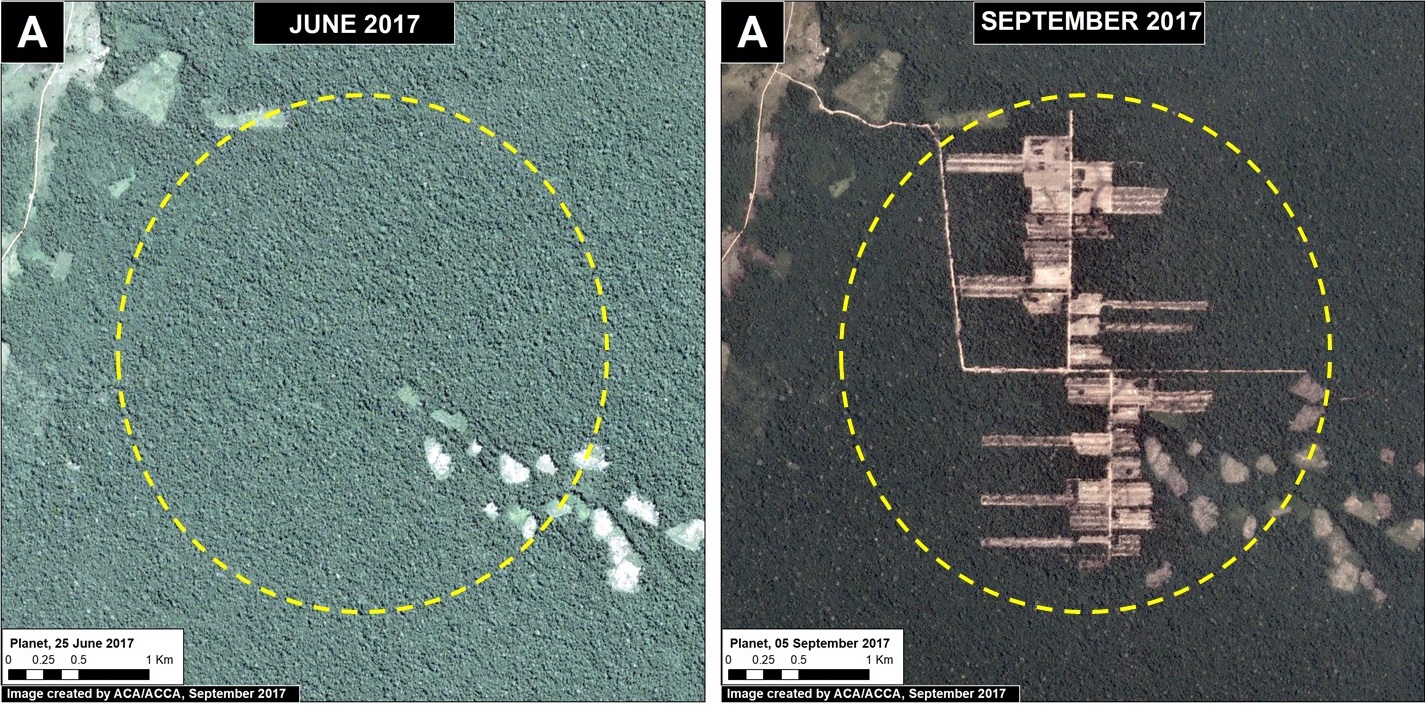
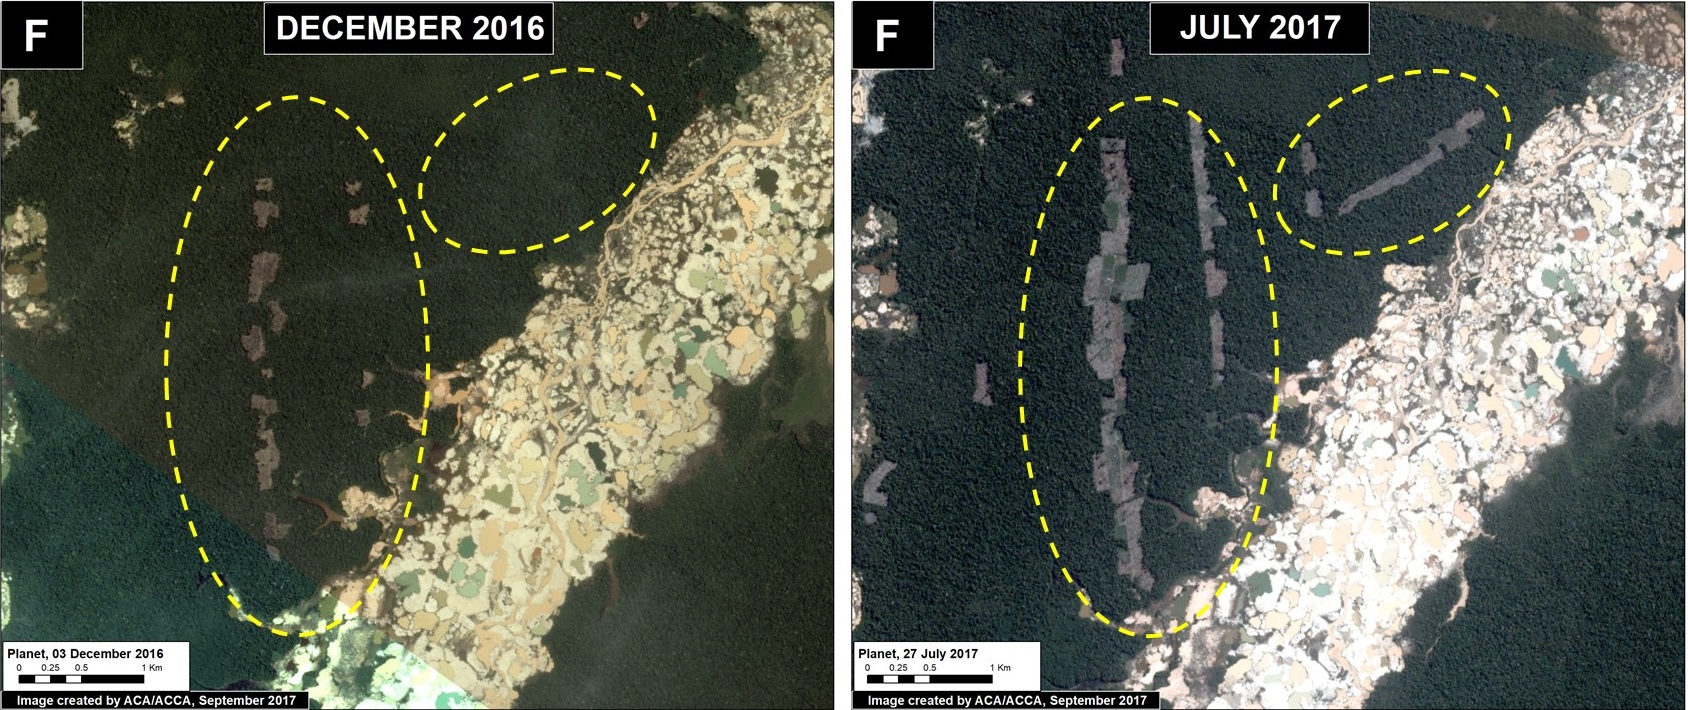
La Pampa (Inset A)

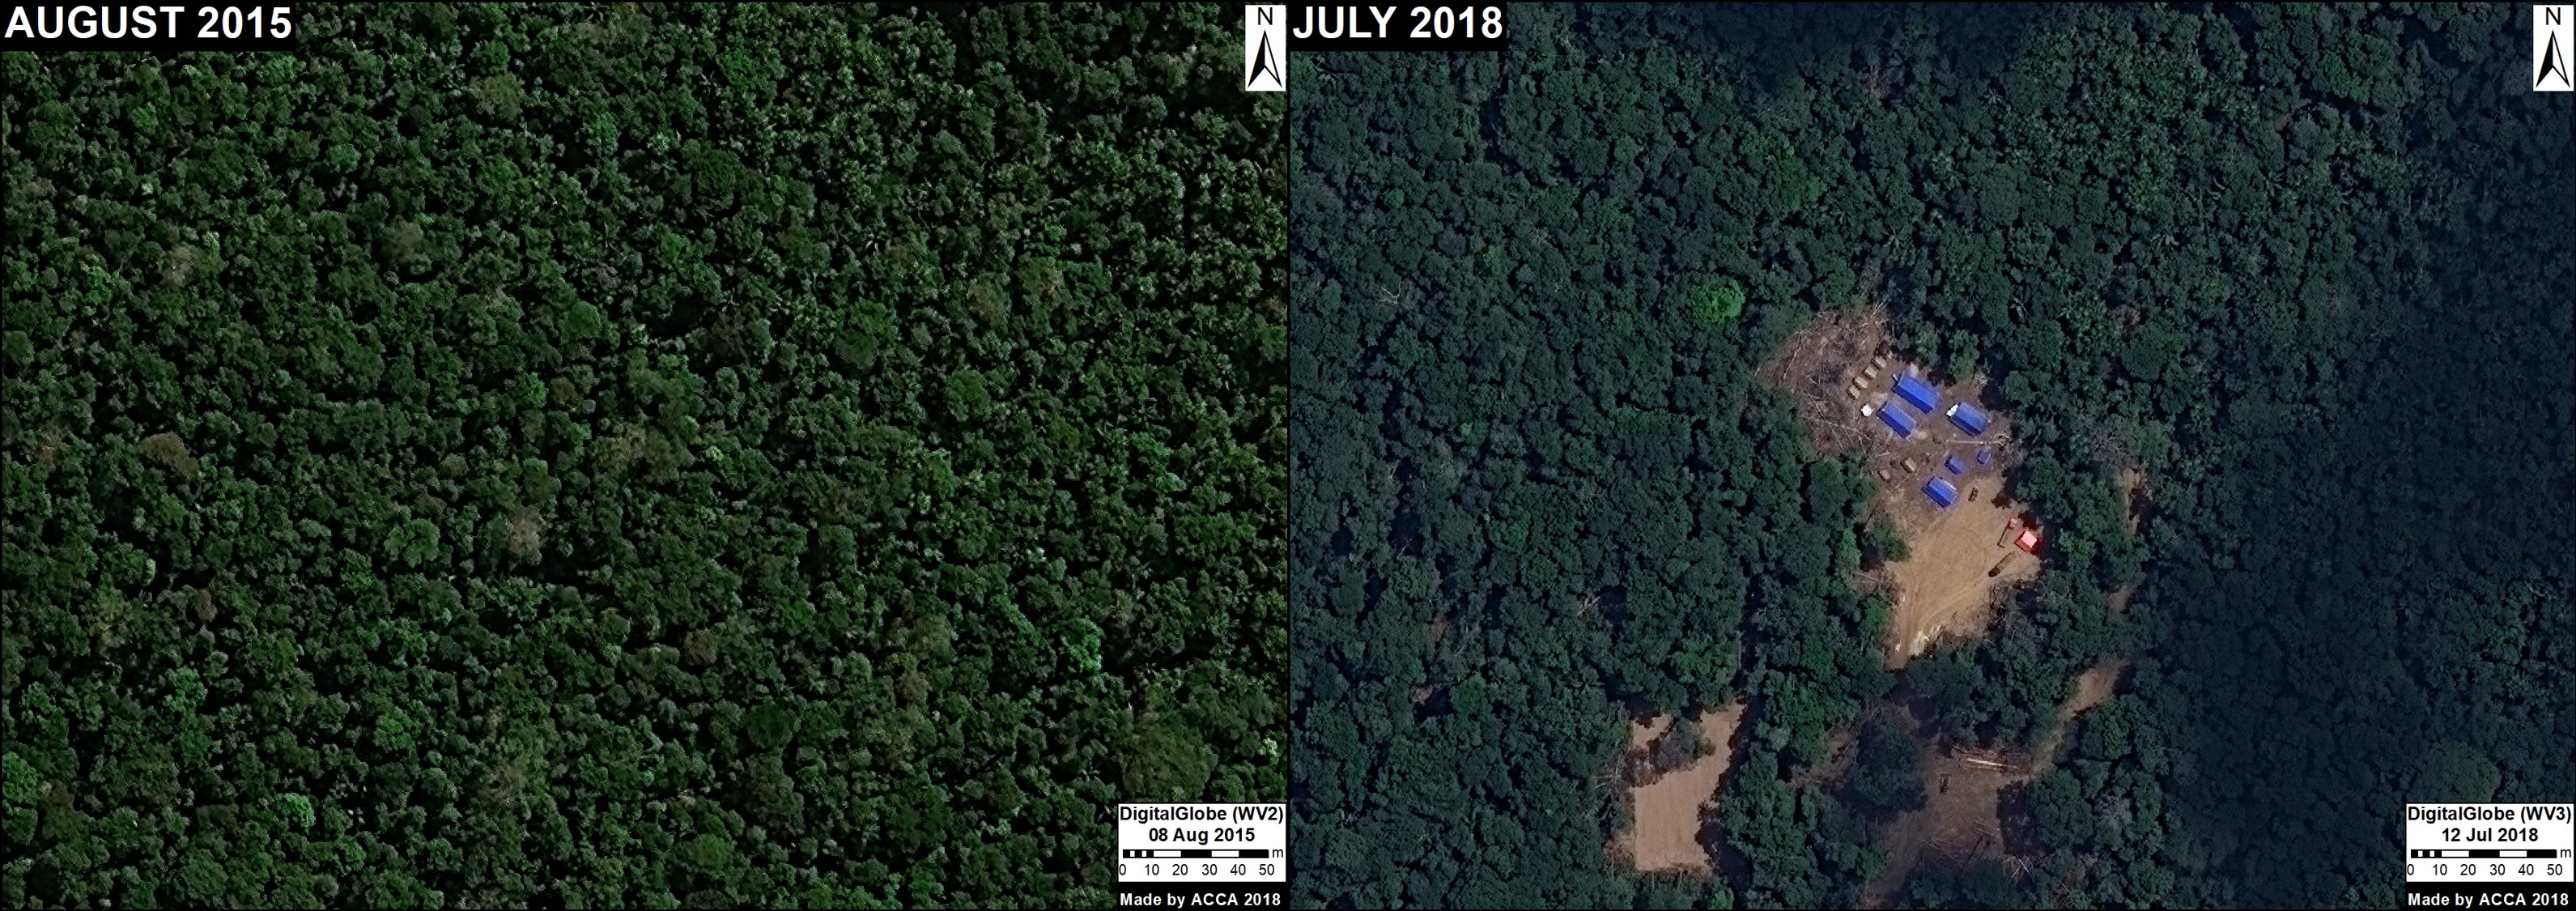
The area known as La Pampa continues to experience significant deforestation due to the advance of gold mining. Despite a series of field interventions by the Peruvian Government, we documented the deforestation of 1,385 acres (560 hectares) in 2017 (Image 76a). Since 2013, the total deforestation in La Pampa is 11,270 acres (4,560 hectares).

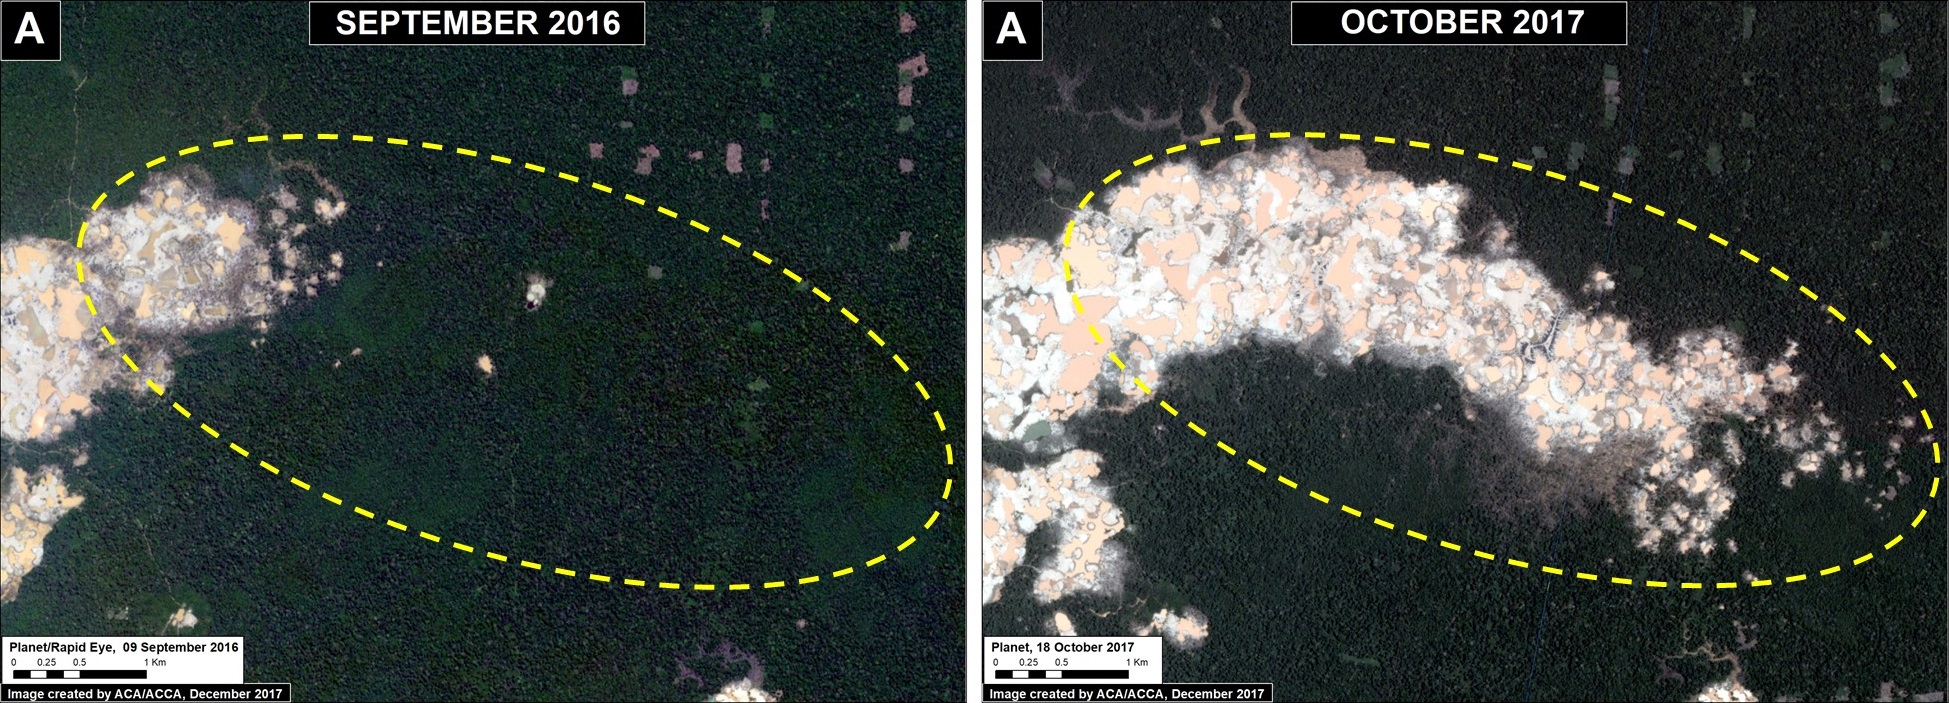
Image 76a. Data: Planet

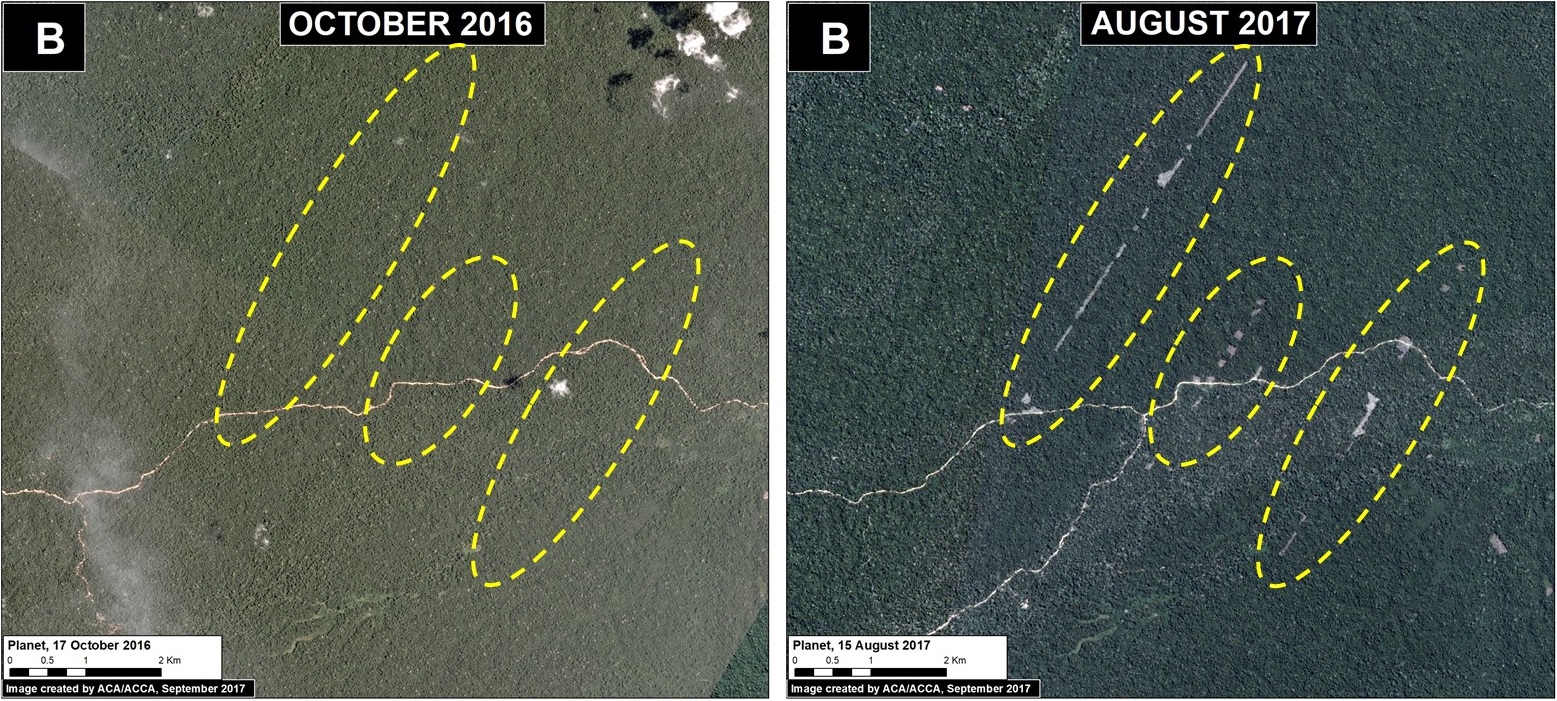
Upper Malinowski (Inset B)

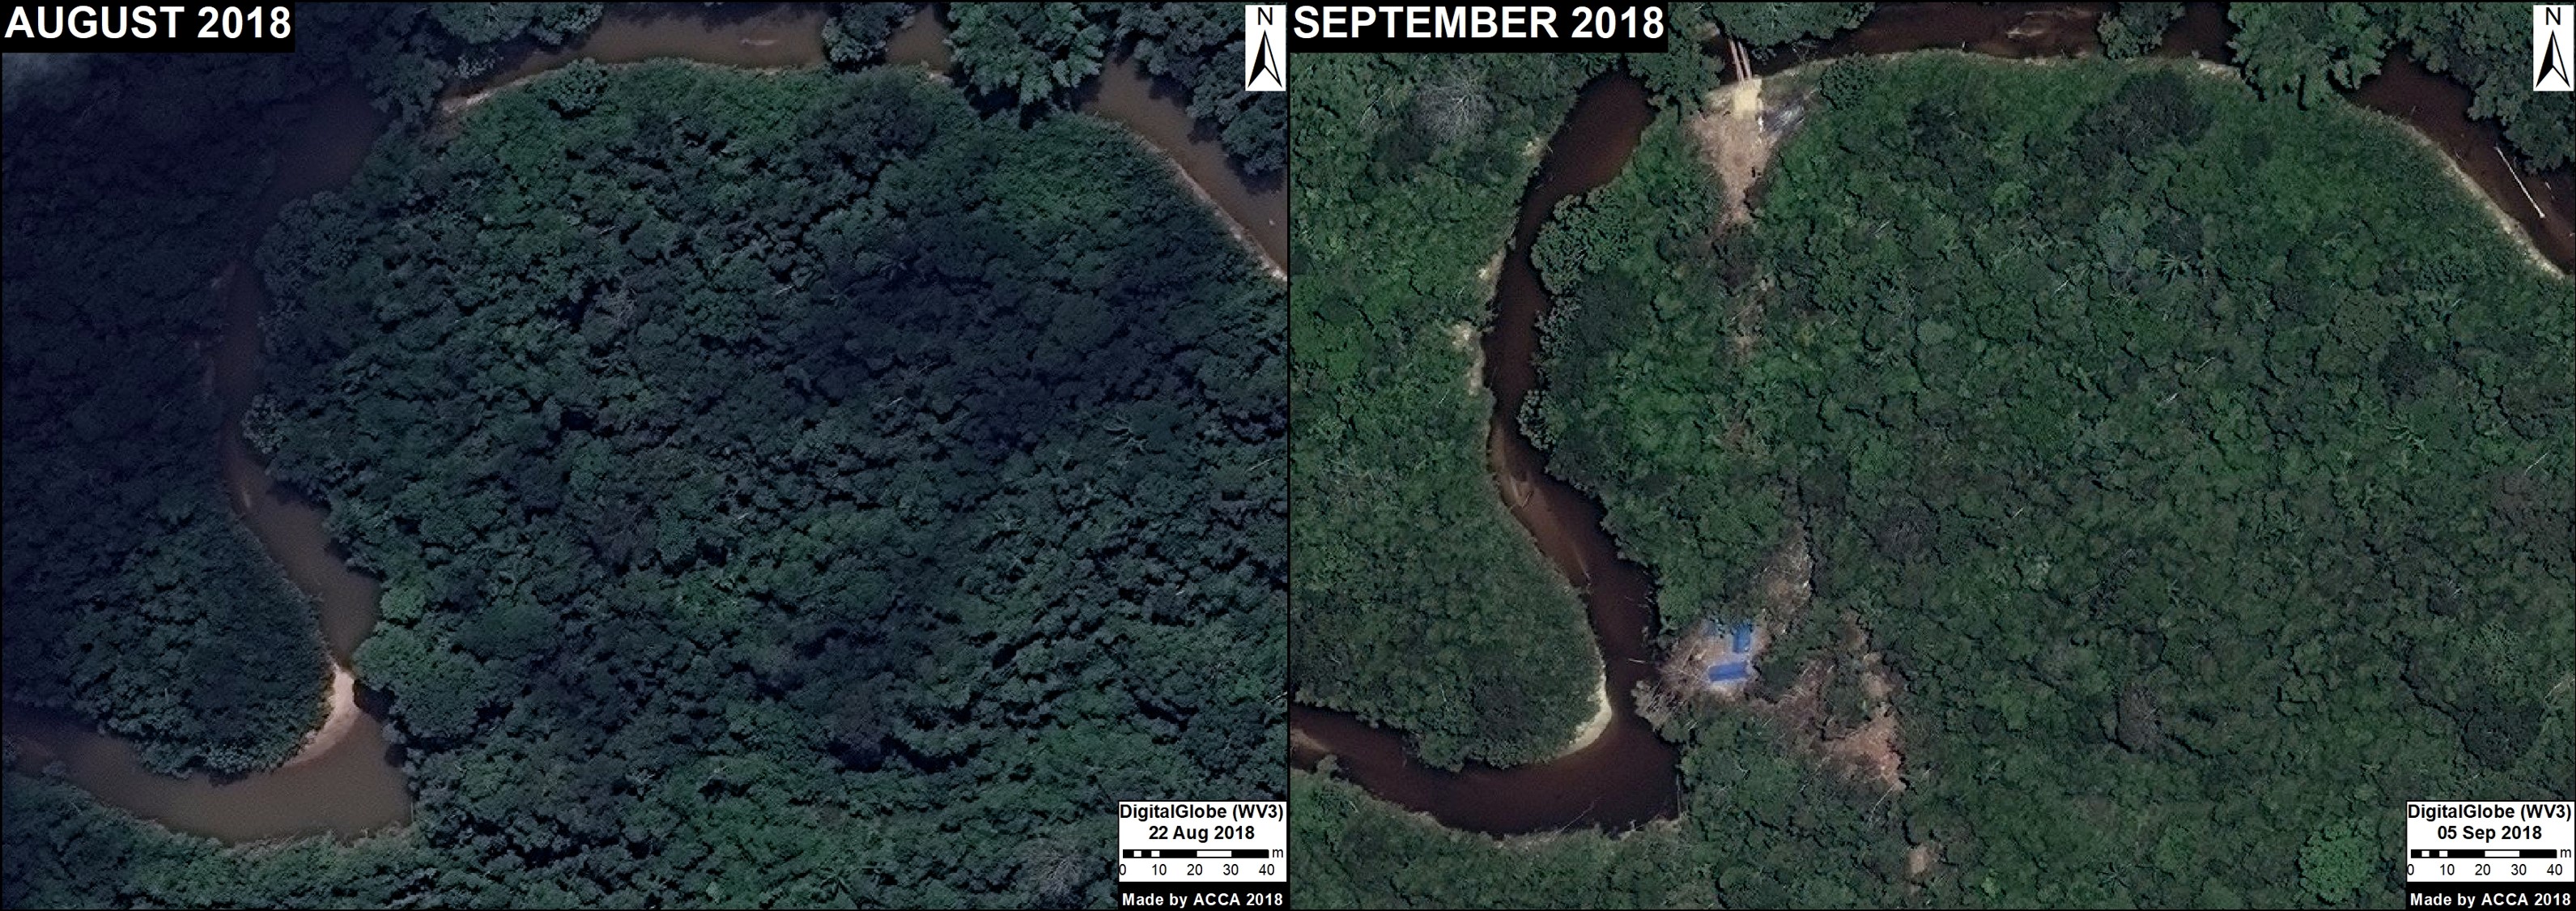
Upstream of La Pampa, the headwaters of the Malinowski River represent a second area devastated by the recent advance of gold mining. We documented the deforestation of 1,795 acres (726 hectares) in 2017 along the upper Malinowski (Image 76b). Since 2015, the total deforestation along the upper Malinowski is 5,260 acres (2,130 hectares).

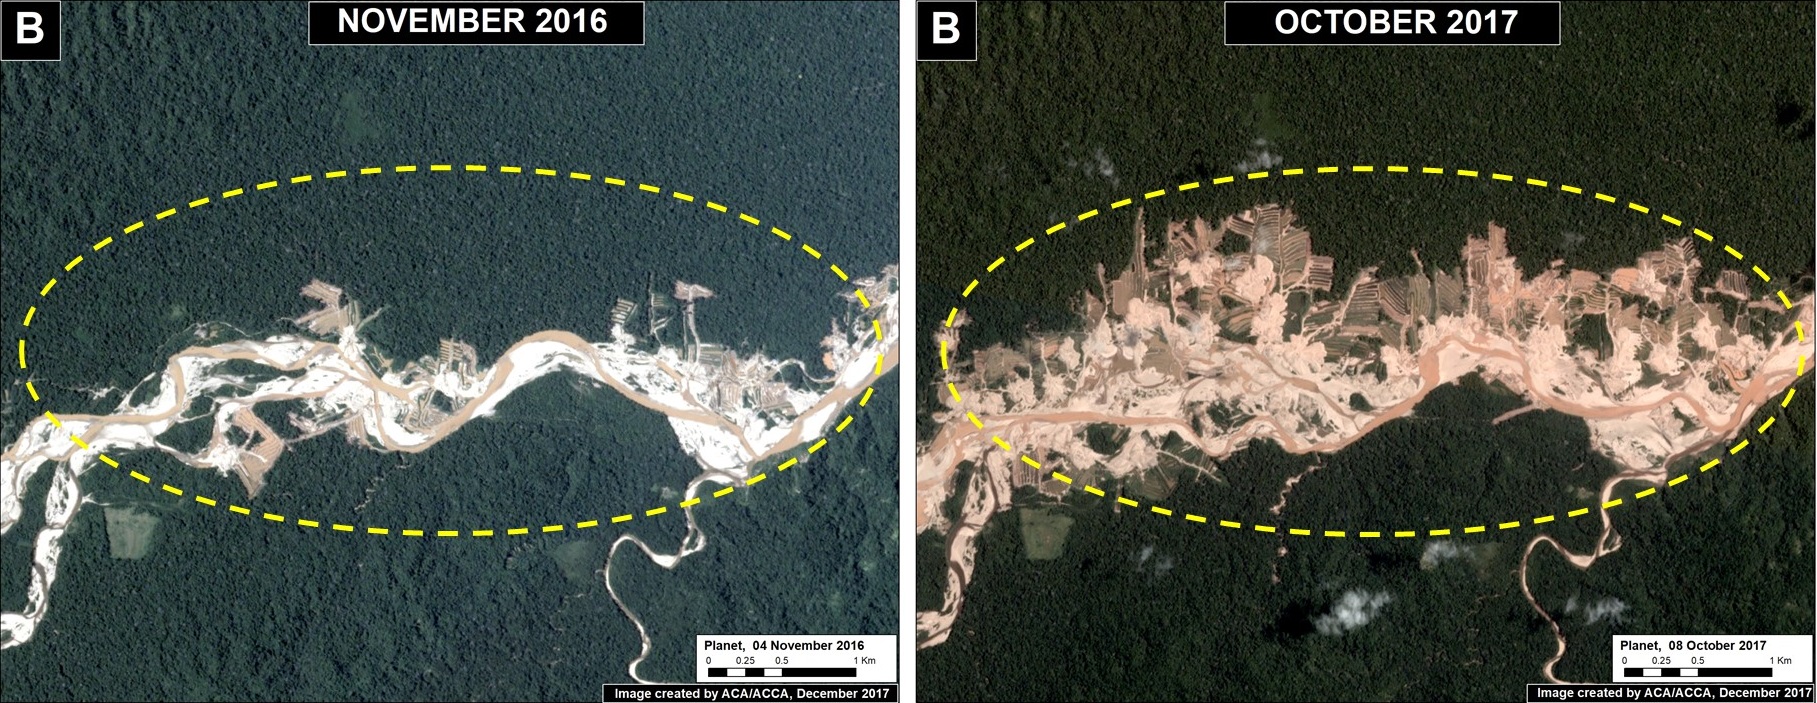
Image 76b. Data: Planet

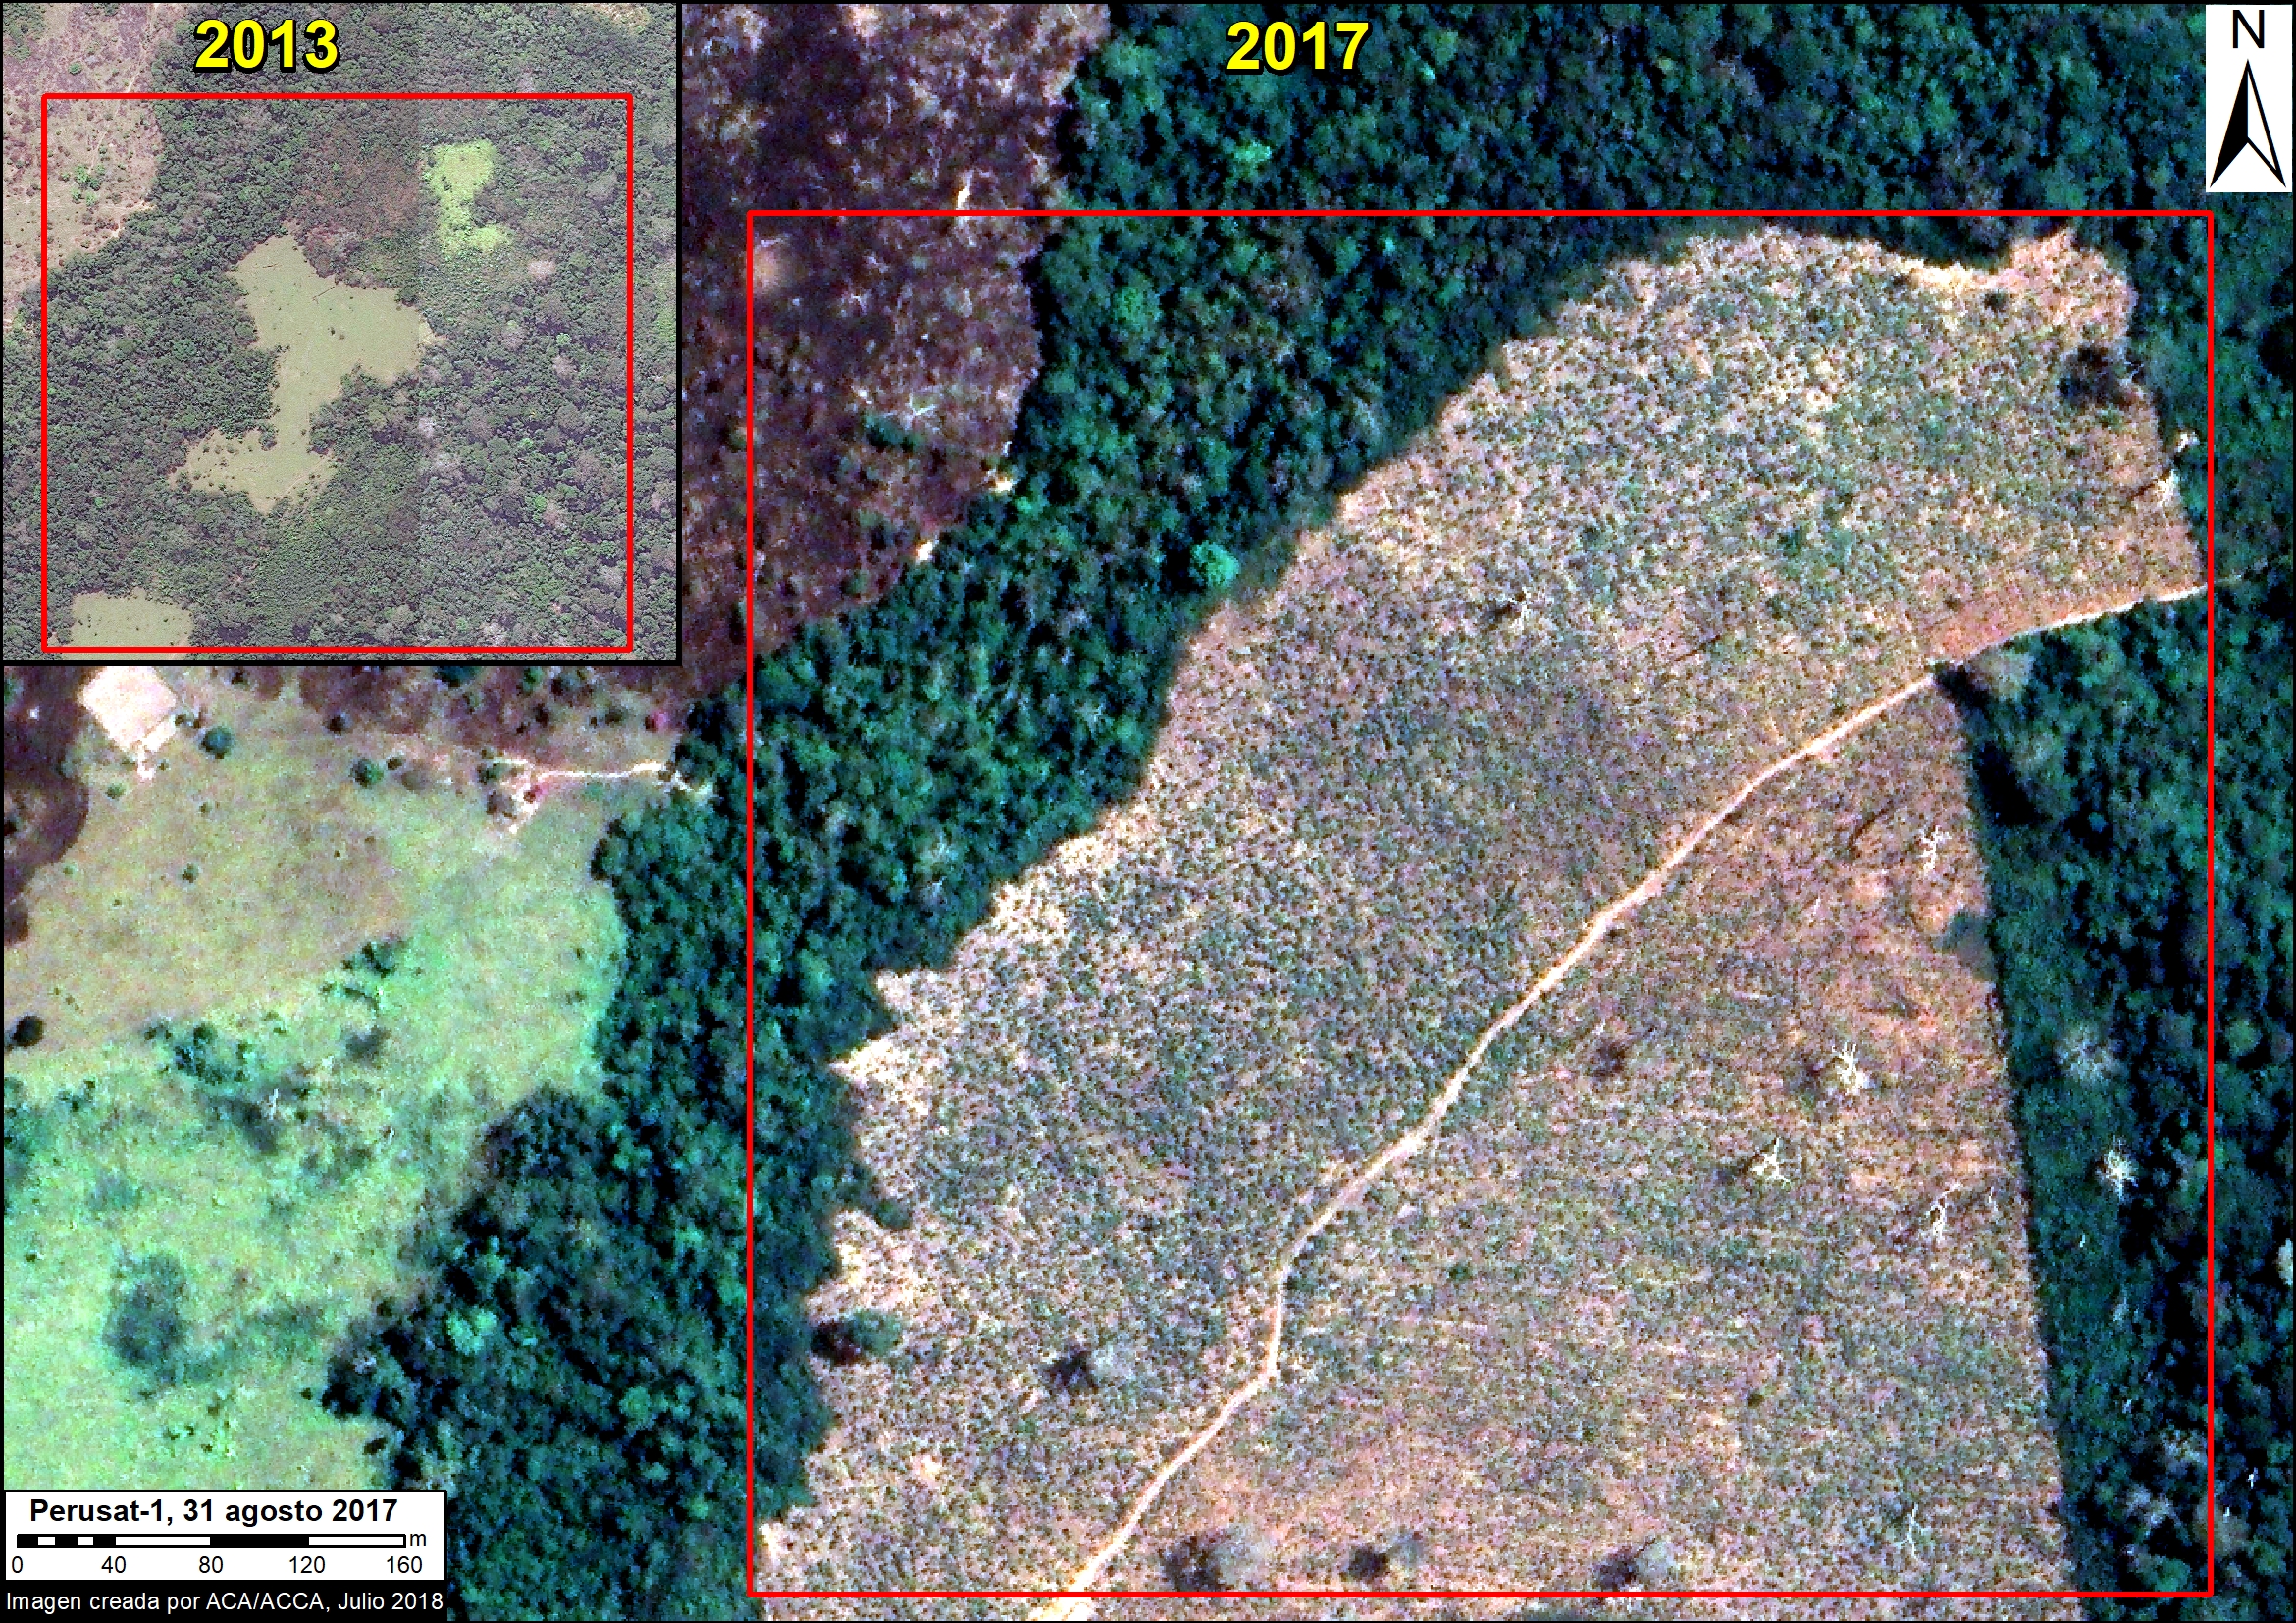
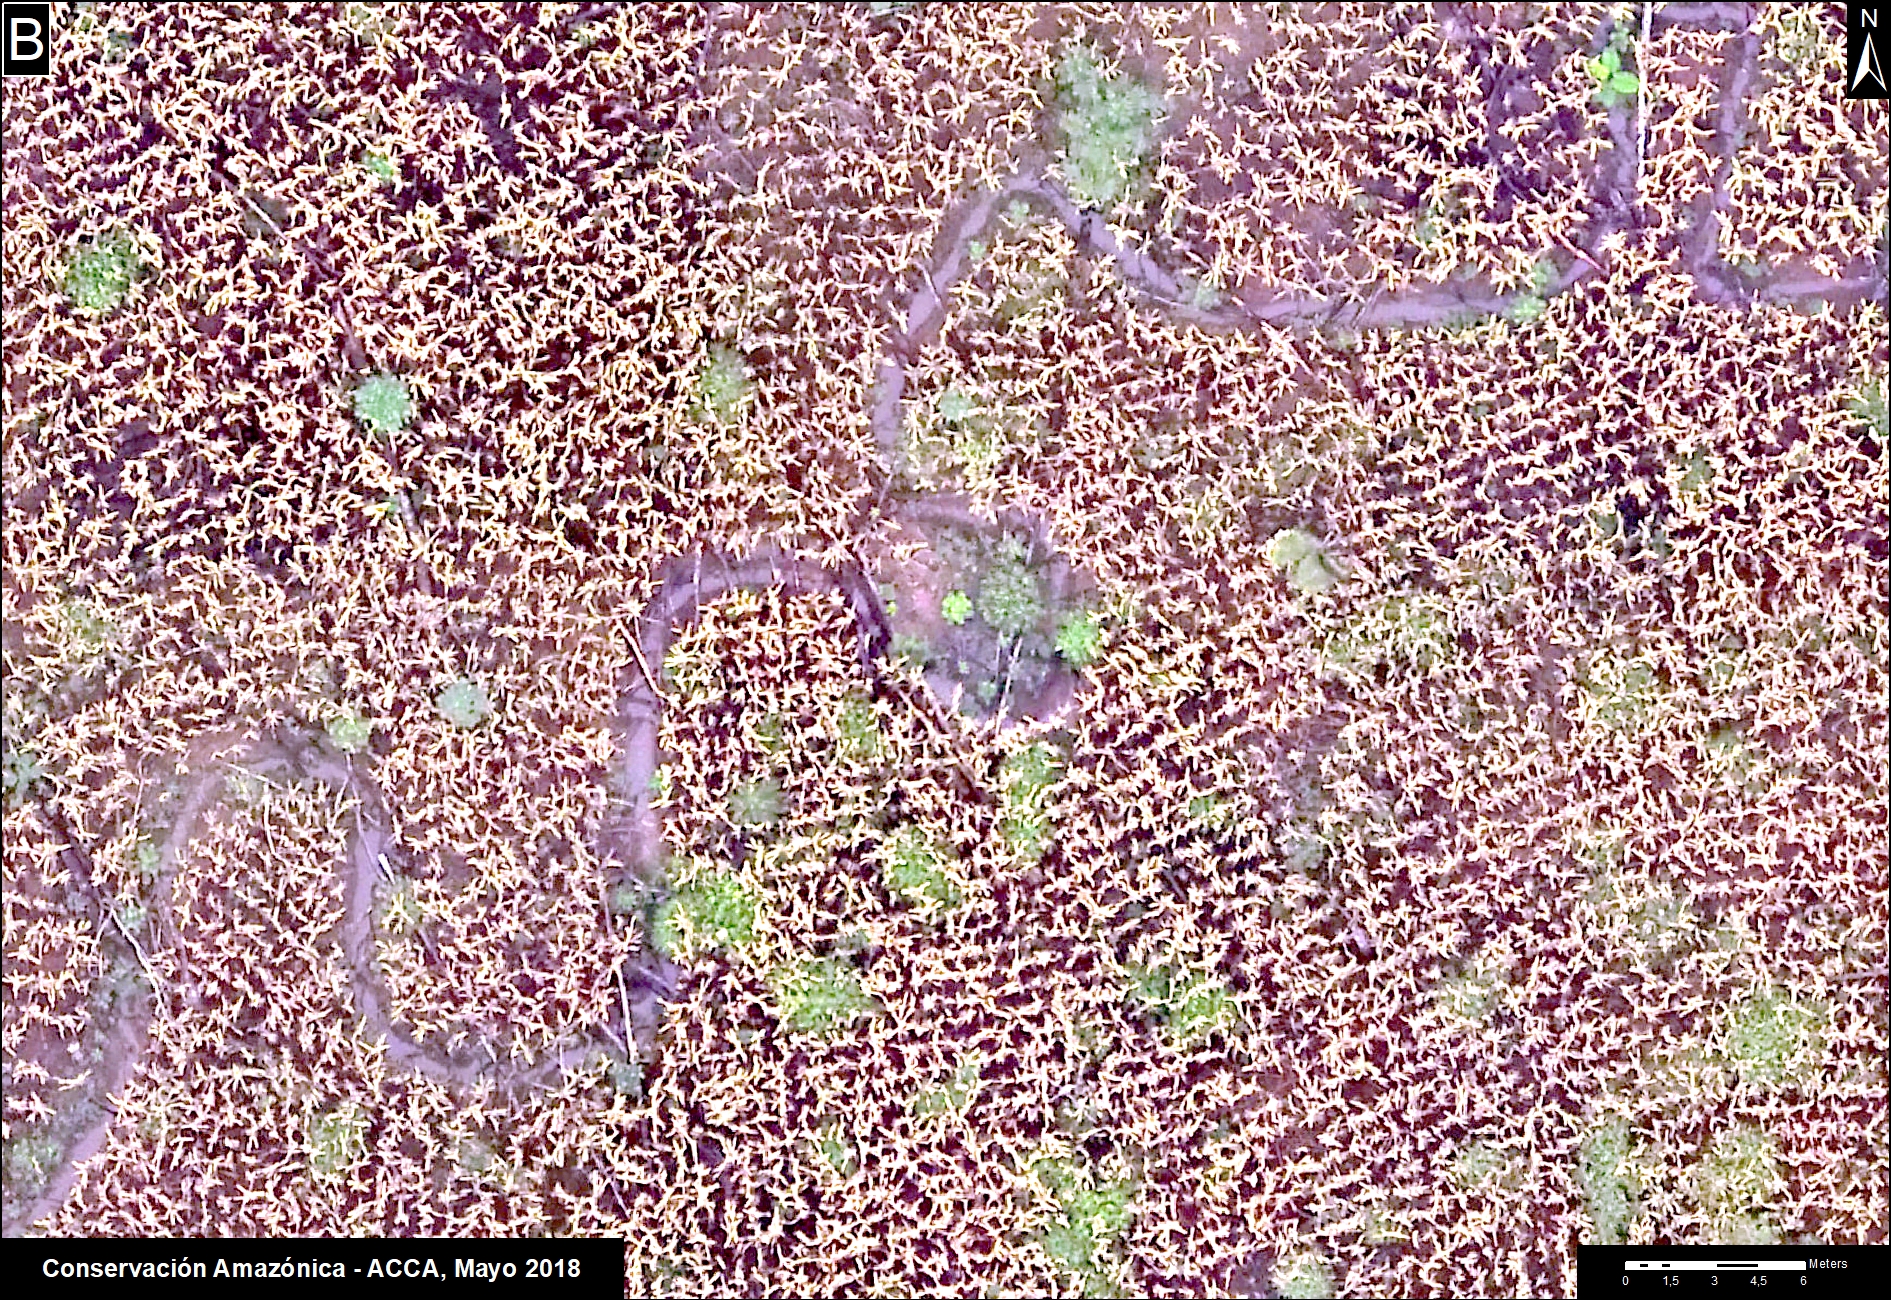
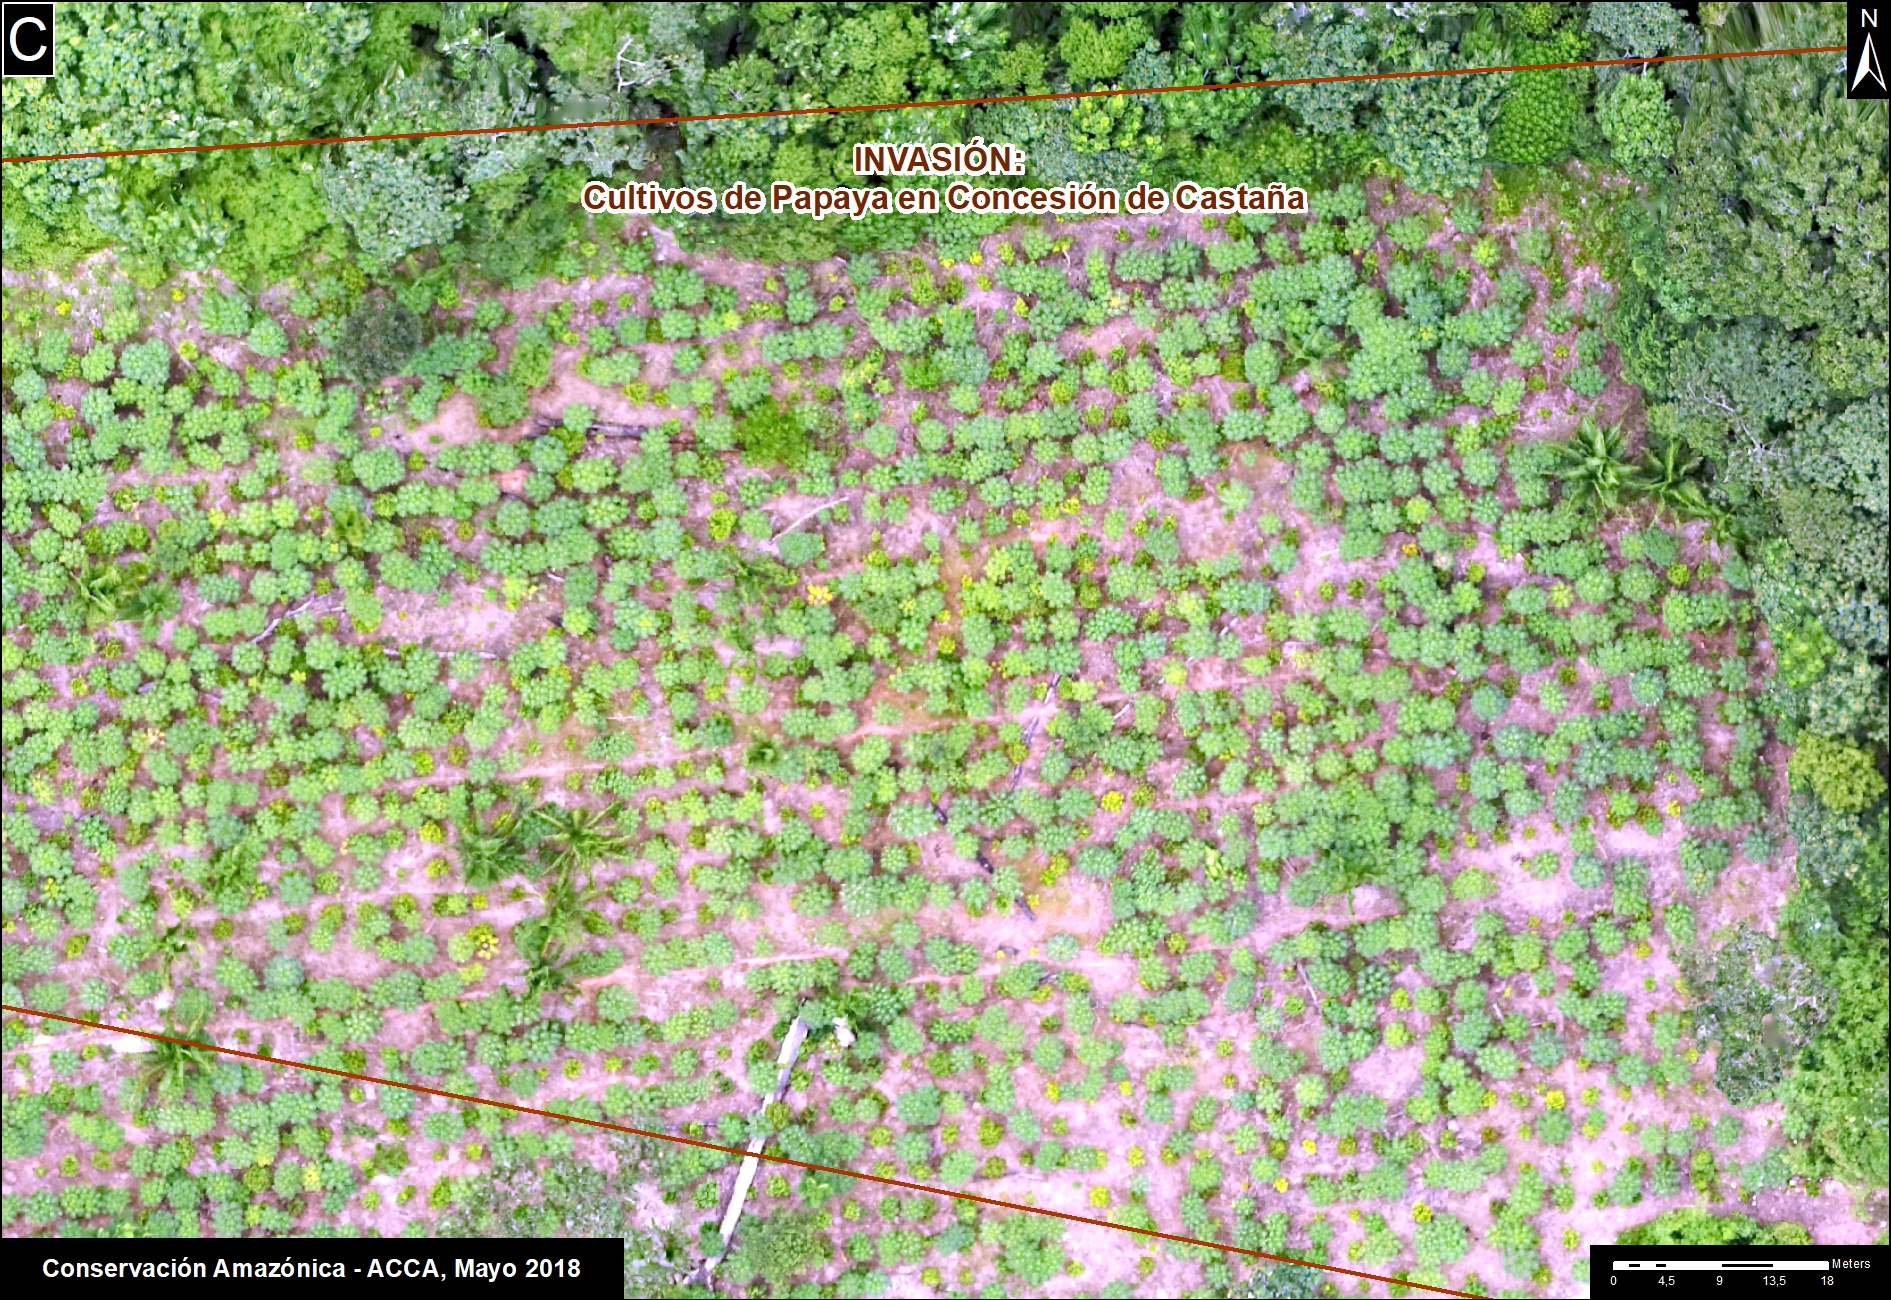
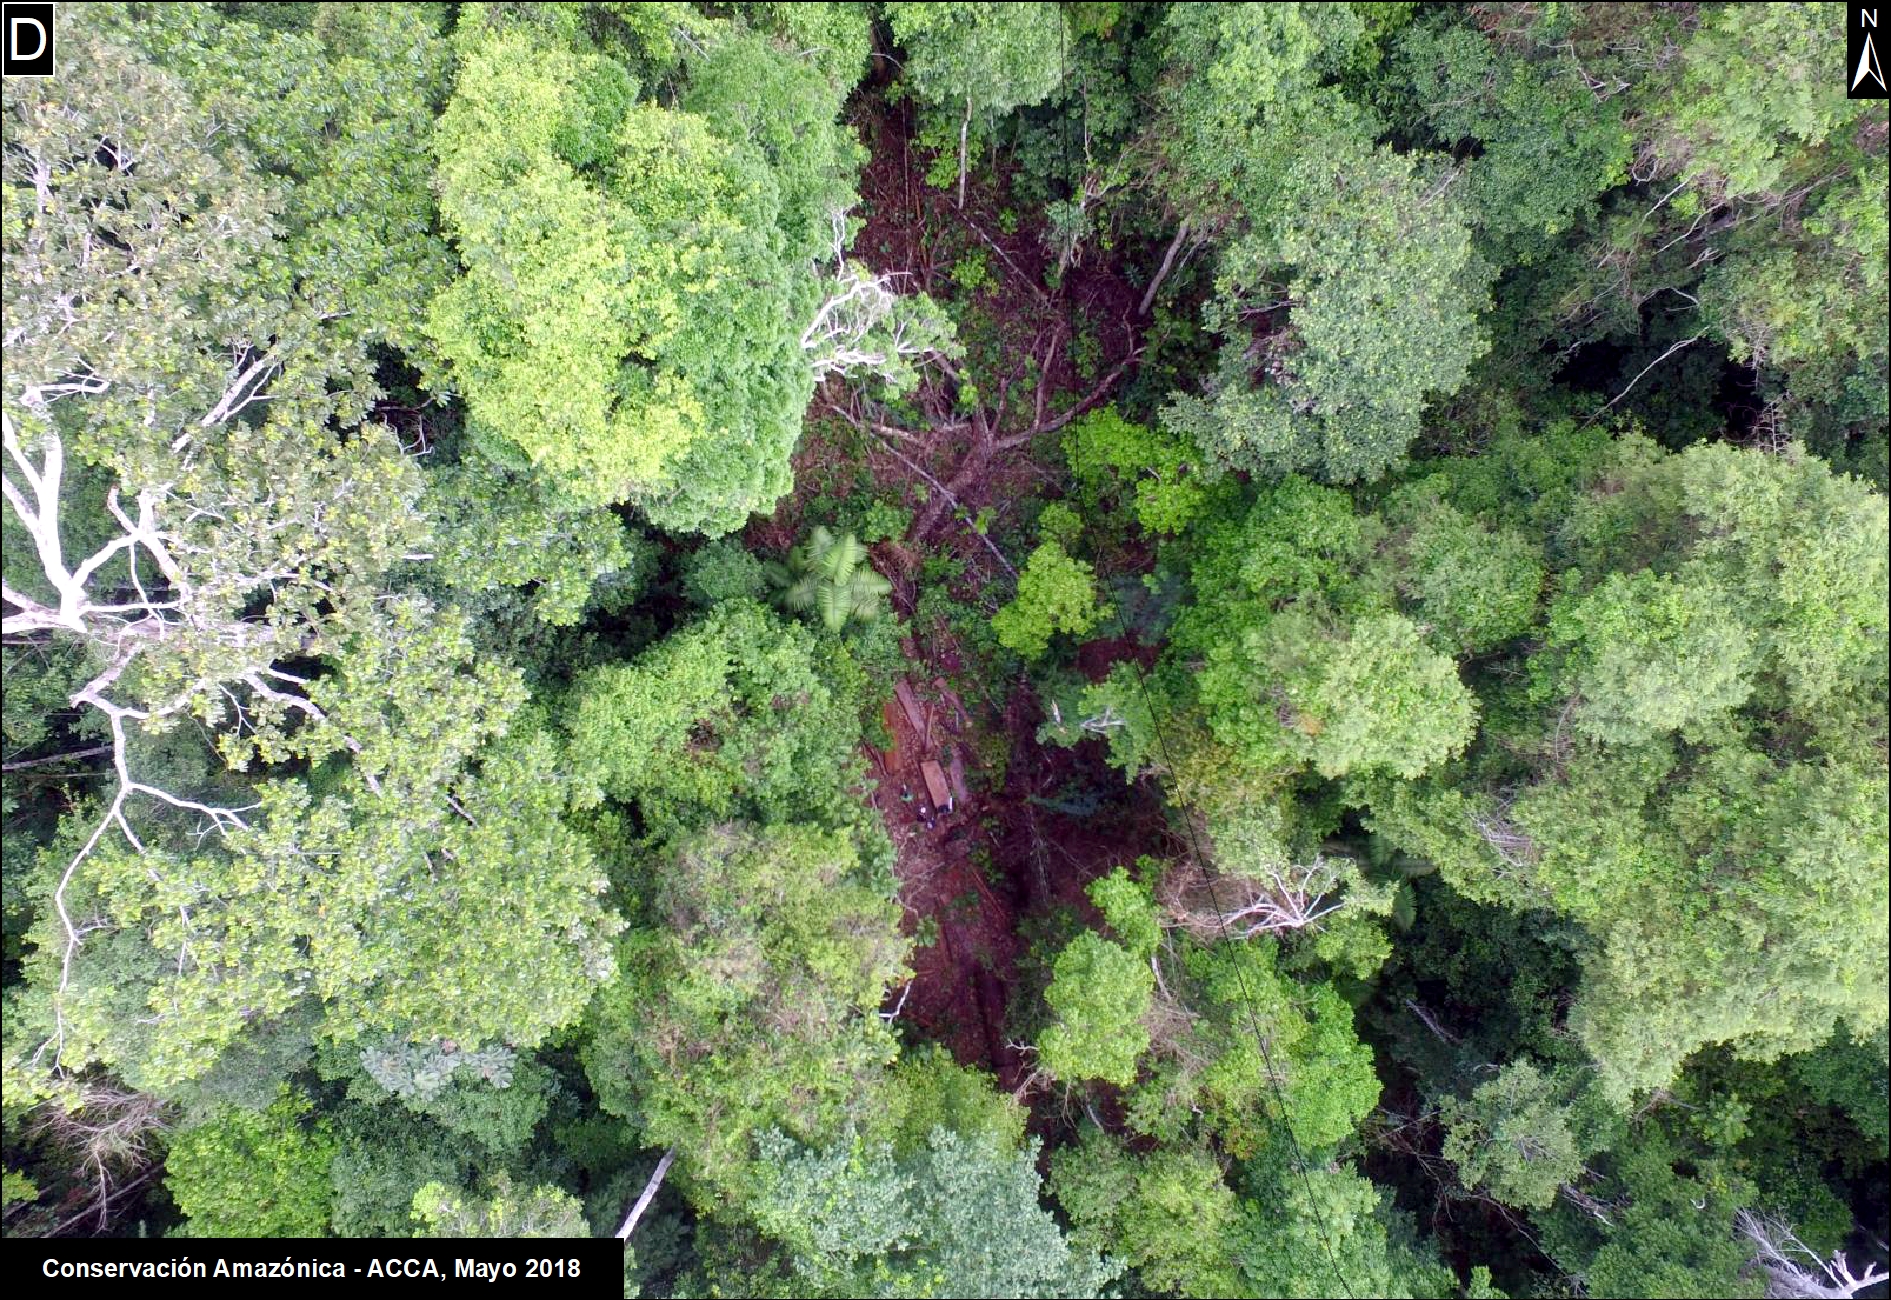
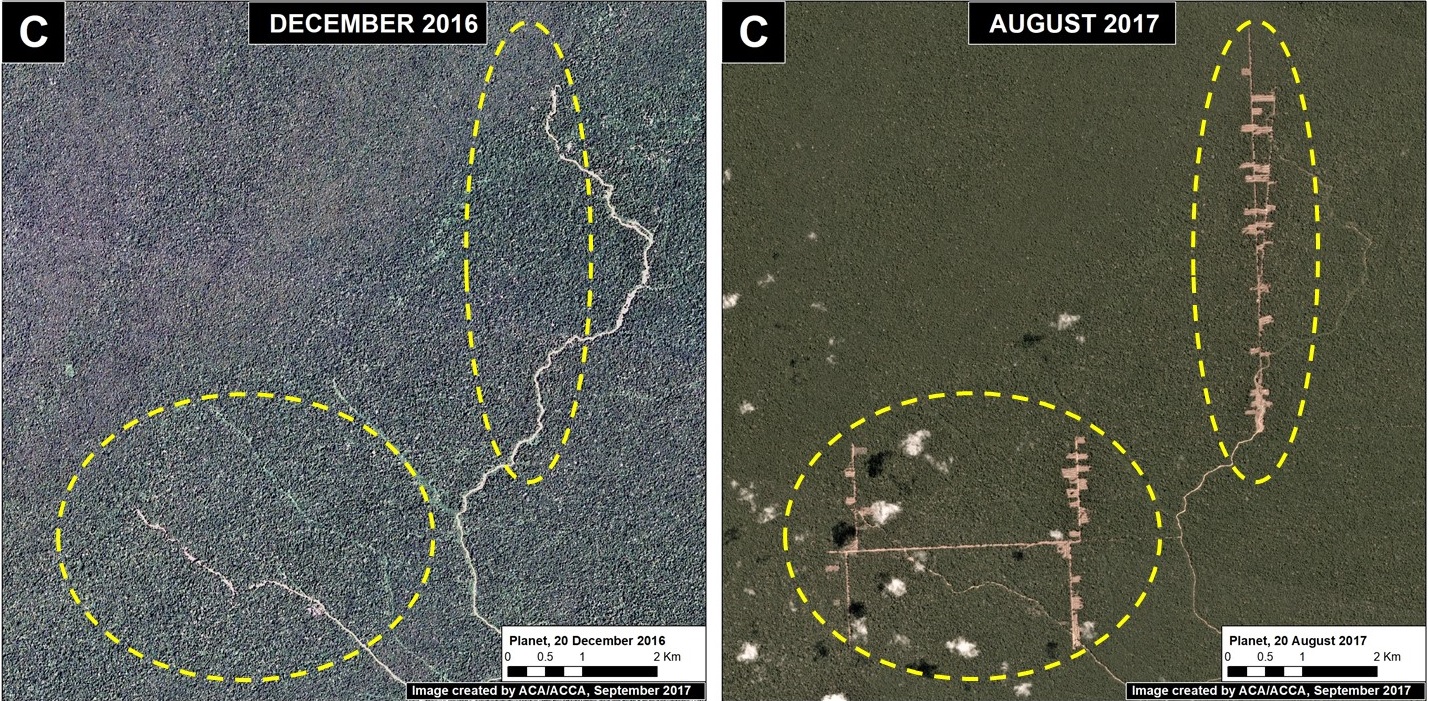
Santa Rita and Guacamayo (Insets C y D)

To the north of the La Pampa and Upper Malinowski mining areas, and on the other side of the Interoceanic highway, are two areas with significant recent deforestation due to small-scale agriculture. In these two areas, we documented the deforestation of 2,890 acres (1,170 hectares) in 2017 (Images 76c, 76d). Additional research focused on the exact type of crops is required, but local sources indicate an increase in papaya and cacao in the area.

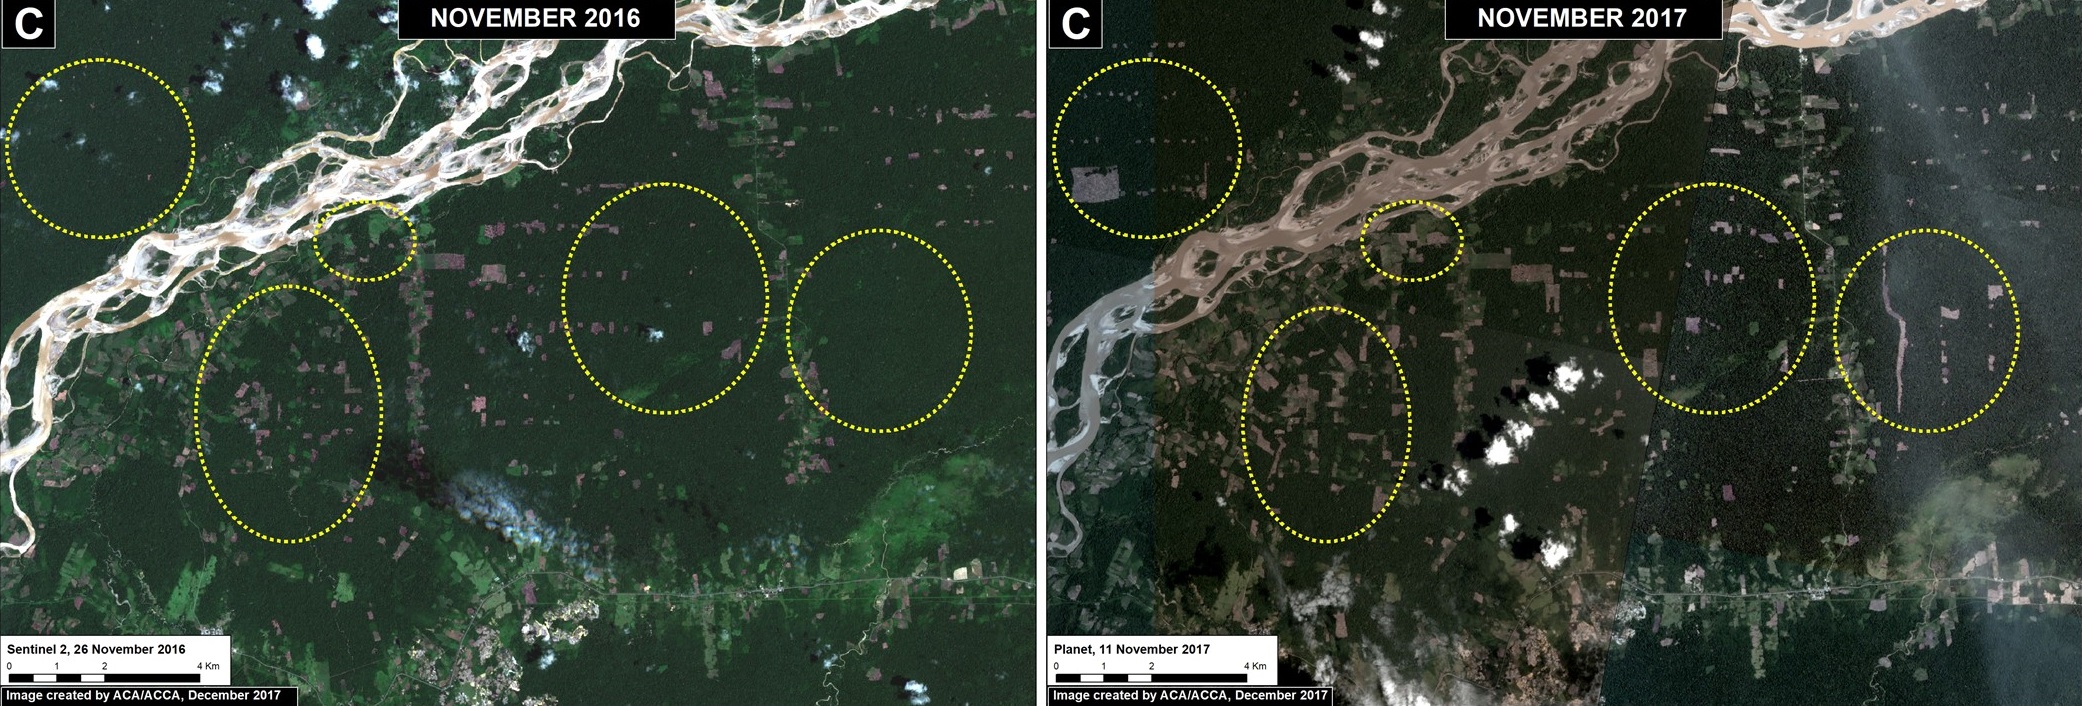
Image 76c. Data: Planet, ESA
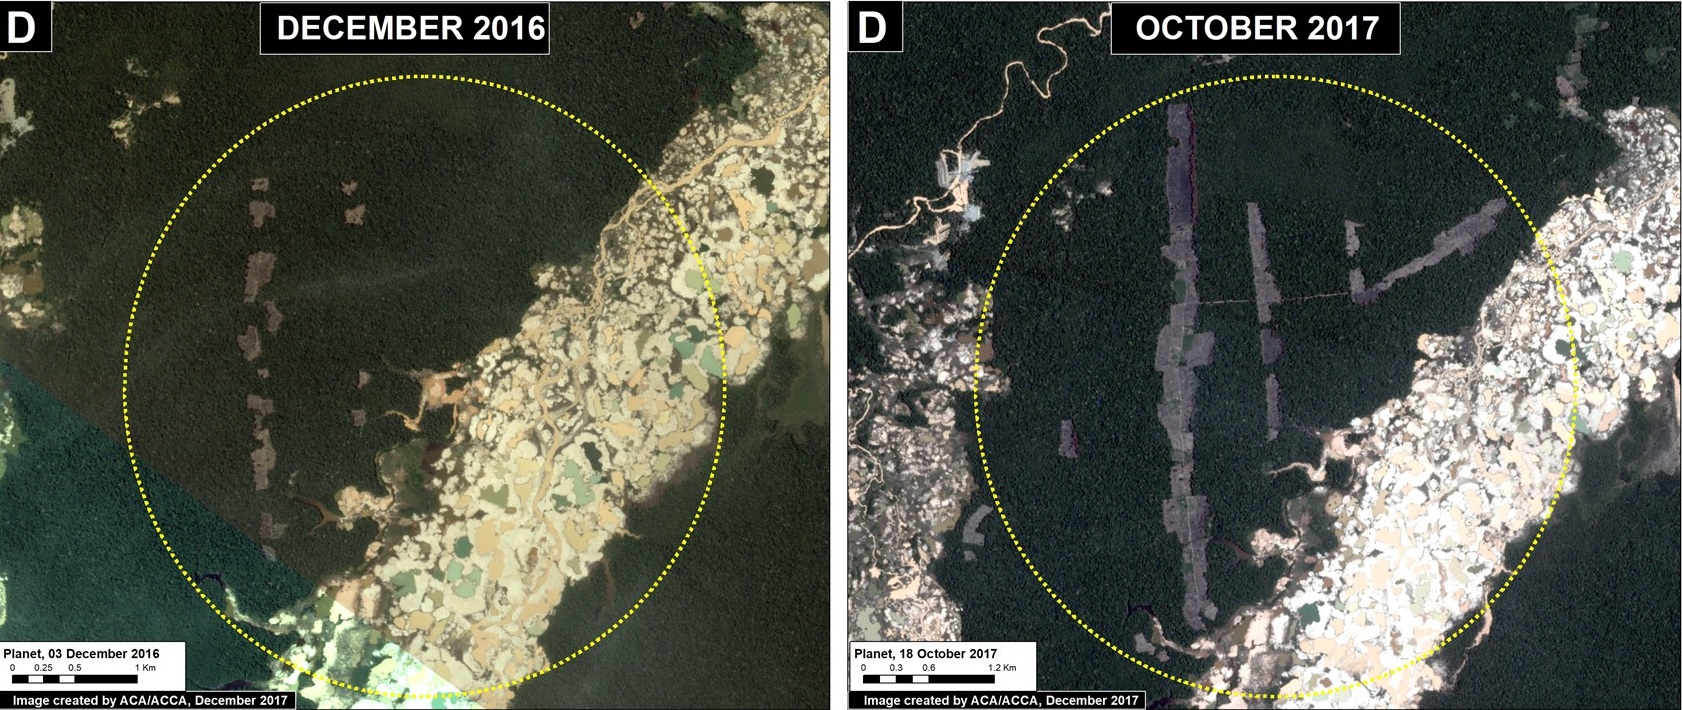
Image 76d. Data: Planet
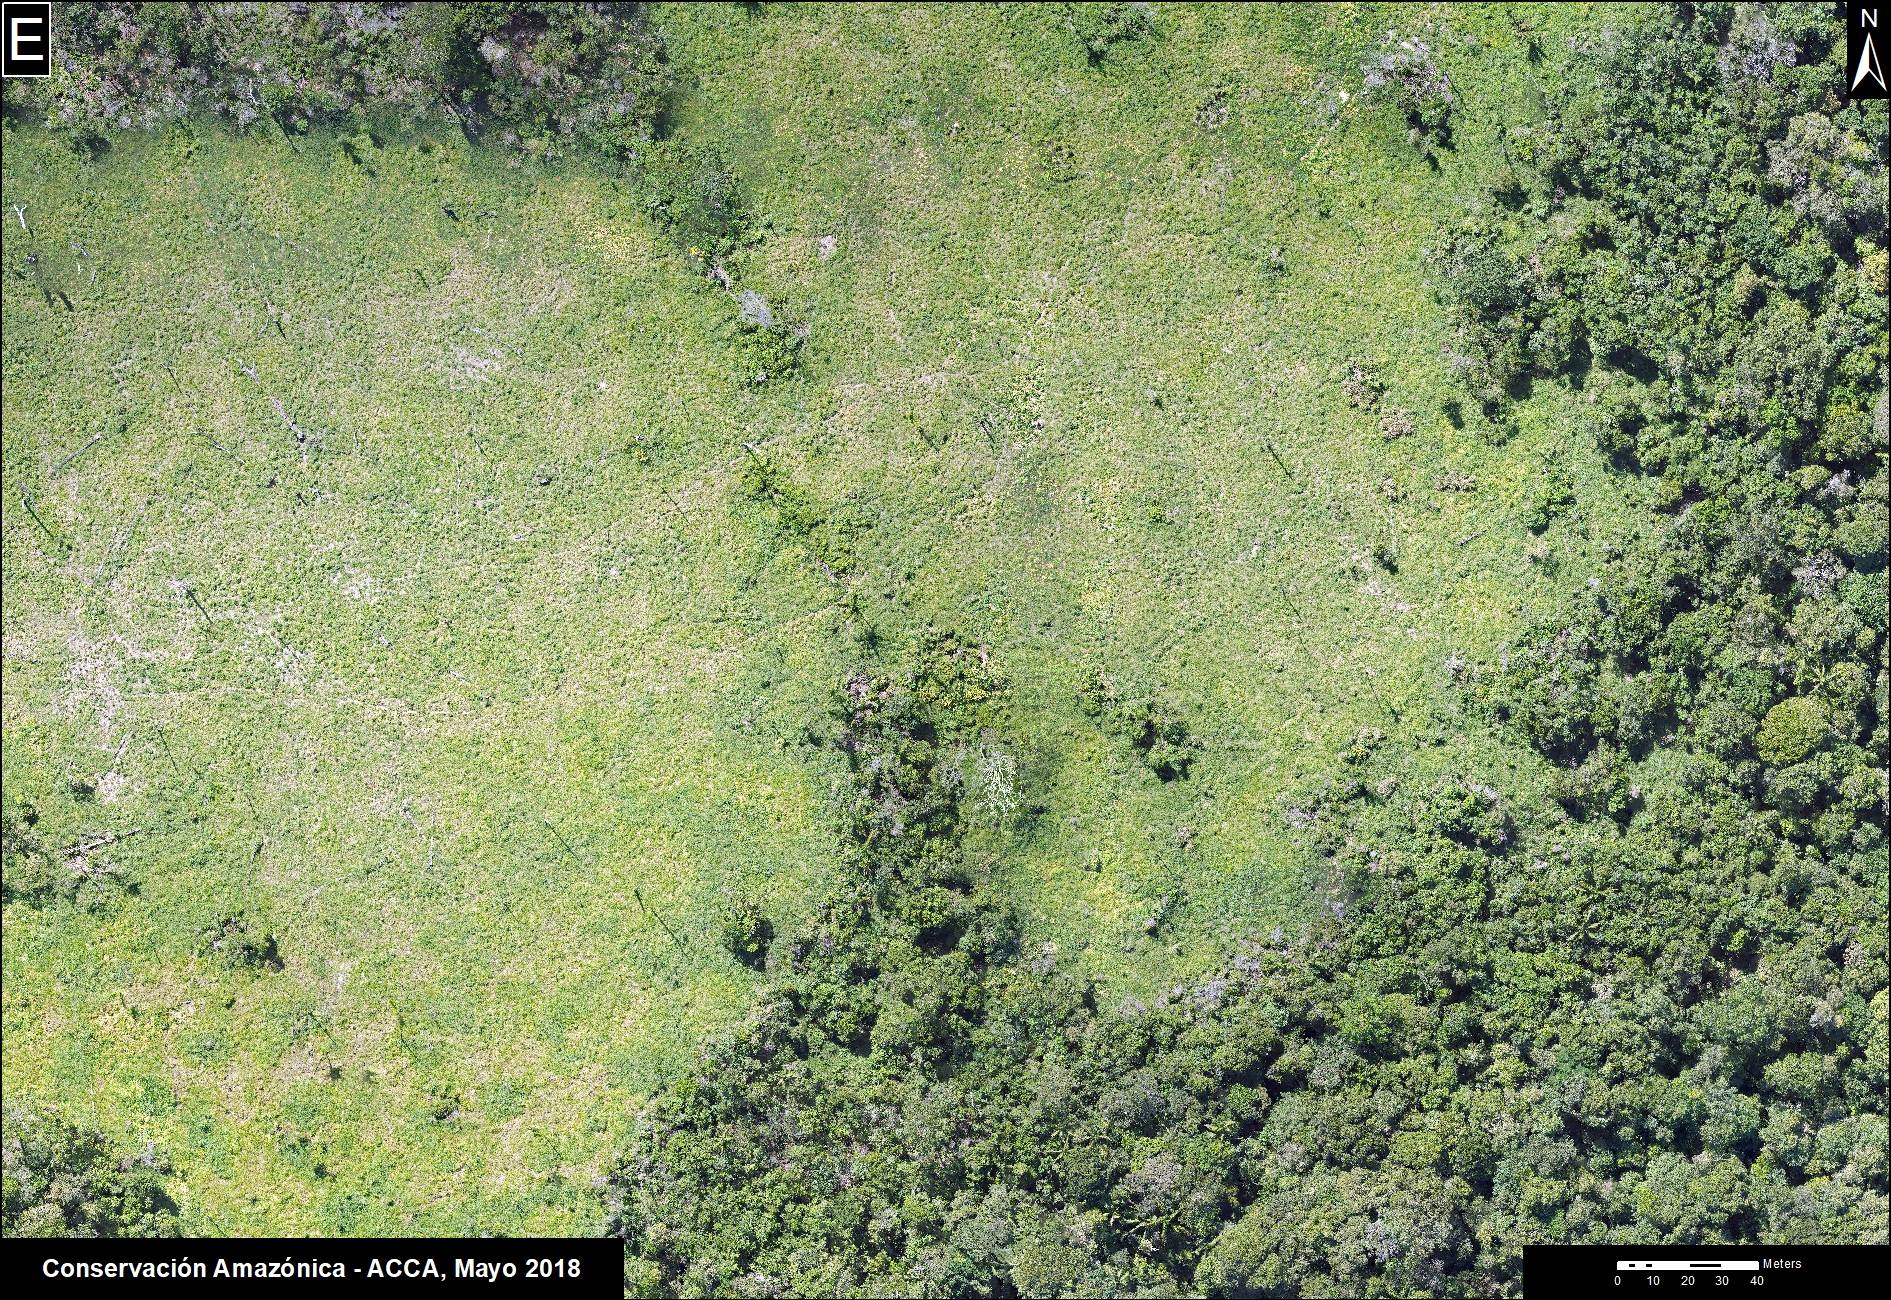
Iberia (Inset E)

On the other side of Madre de Dios, along the Interoceanic Highway near the border with Brazil and Bolivia, is the town of Iberia. This area has become a major deforestation hotspot in recent years. We documented the deforestation of 2,250 acres (910 hectares) in 2017 (Image 76e). Since 2014, the total deforestation around Iberia is 6,795 acres (2,750) hectares. A large part of the deforestation is within forestry concessions, indicating that these concessions have been invaded. The cause of the deforestation is small-scale agriculture (specifically, according to local sources, corn, papaya, and cacao).

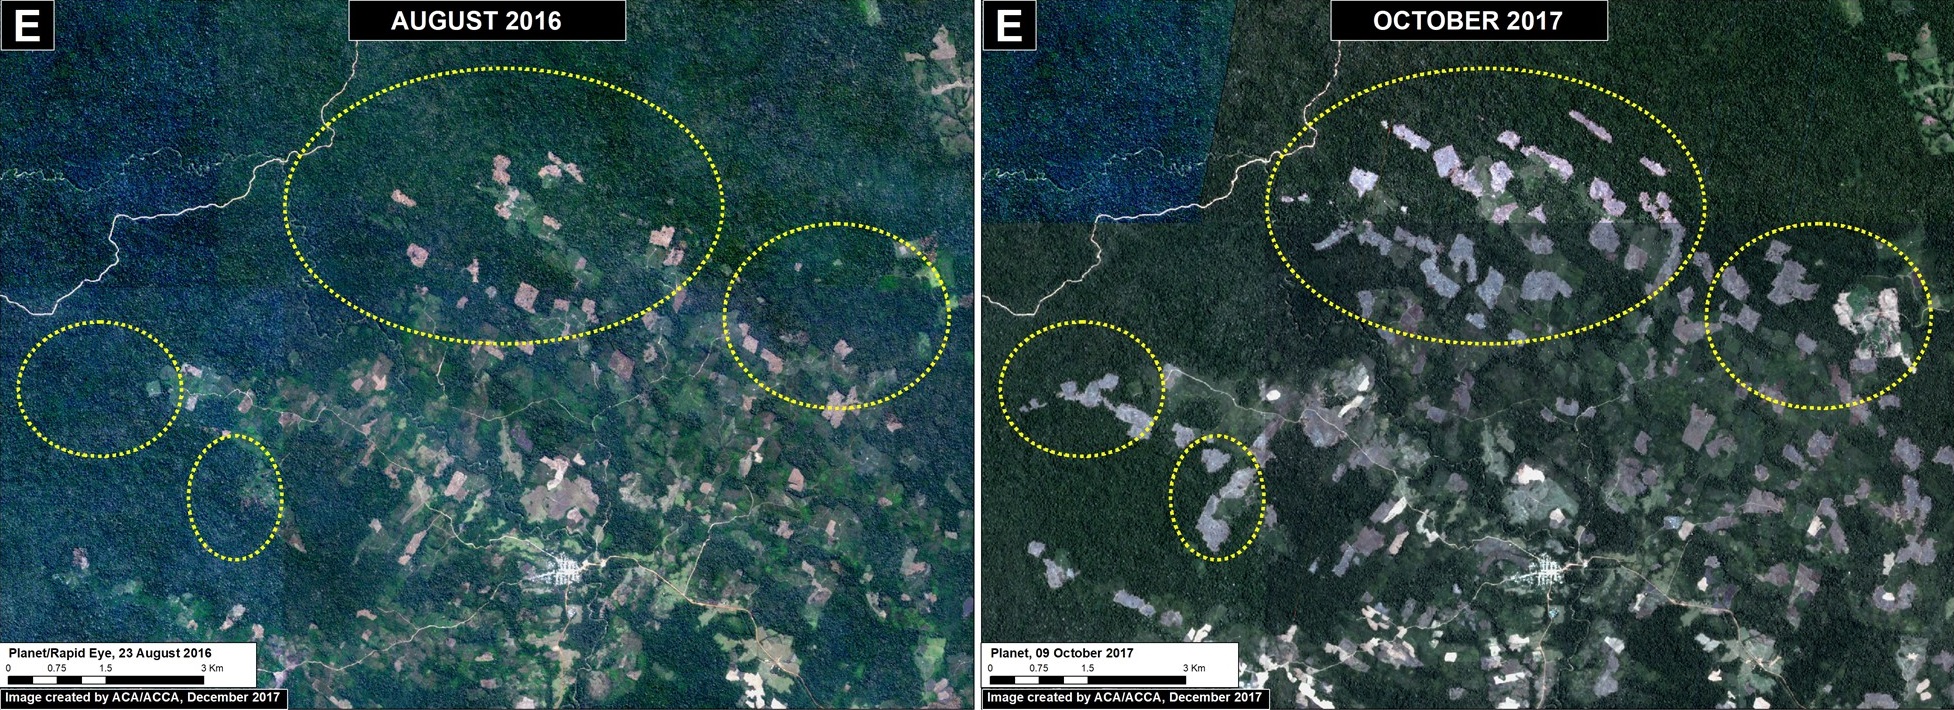
Image 76e. Data: Planet
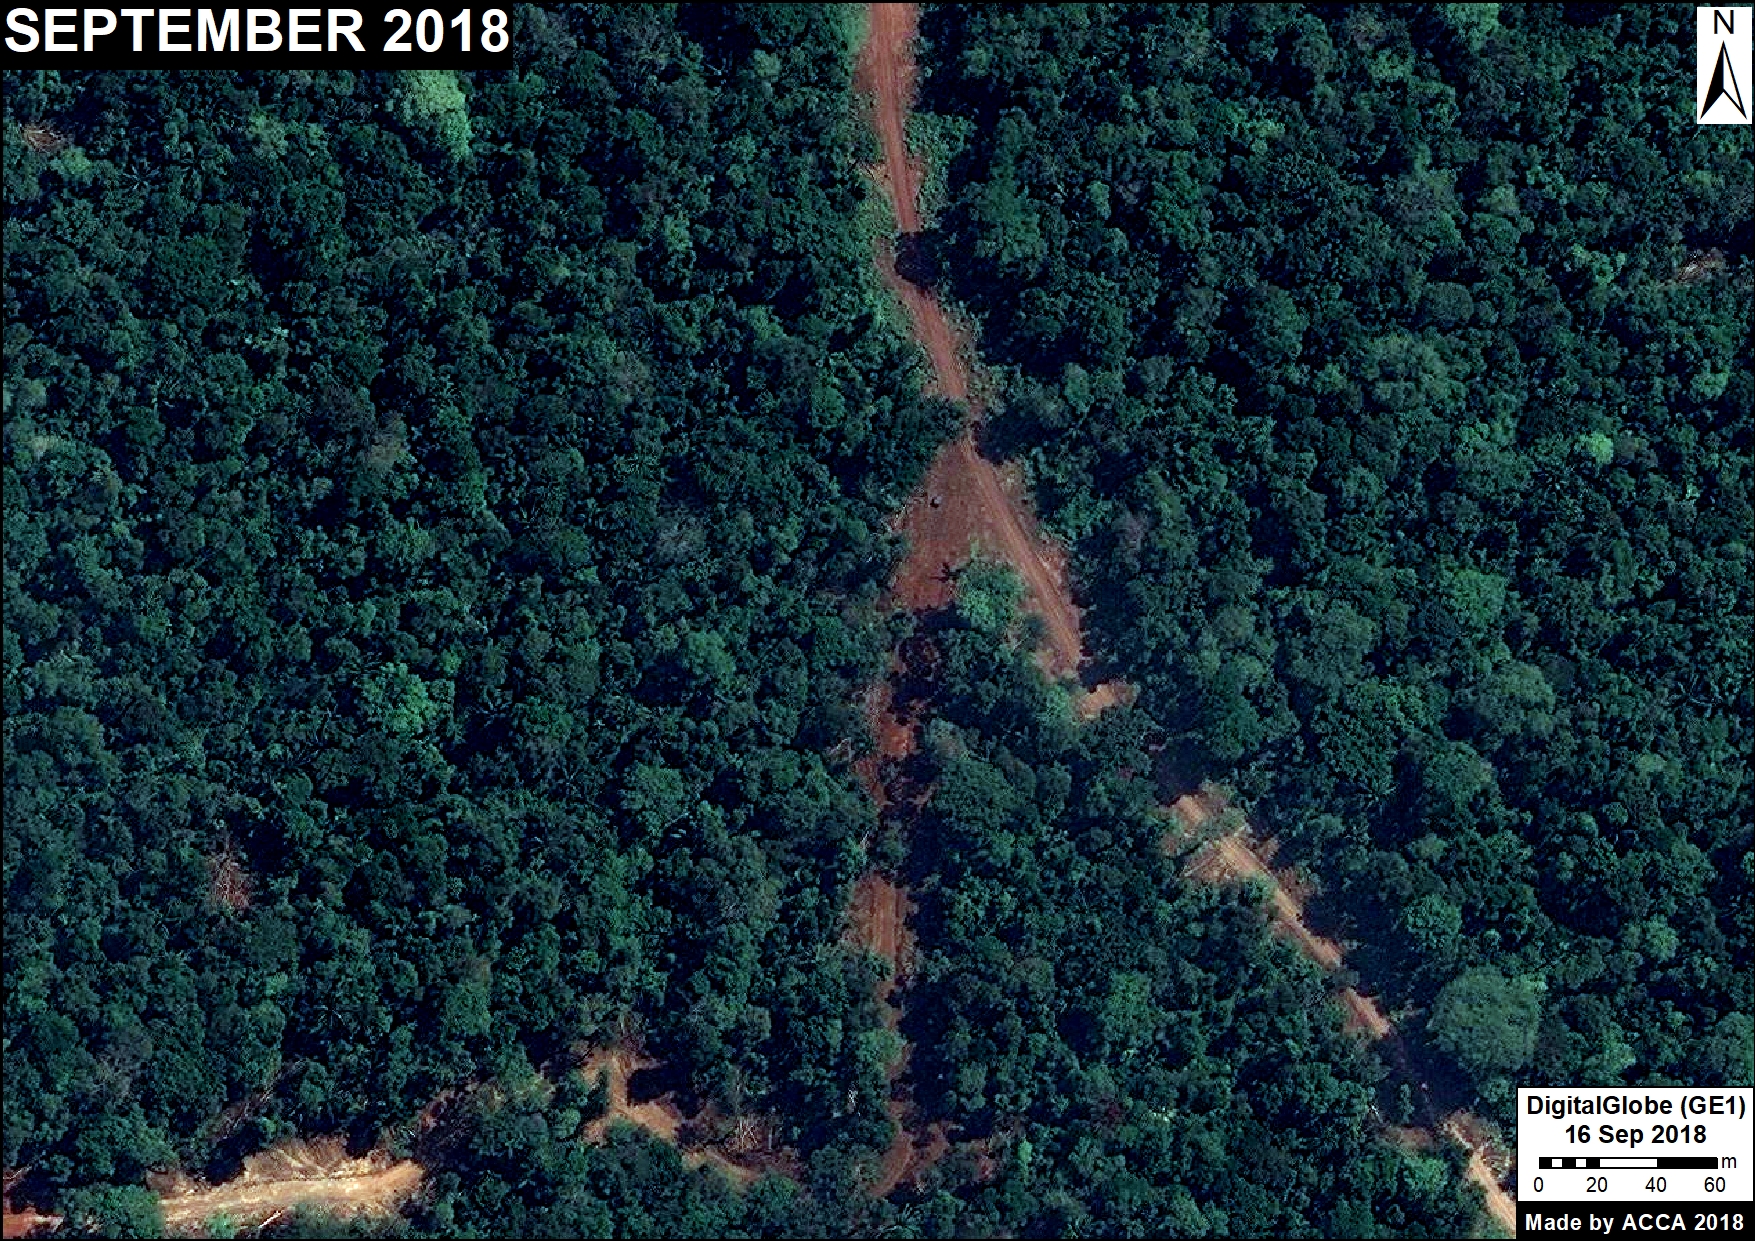
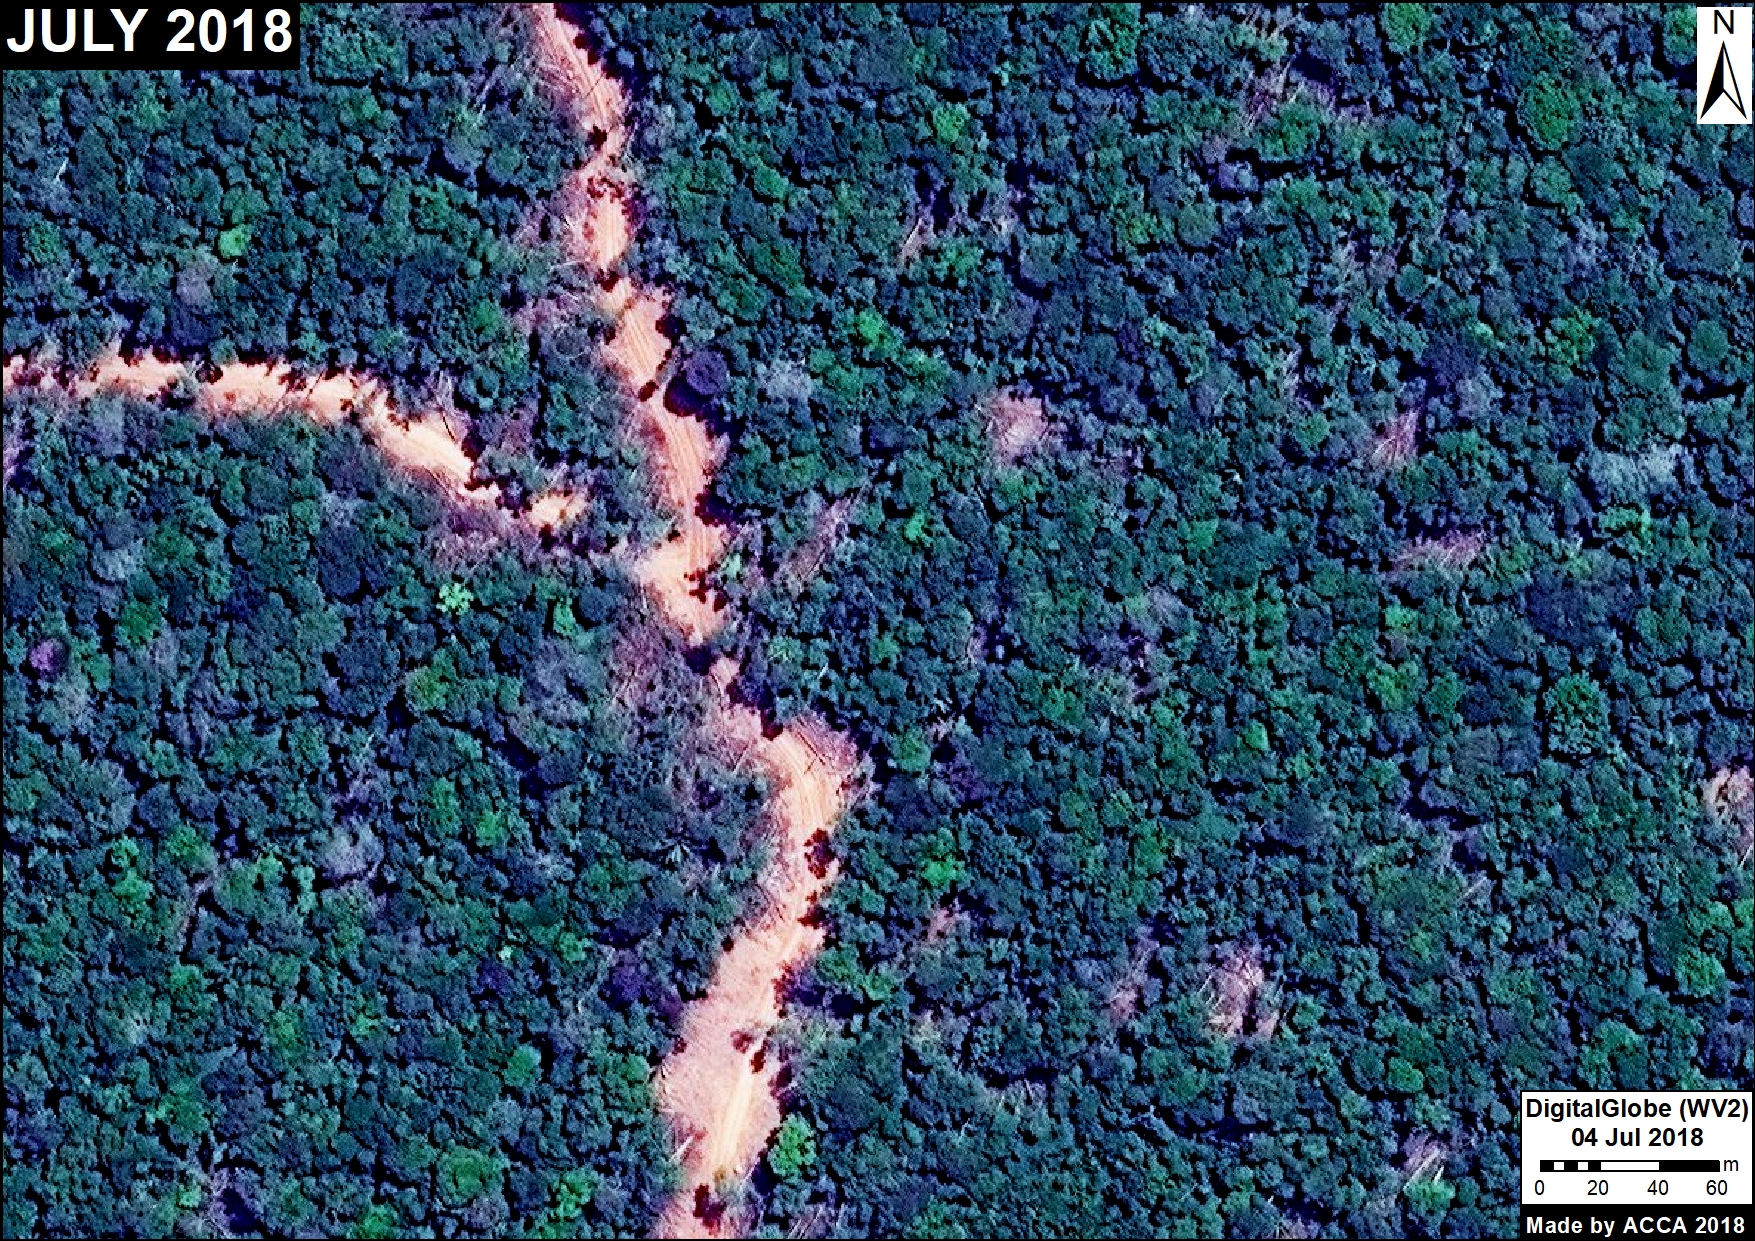
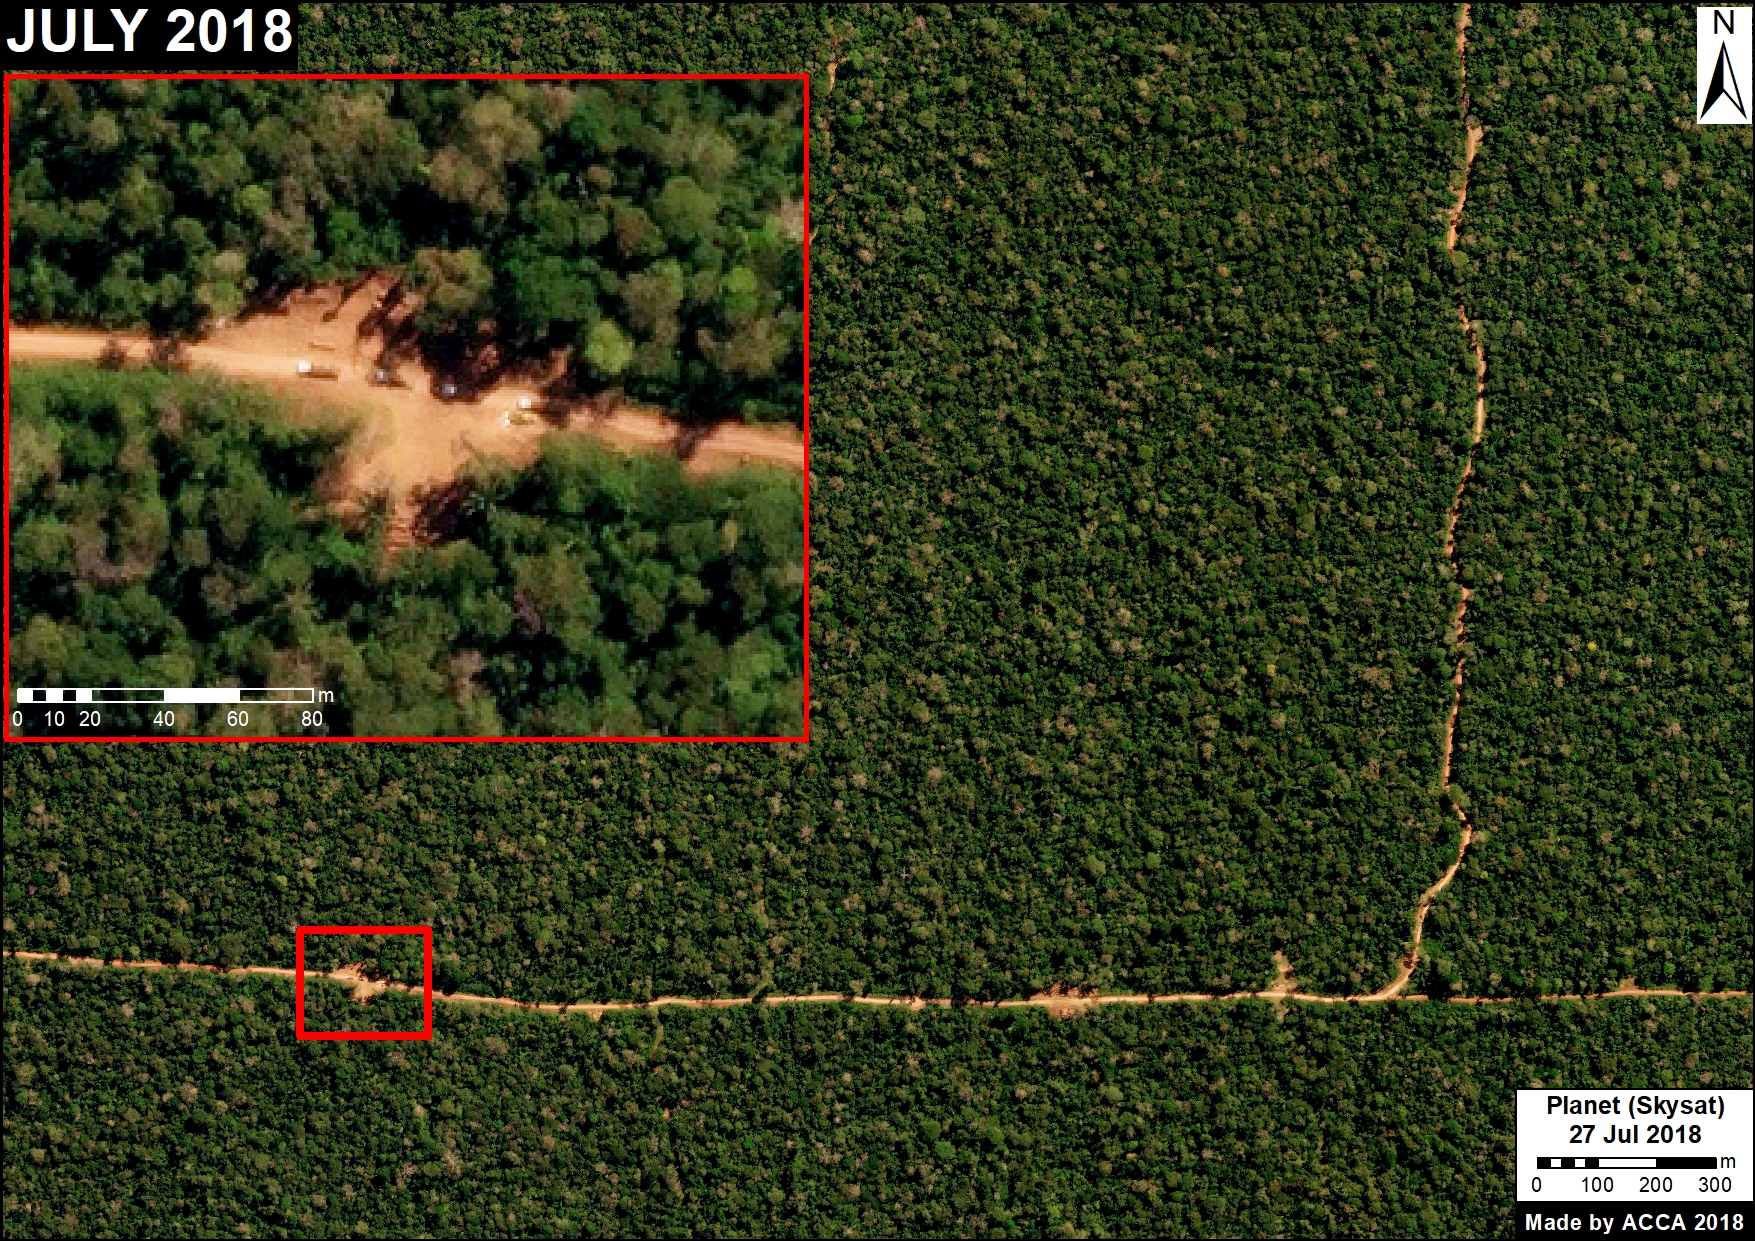
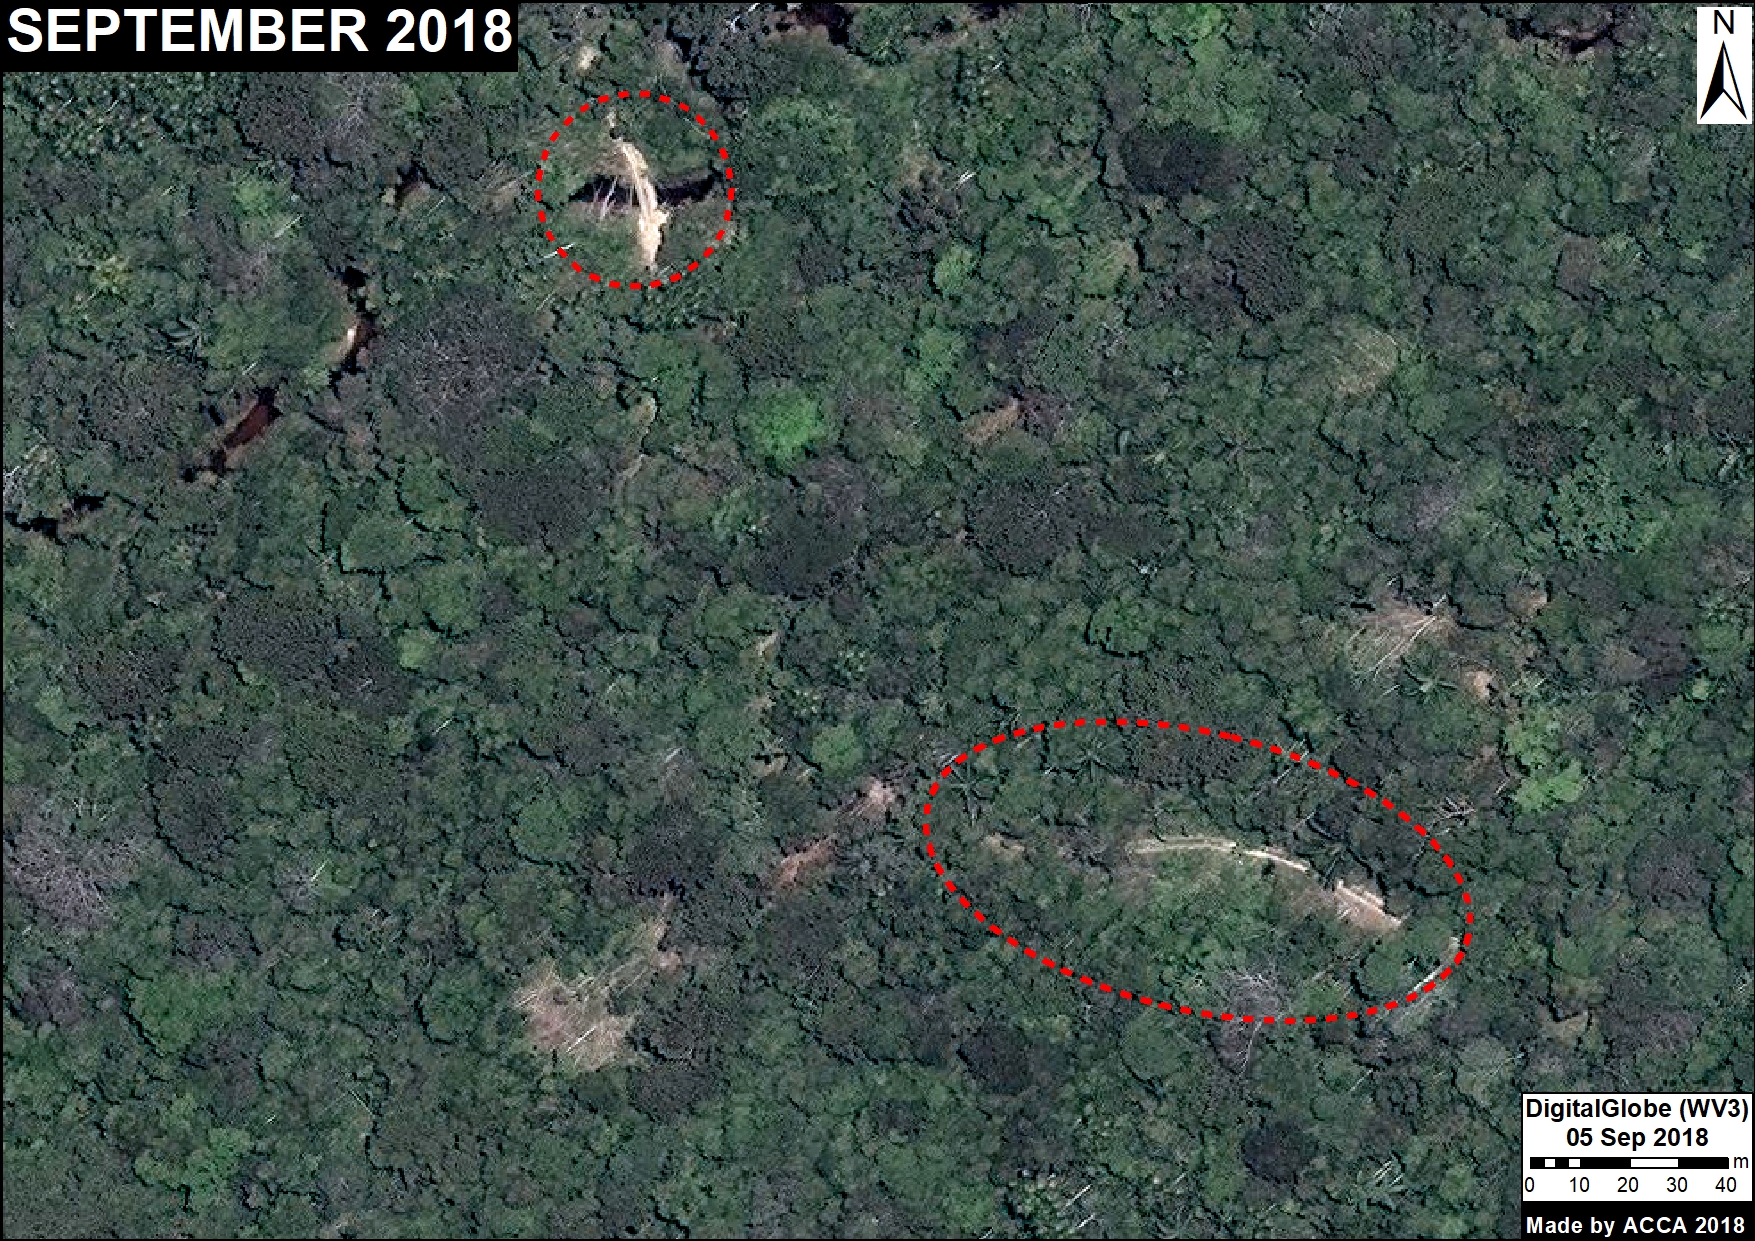
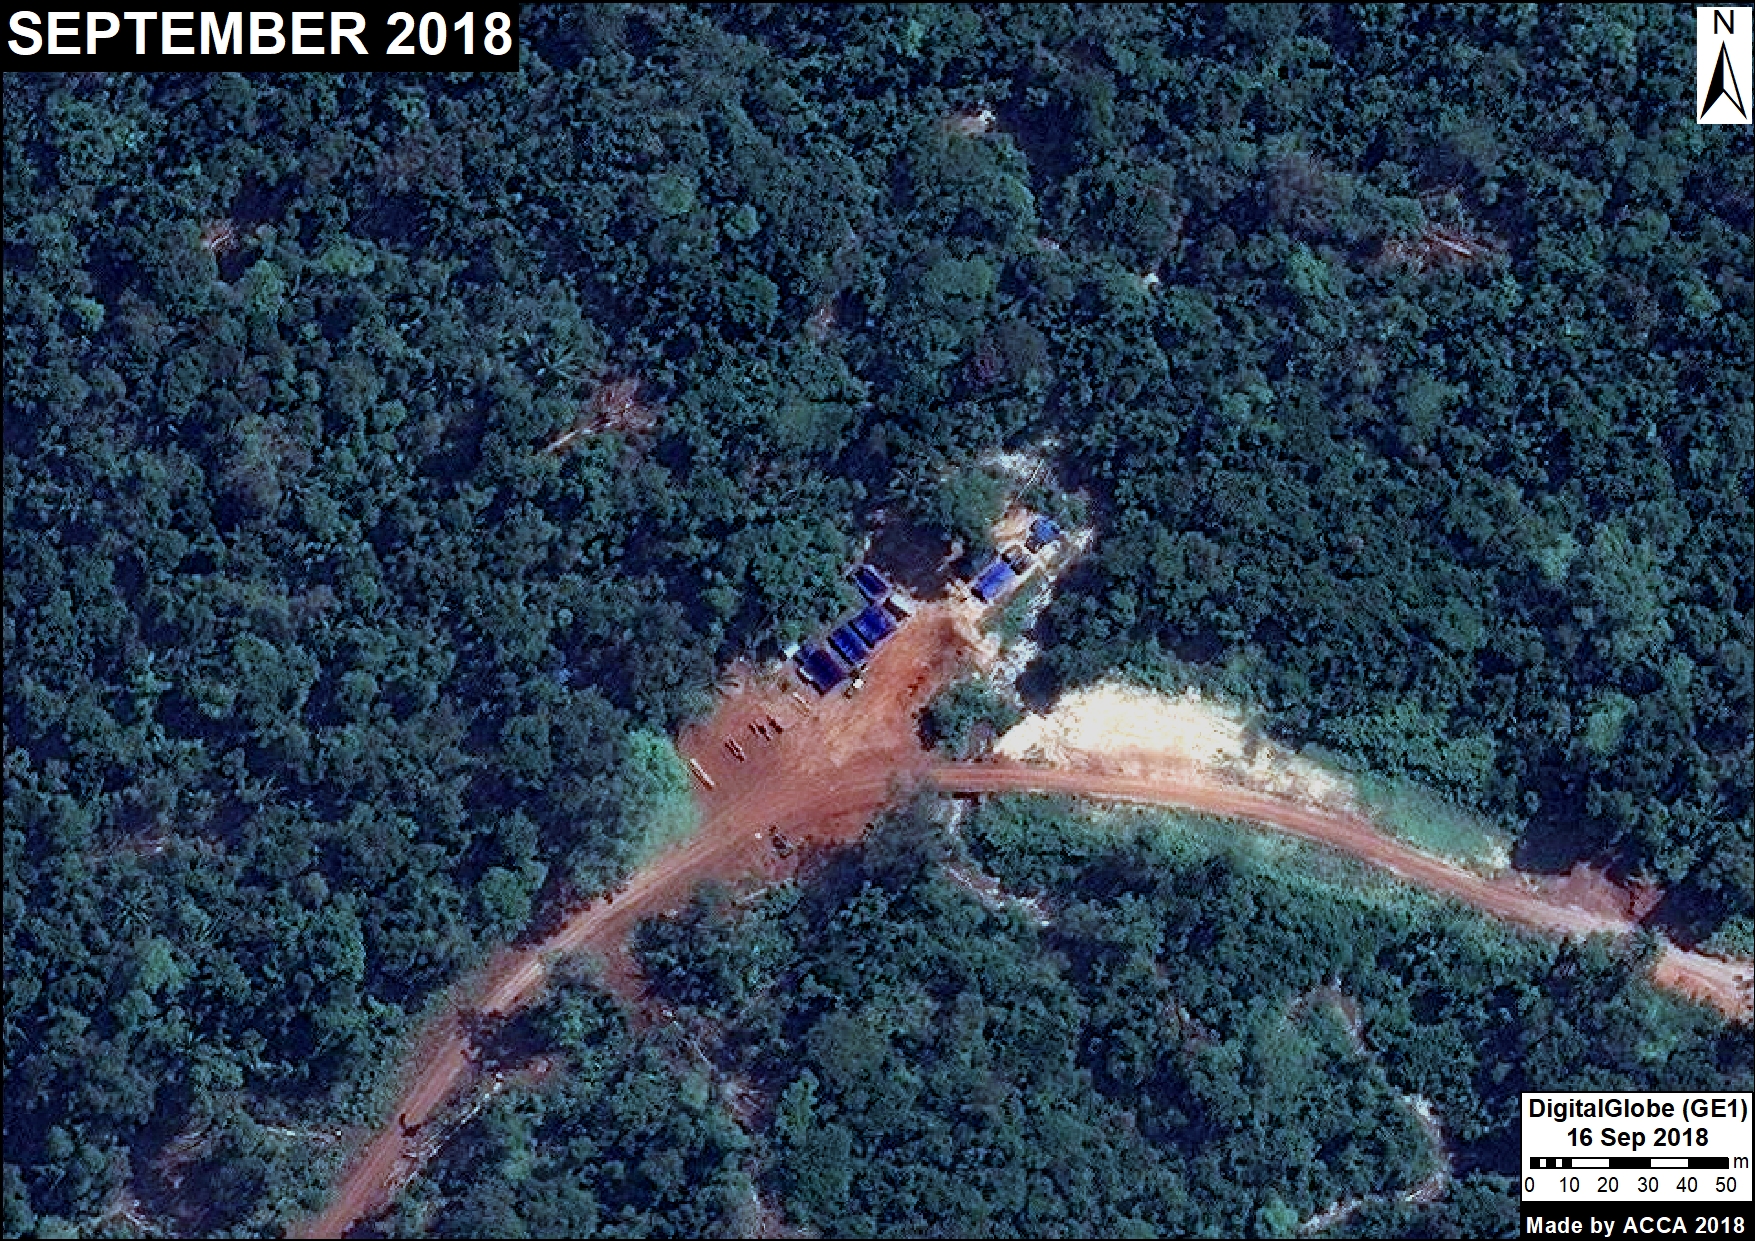
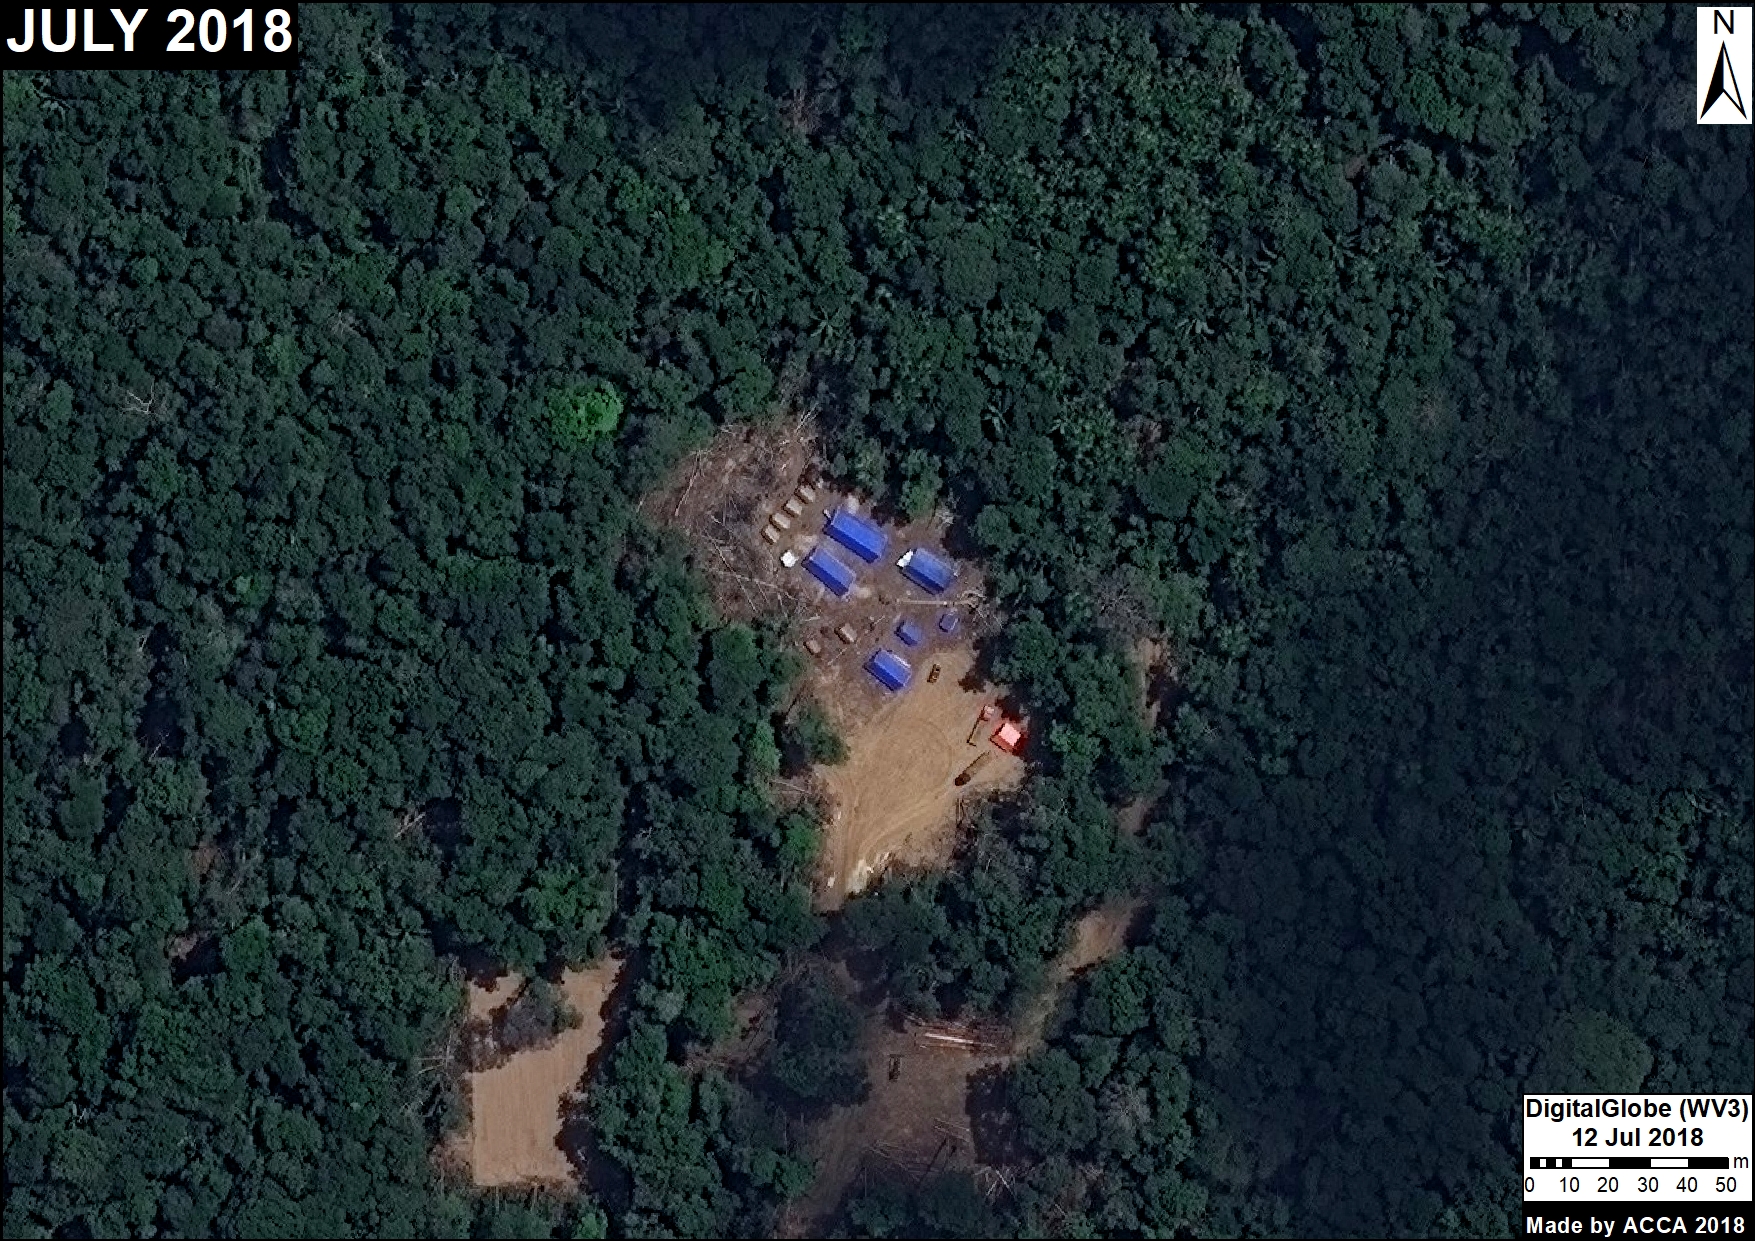
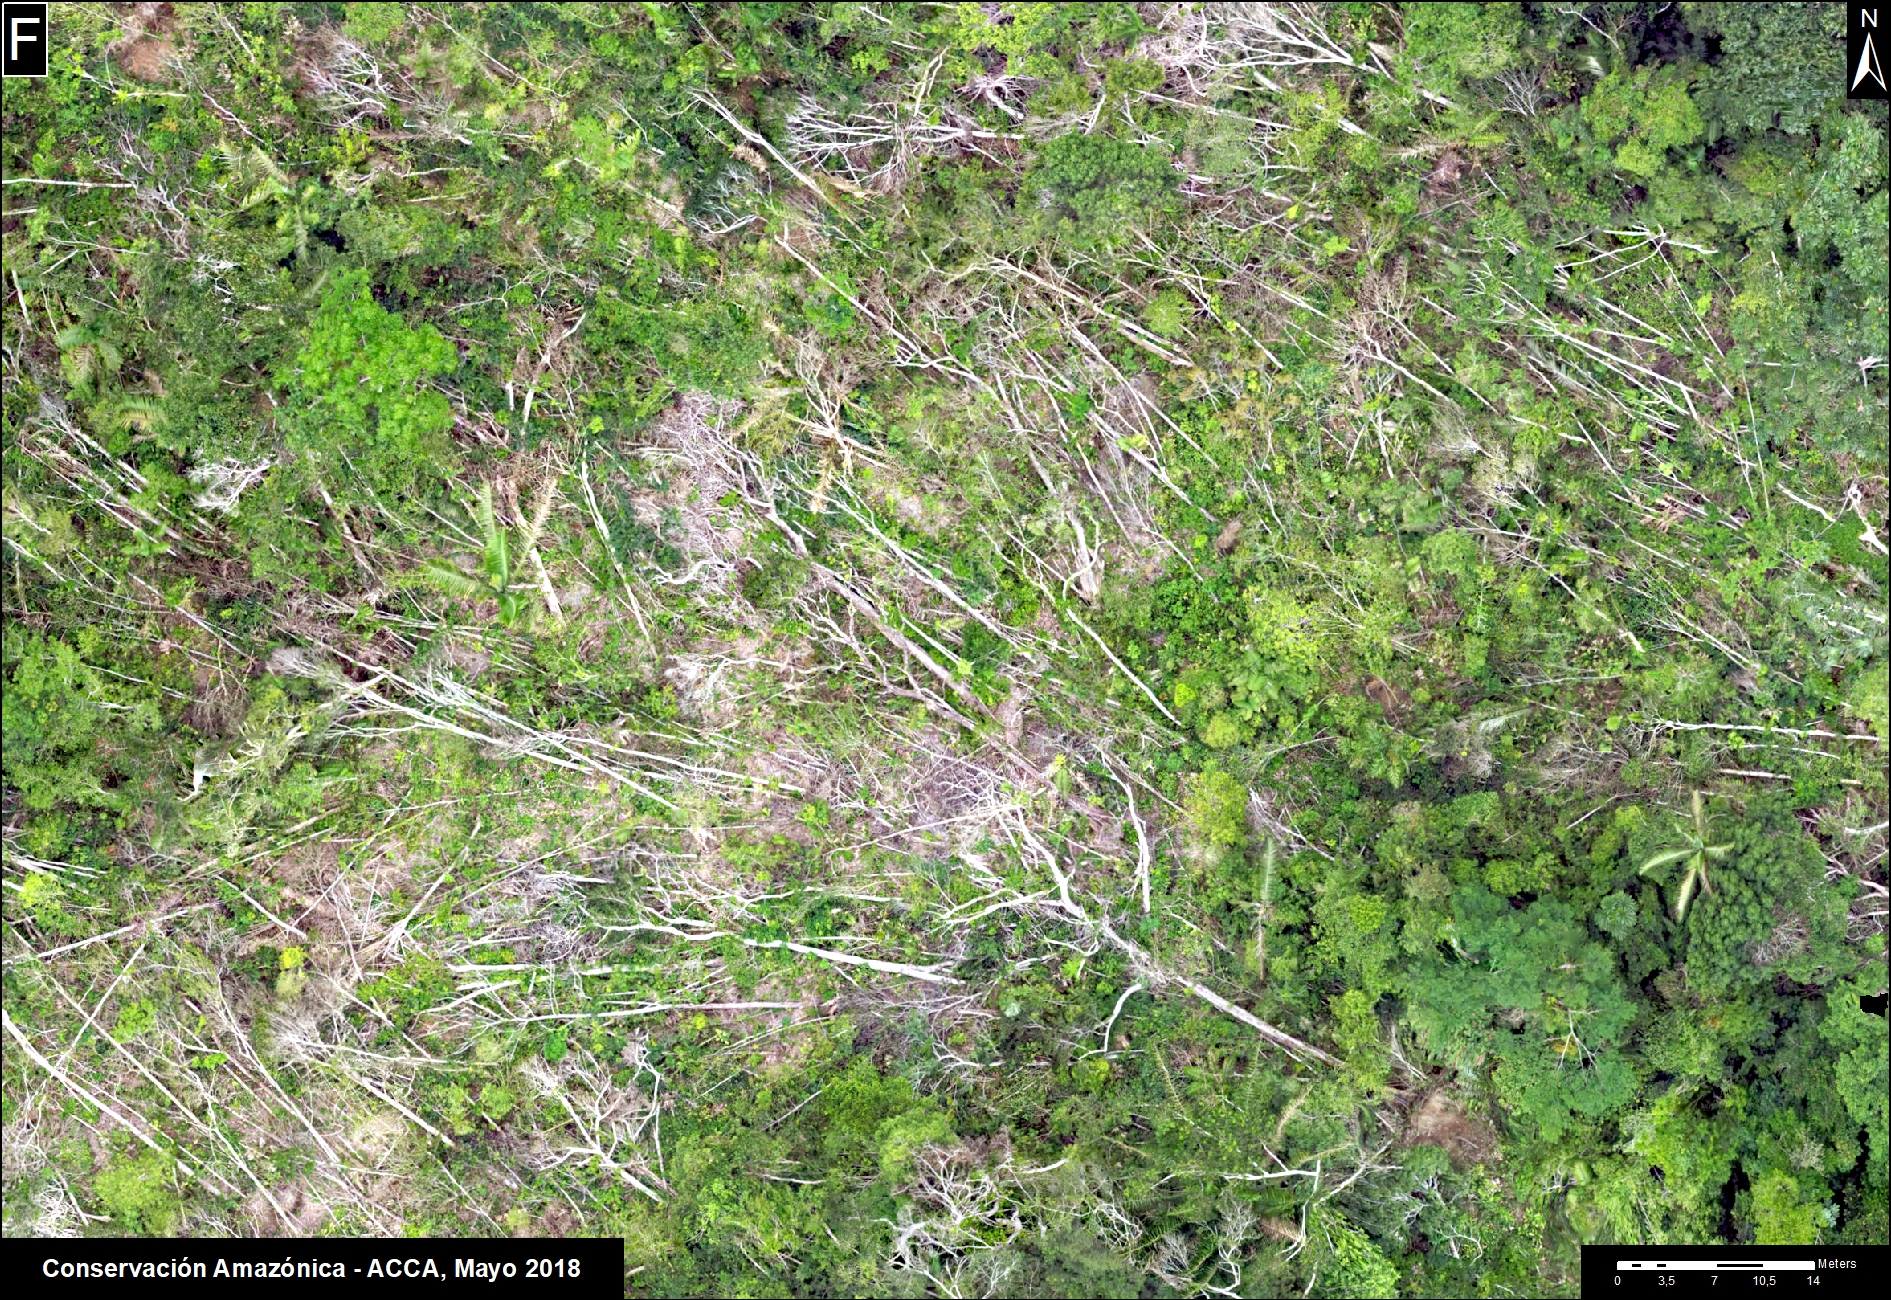
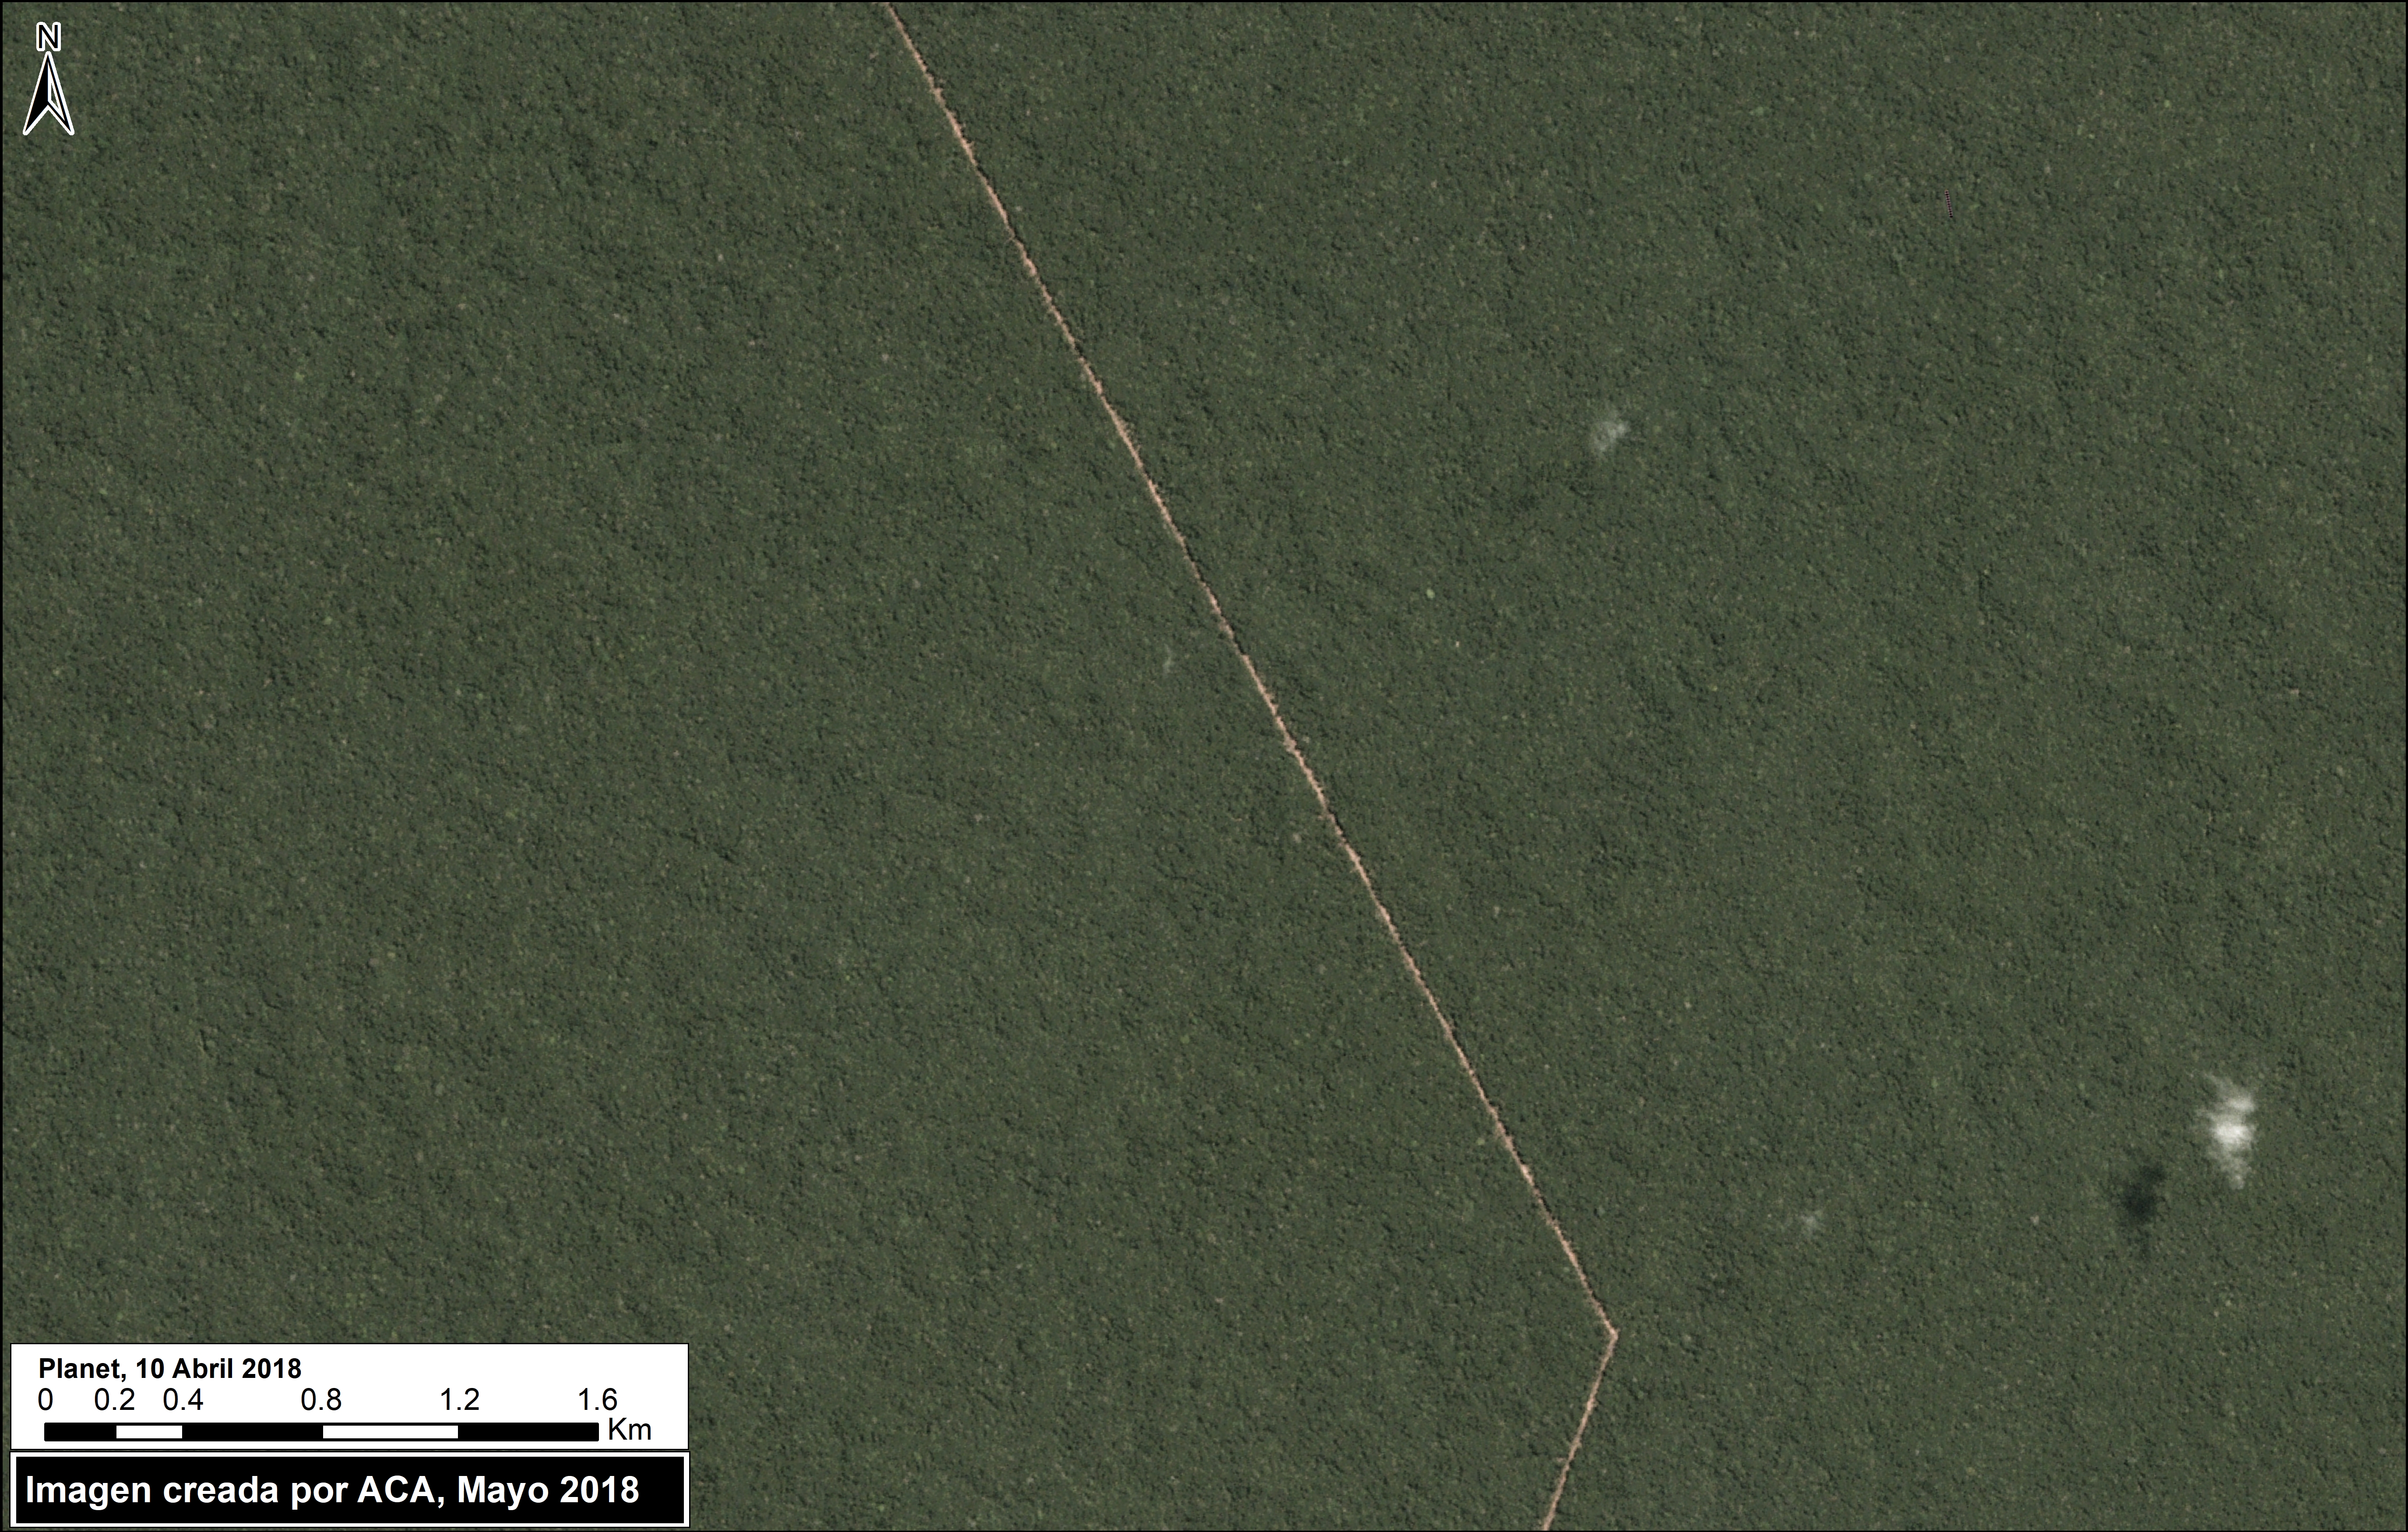
Tahuamanu (Inset F)

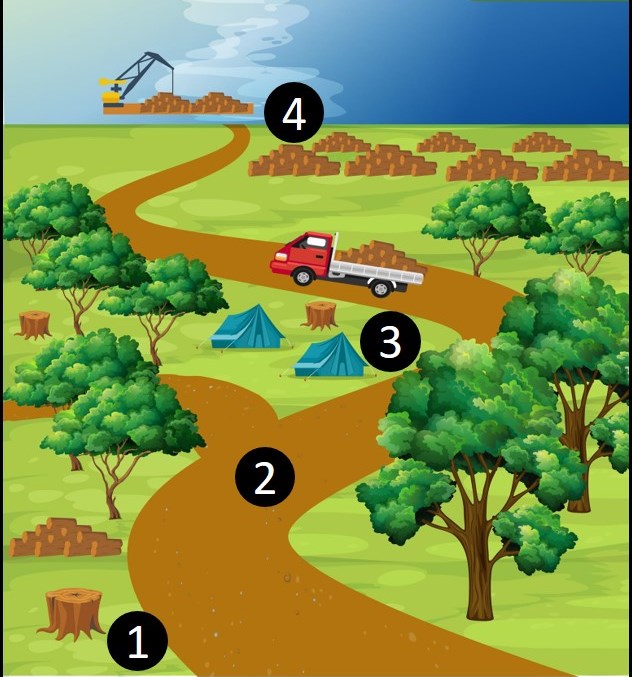
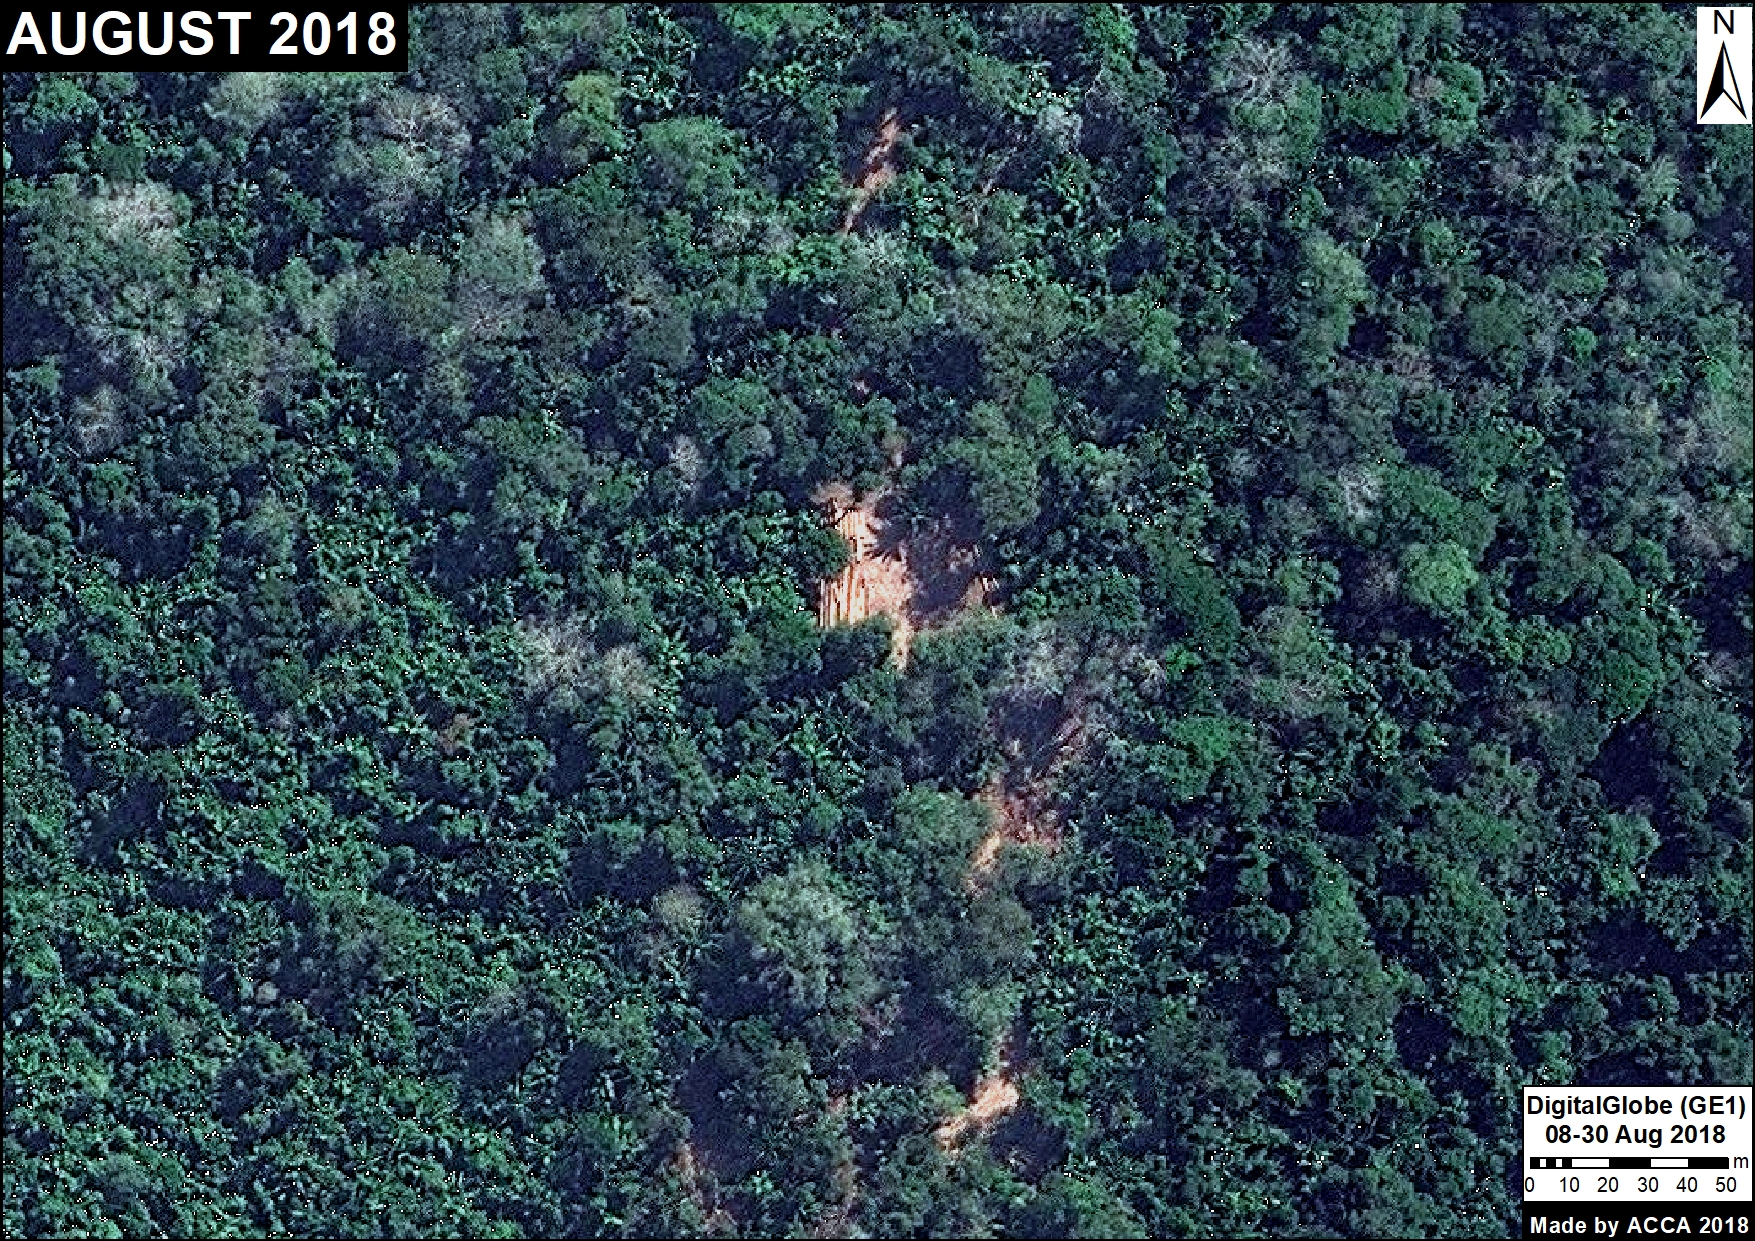
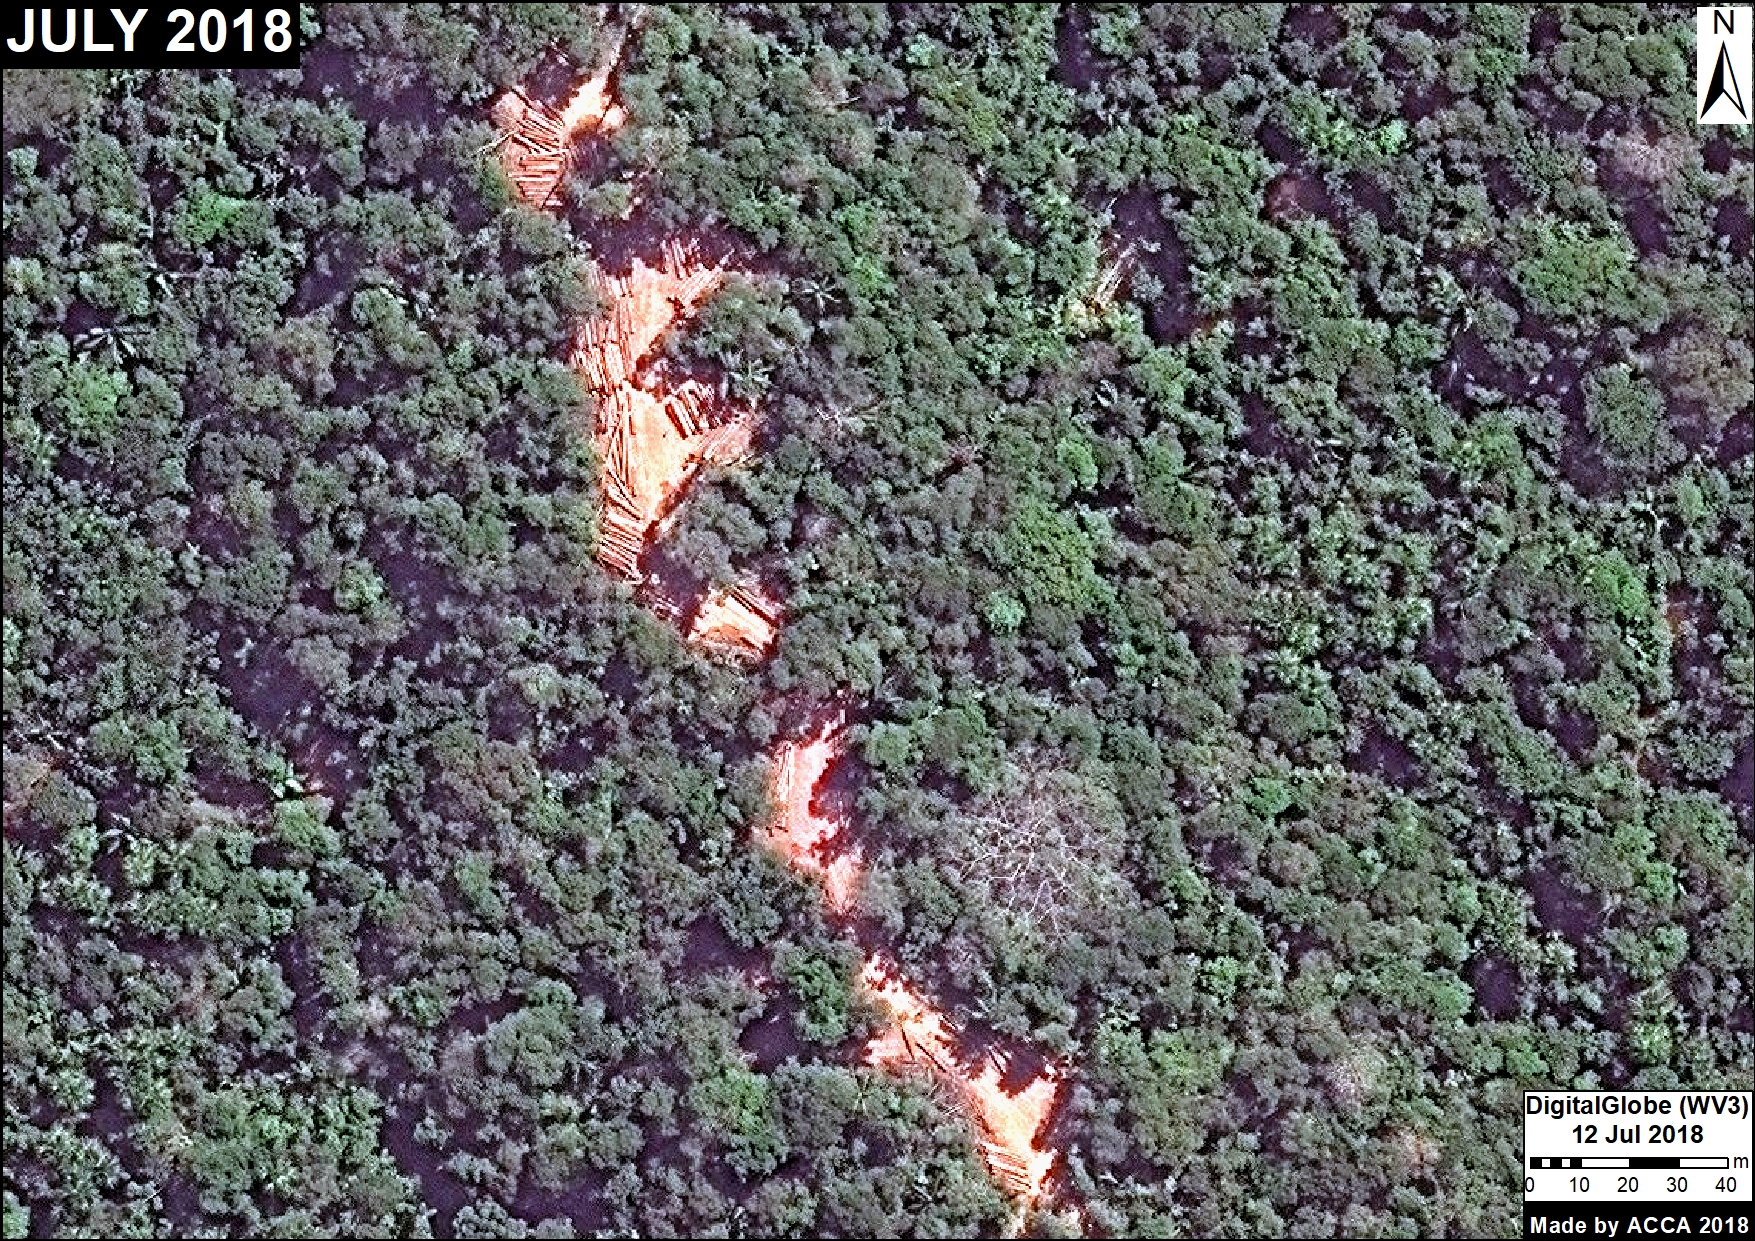
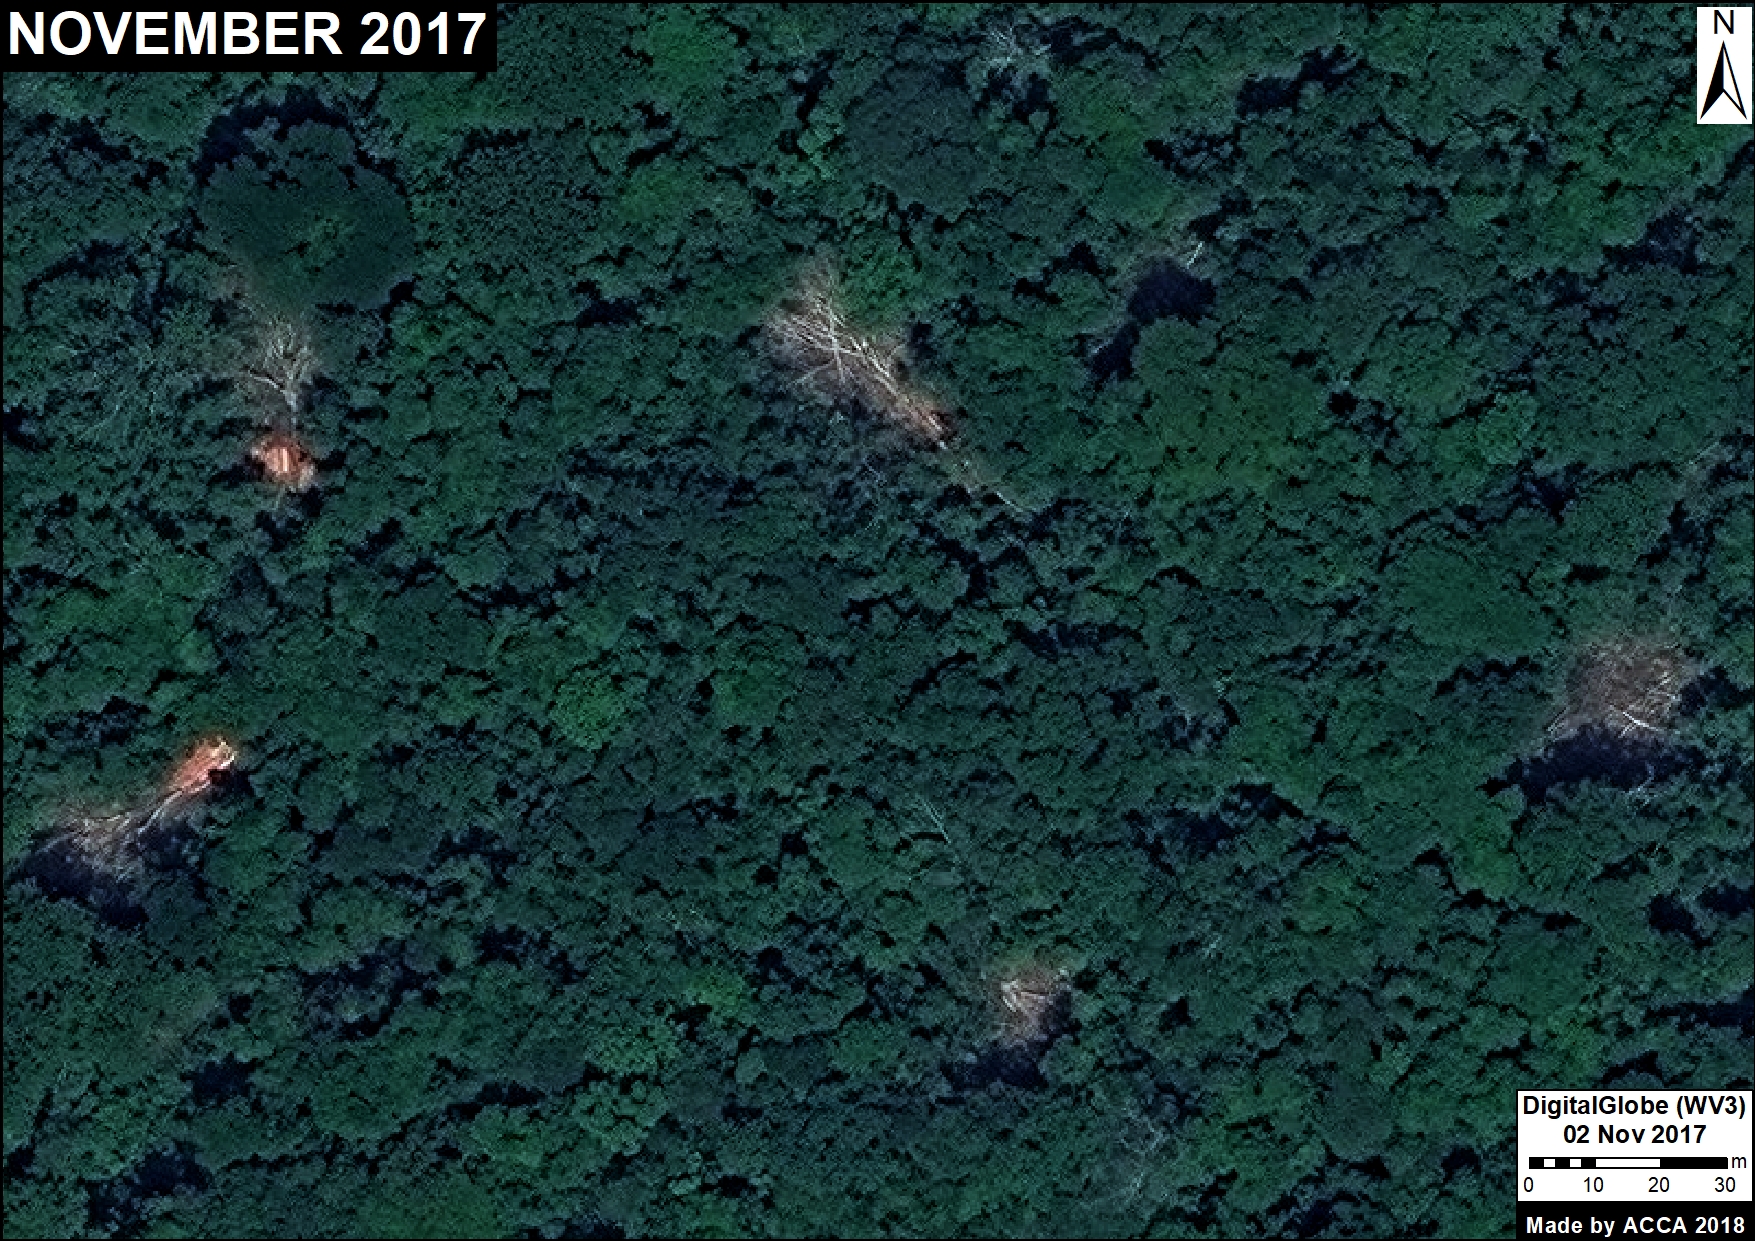
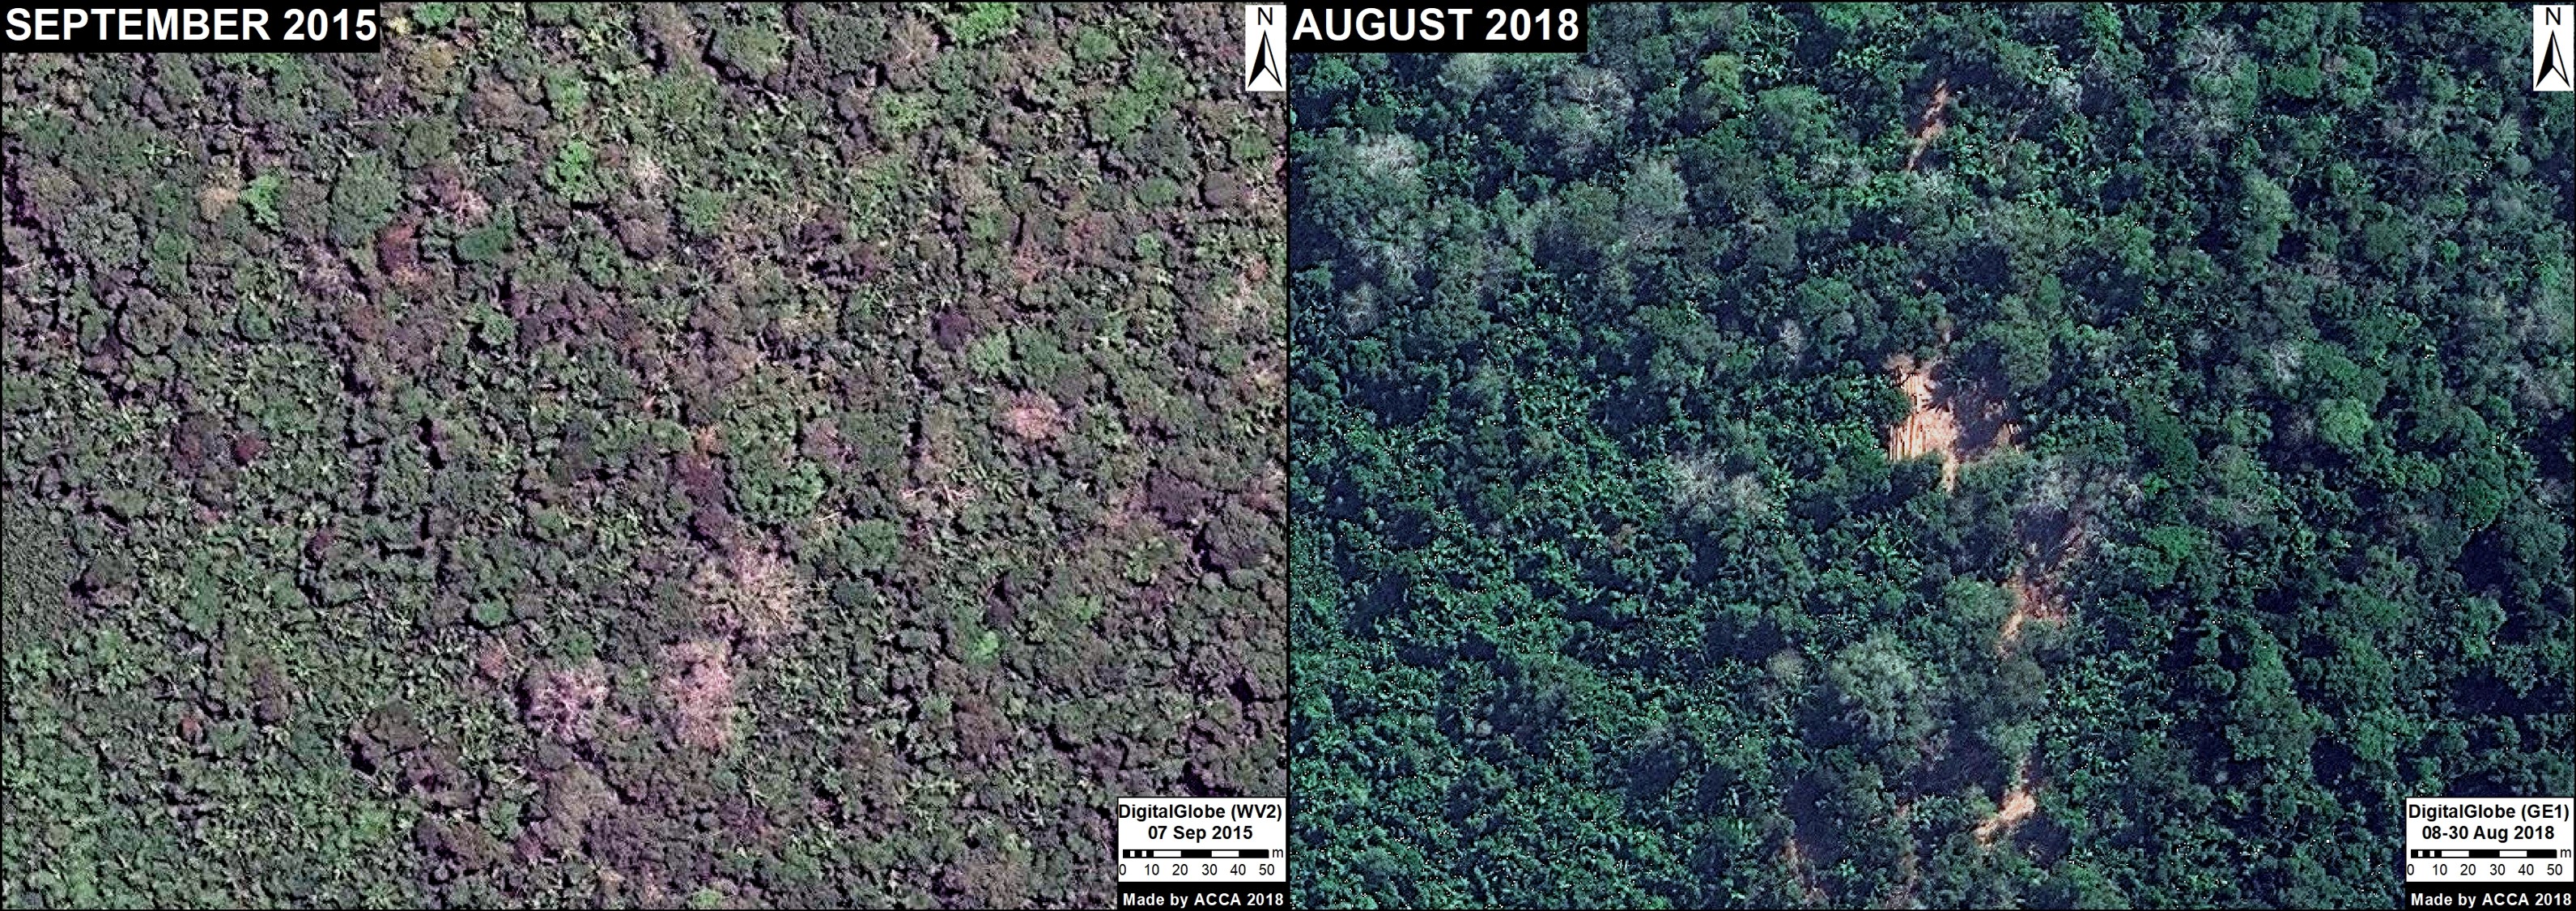
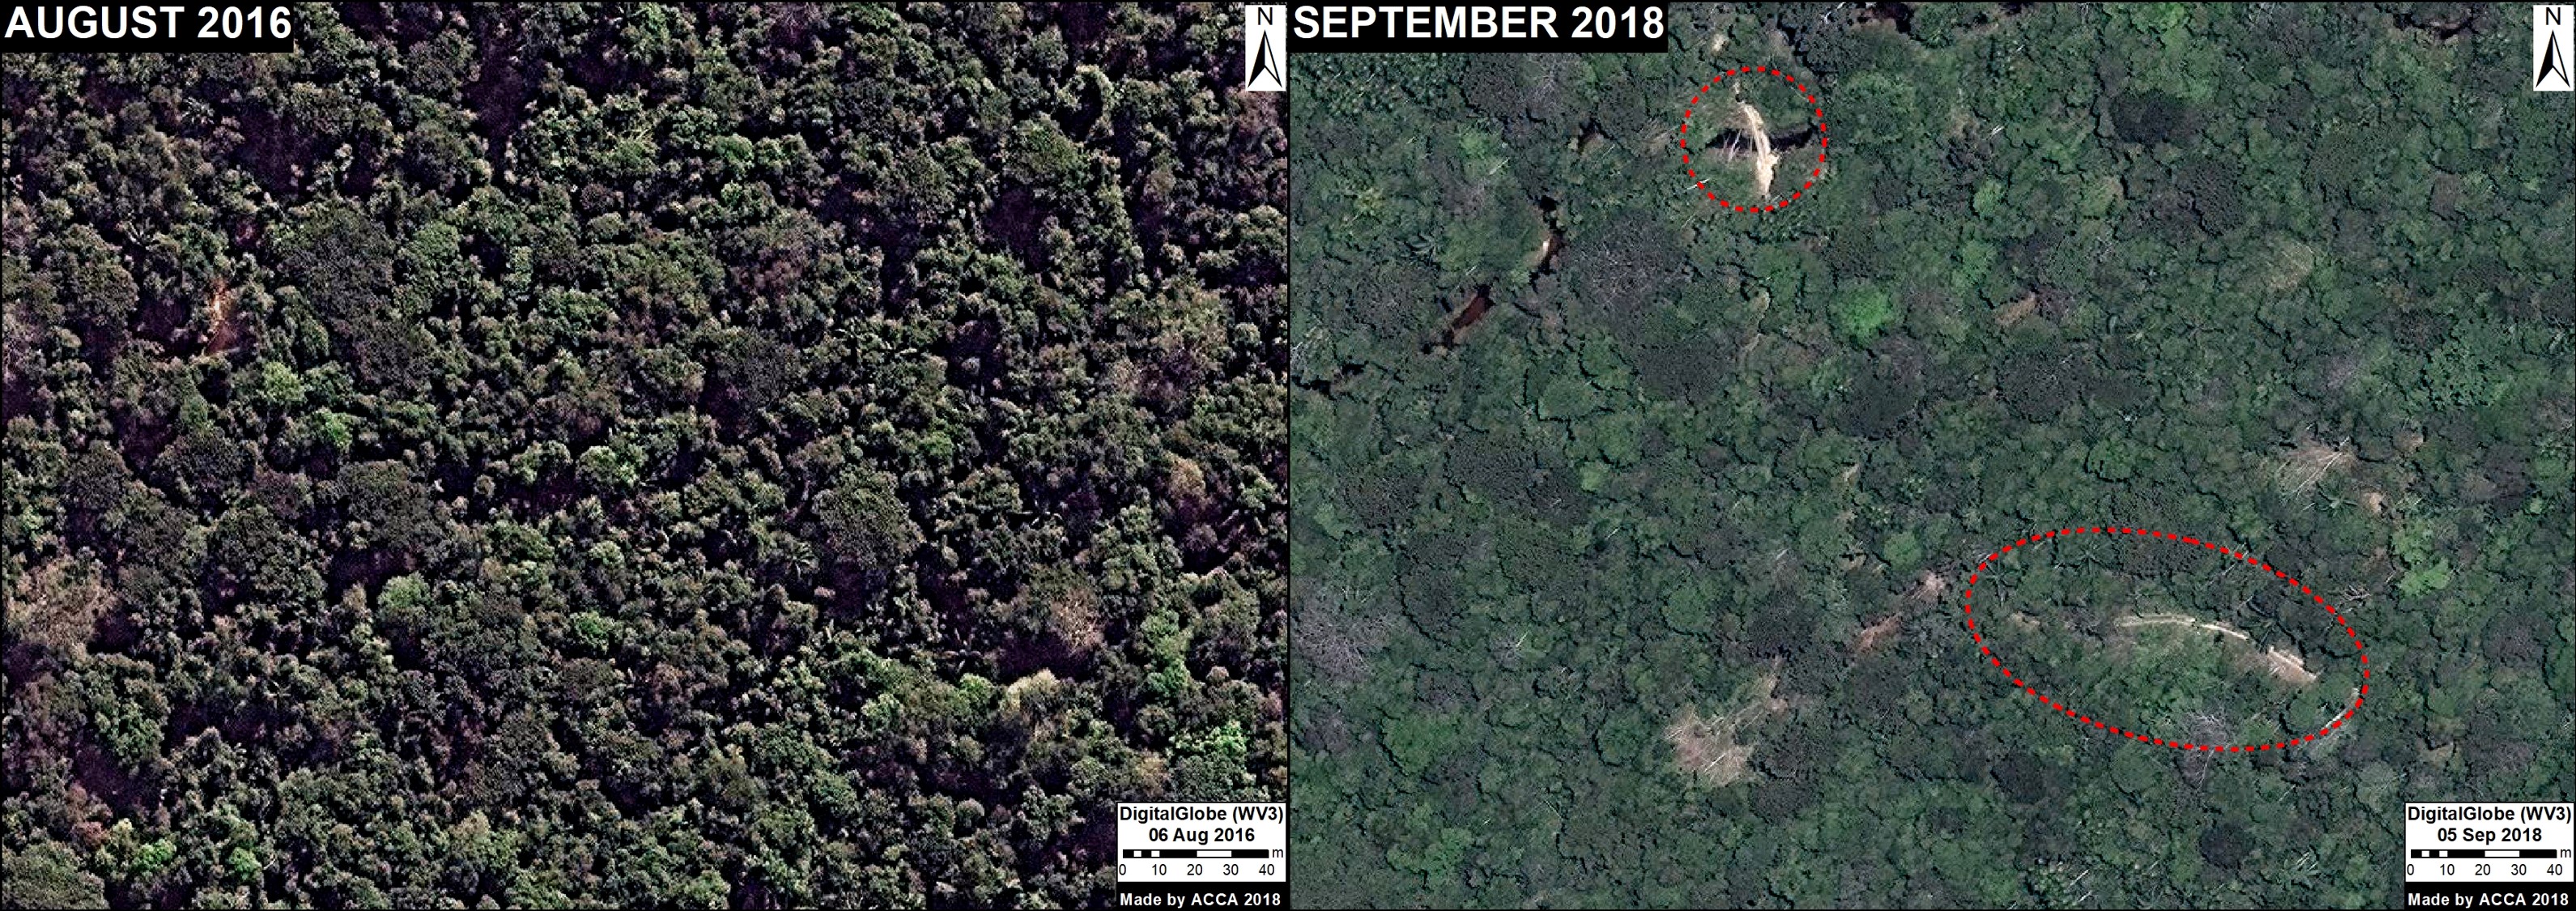
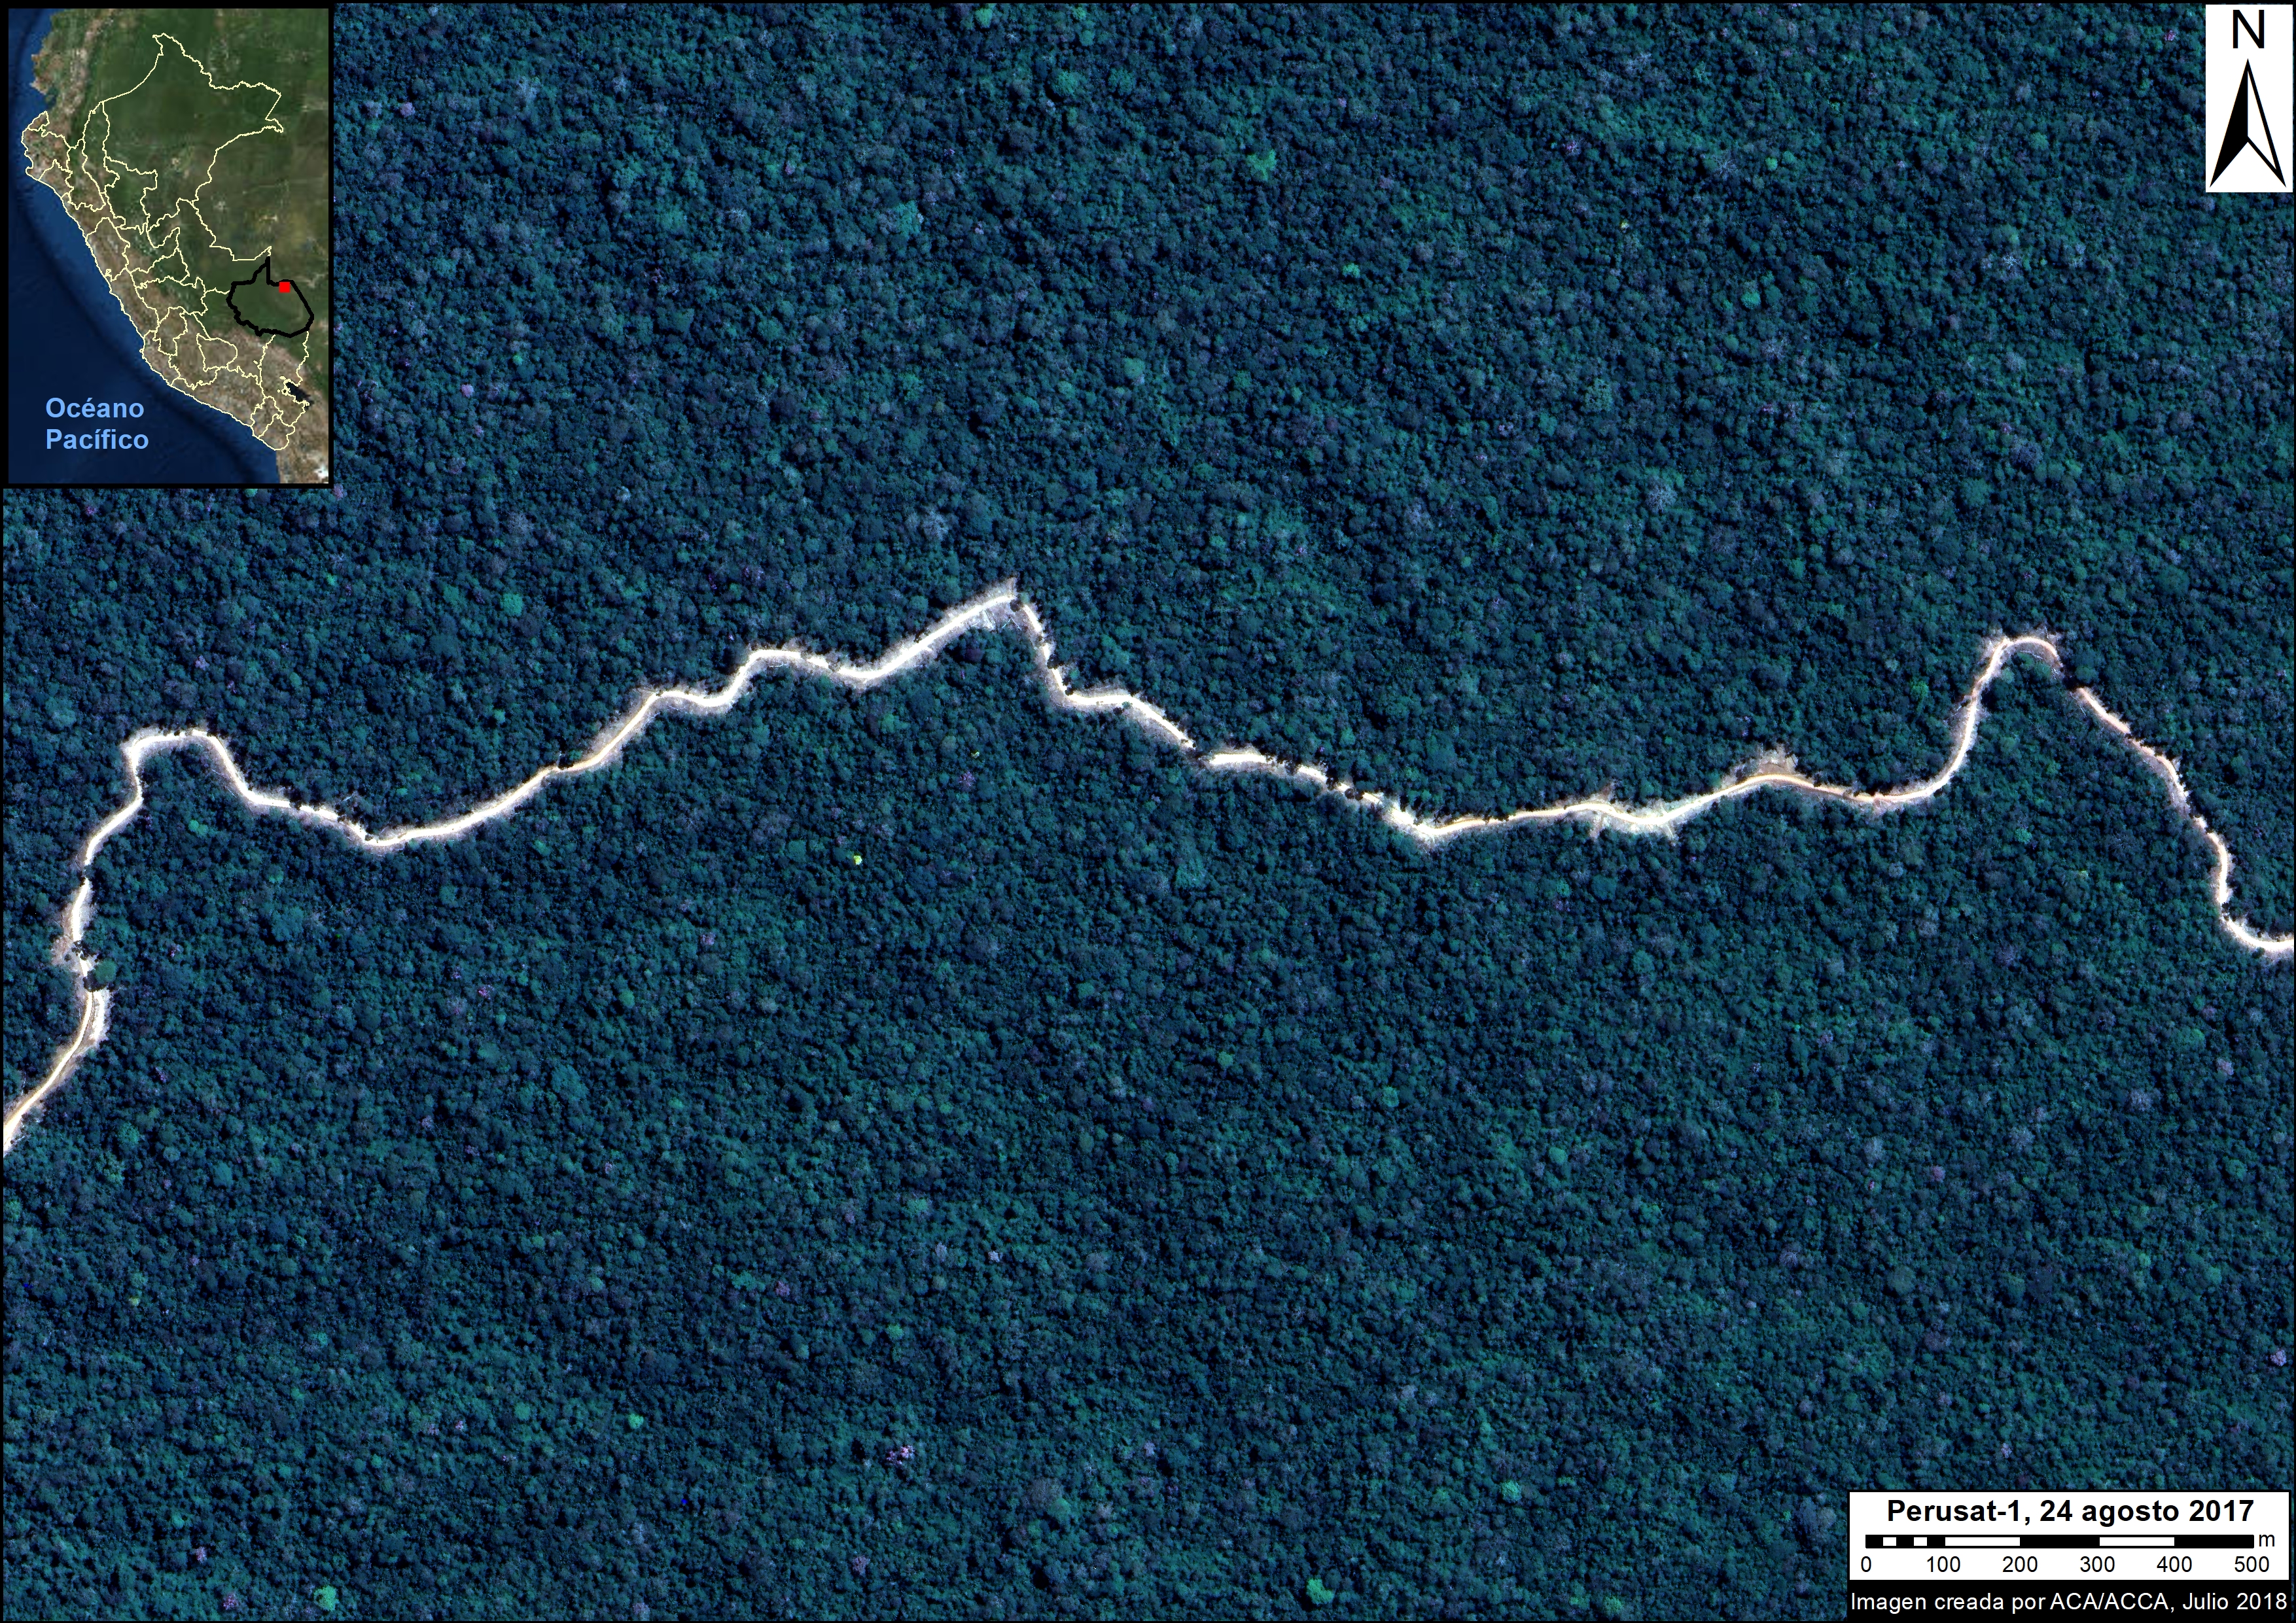
To the west of Iberia, an isolated hotspot emerged caused by the rapid proliferation of logging roads. This hotspot is located within a forestry concession, but its impact is troubling due to the extension and density of the new road network. We estimate the construction of 130 km of new logging forest roads in this area in 2017 (Image 76f).

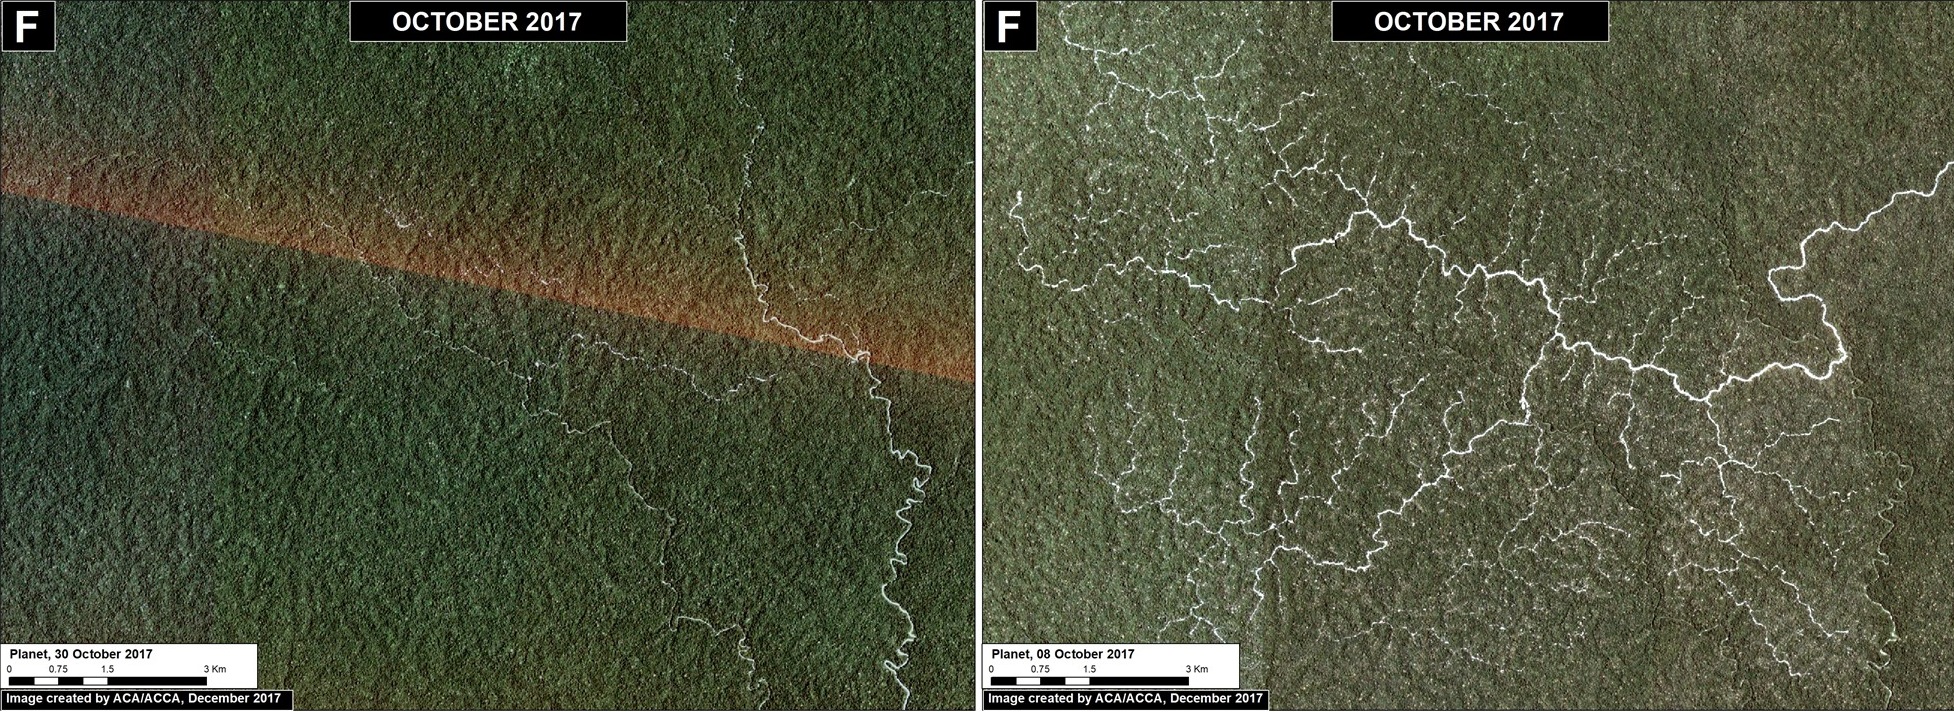
Image 76f. Data: Planet

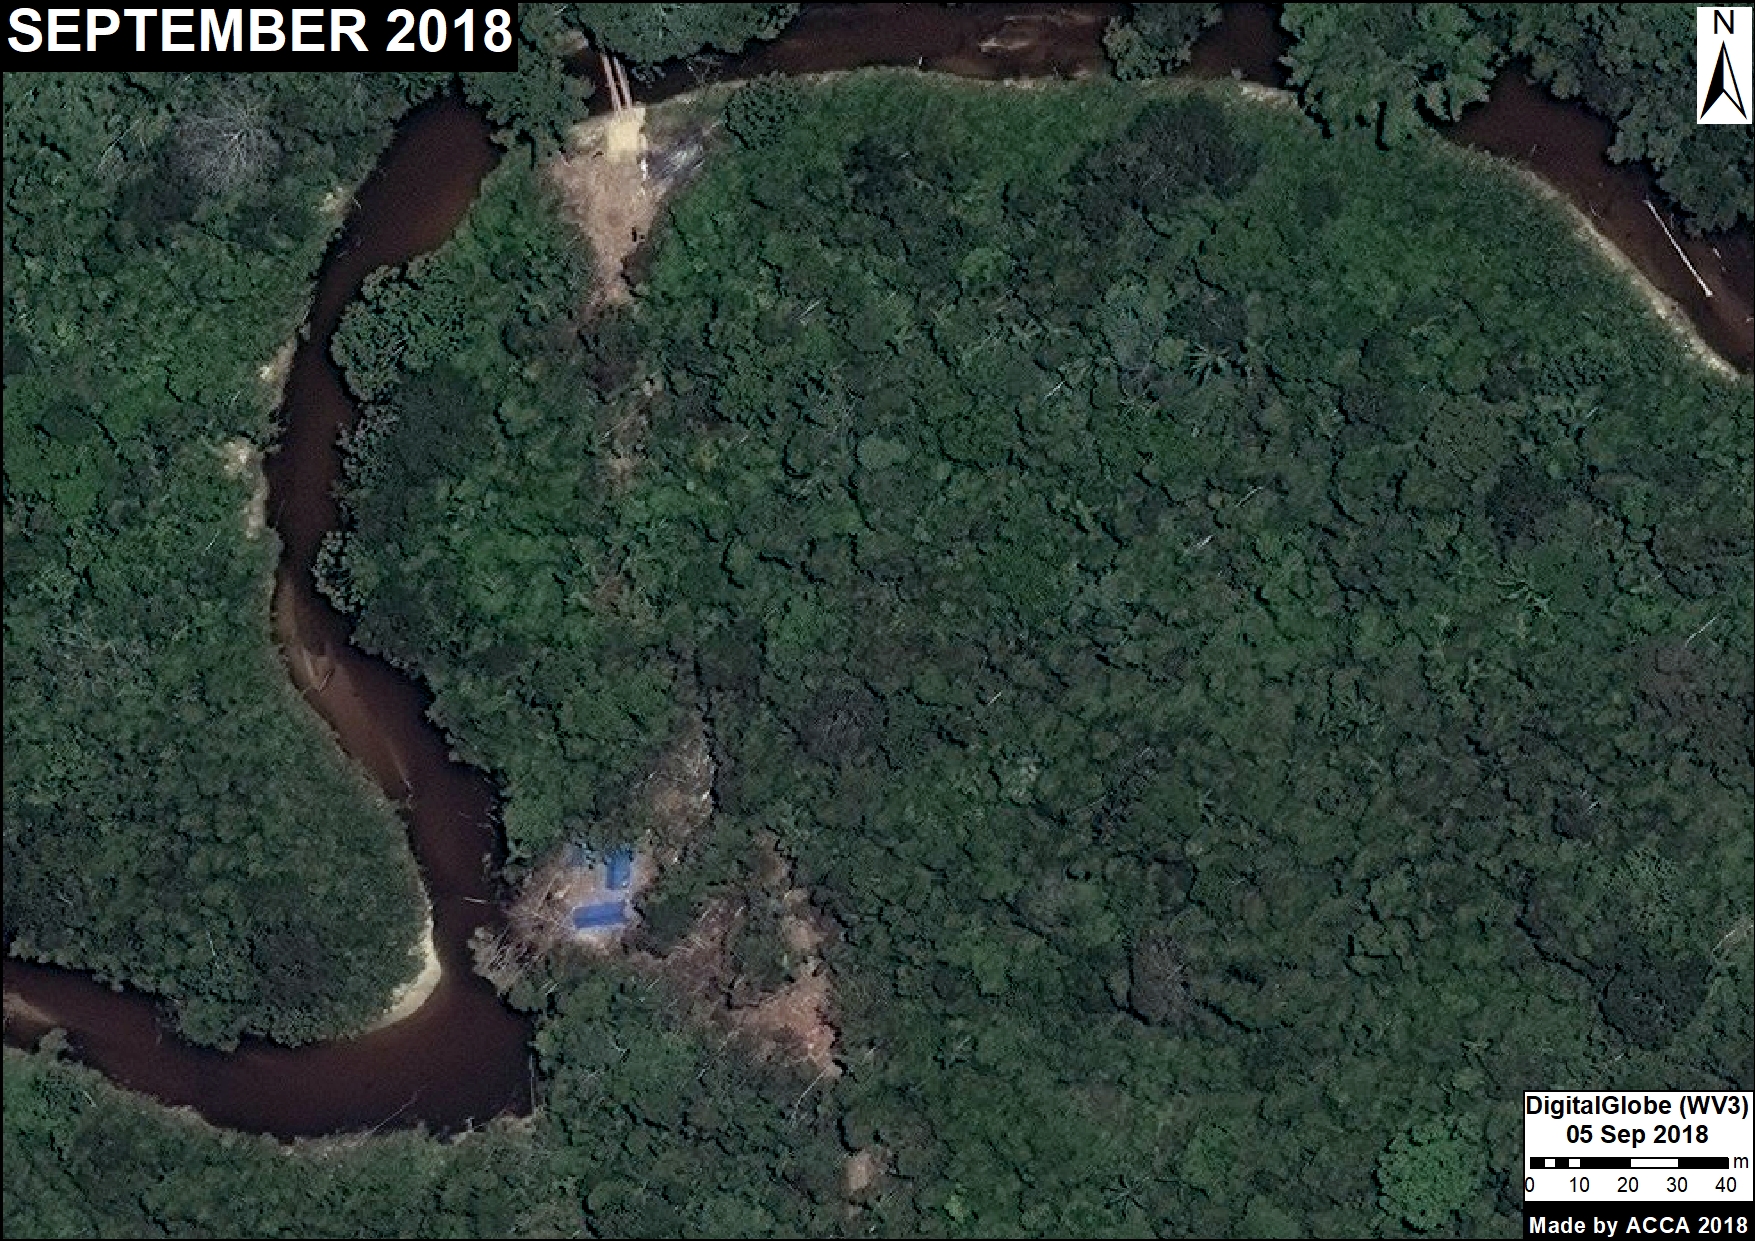
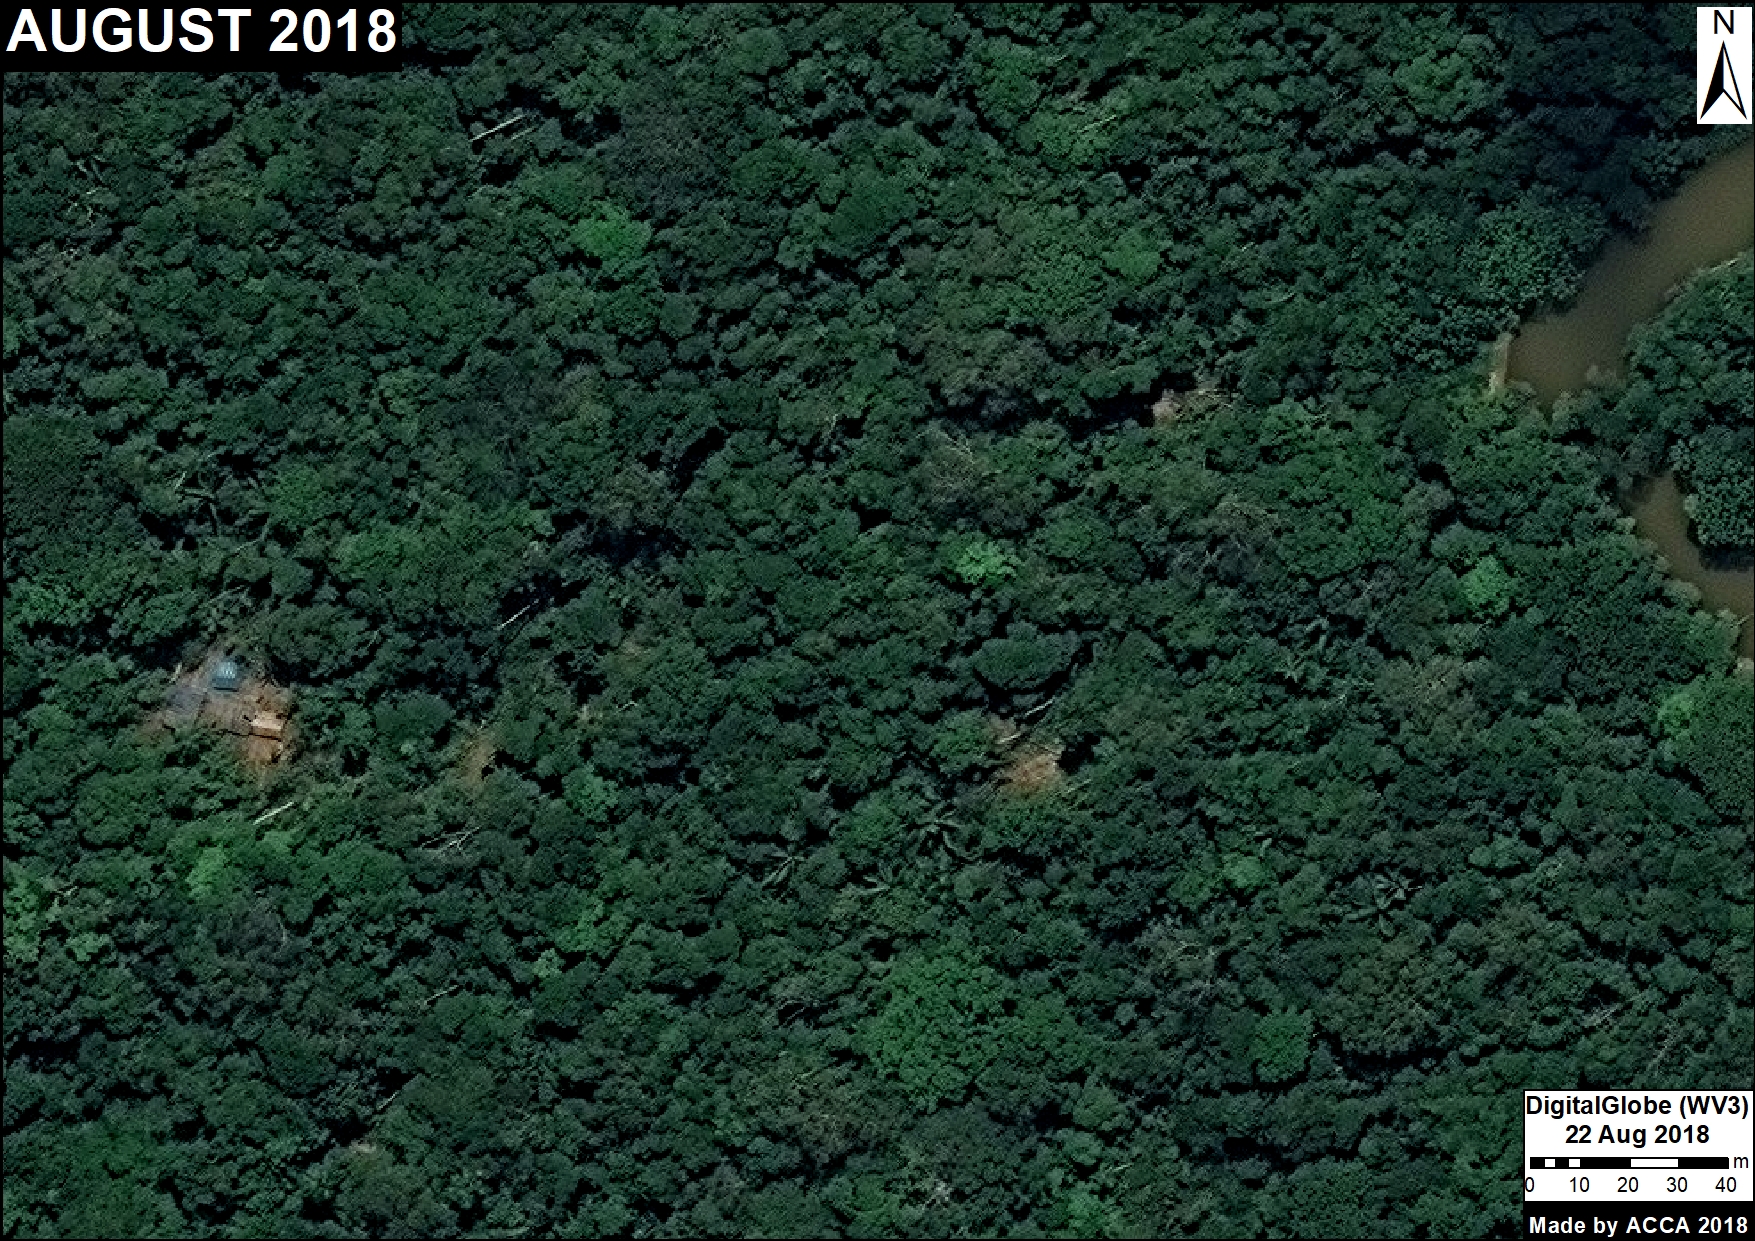
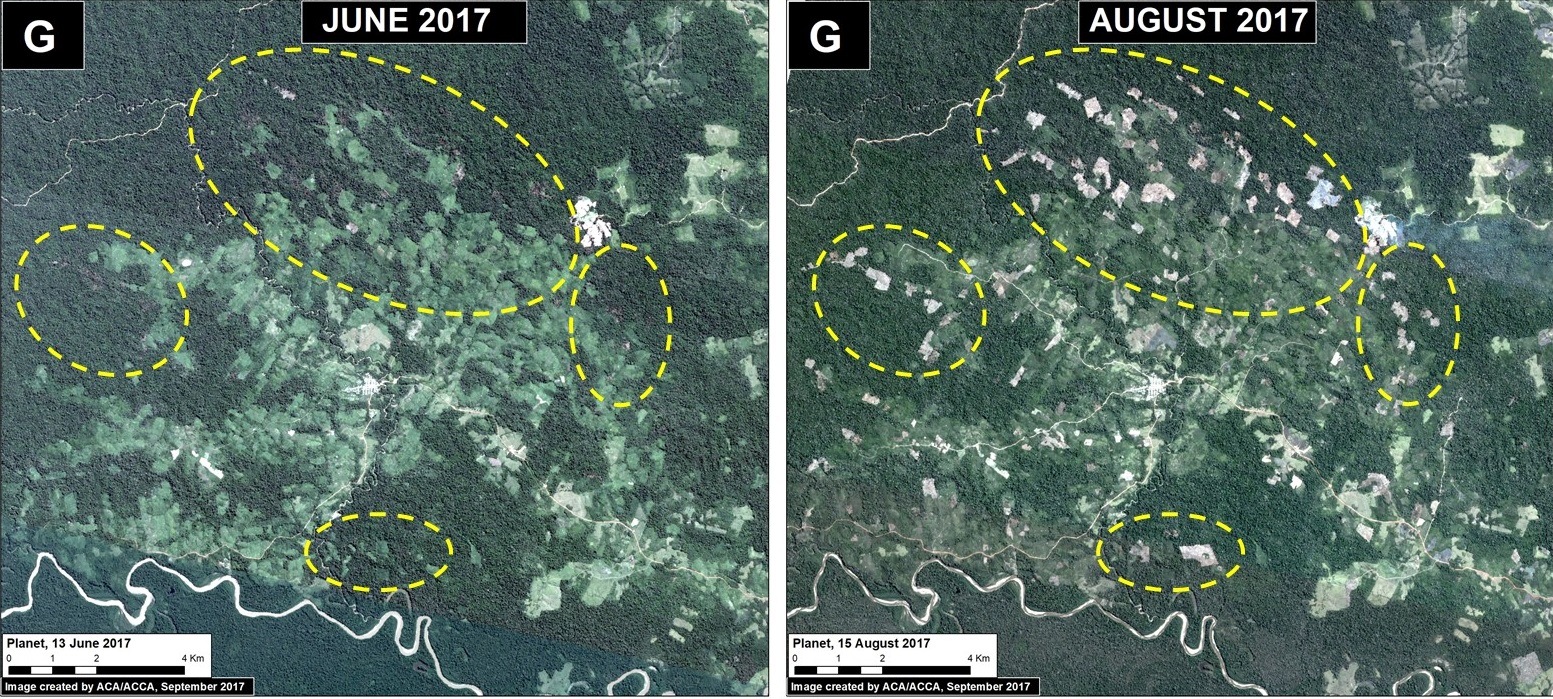
Las Piedras (Inset G)

Finally, deforestation continues within two ecotourism concessions along the Las Piedras River, a remote area famous for its exceptional wildlife (see this video). We documented the deforestation of 300 acres (134 hectares) in 2017 (Image 76g). Since 2013, the total deforestation along the Las Piedras River is 1,495 acres (605 hectares). Note that the Las Piedras Amazon Center Ecotourism Concession represents an effective barrier against deforestation impacting the surrounding concessions. According to local sources, the main causes of deforestation are cacao plantations and cattle pasture.

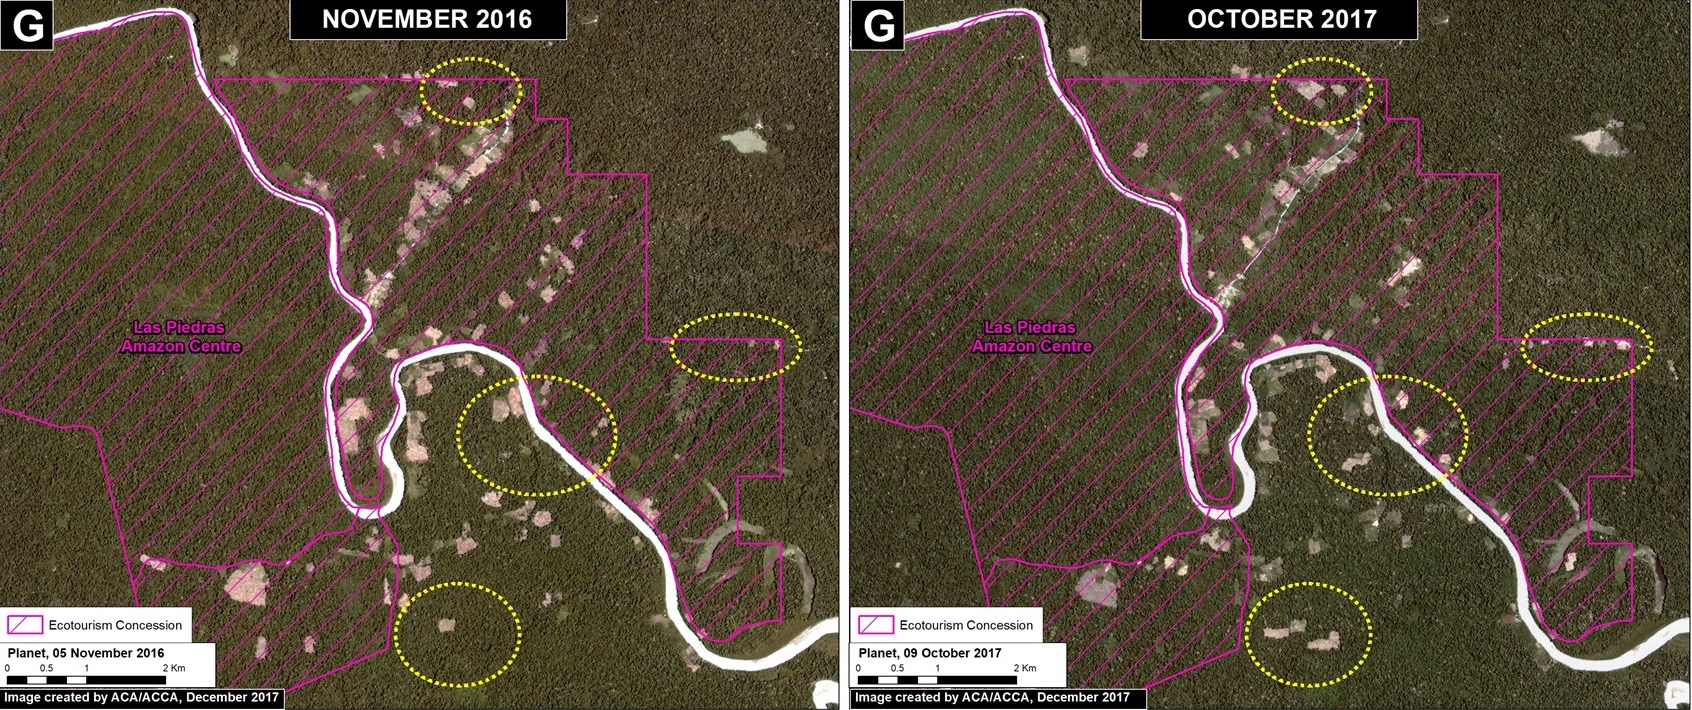
Image 76g. Data: Planet

Coordinates

Zona A: -12.99, -69.90
Zona B: -13.05, -70.17
Zona C: -12.85, -70.26
Zona D: -12.84, -69.99
Zona E: -11.31, -69.61
Zona F: -11.23, -70.05
Zona G: -11.601711, -70.477295

References

Planet Team (2017). Planet Application Program Interface: In Space for Life on Earth. San Francisco, CA. https://api.planet.com

Citation

Finer M, Novoa S, Garcia R (2017) Pope to visit Madre de Dios (Peru), region with Deforestation Crisis. MAAP: 75.

MAAP Interactive: Deforestation Drivers in the Andean Amazon

Since its launch in April 2015, MAAP has published over 70 reports related to deforestation (and natural forest loss) in the Andean Amazon. We have thus far focused on Peru, with several reports in Colombia and Brazil as well.

These reports are meant to be case studies of the most important and urgent deforestation events. We often use forest loss alerts (known as GLAD) to guide us, and satellite imagery (from Planet and DigitalGlobe) to identify the deforestation driver.

Here we present an interactive map highlighting the drivers identified in all published MAAP reports. These drivers include gold mining, agriculture (e.g. oil palm and cacao), cattle pasture, roads, and dams (see icon legend below map). We also include natural causes such as floods and blowdowns (fire included under agriculture since most human caused). Furthermore, we highlight deforestation events within protected areas. Note that you can filter by driver by checking boxes of interest.

We hope the result is one of the most detailed and up-todate resources on patterns and drivers of deforestation in the Andean Amazon. Over the coming year we will continue to focus on Peru and Colombia, and begin to include Ecuador and Bolivia as well.

To view the interactive map, please visit:

MAAP Interactive: Deforestation Drivers in the Andean Amazon
https://www.maapprogram.org/interactive/

For more information on patterns and drivers of deforestation in the Peruvian Amazon, see our latest Synthesis report 

MAAP #69: Alarming Deforestation Patterns in the Central Peruvian Amazon

Image 69. Base Map.

Thanks to early warning forest loss alerts (known as GLAD), we recently detected several alarming new deforestation patterns within remote, primary forest of the central Peruvian Amazon.

They appear to be related to medium or large-scale agricultural activities due to their distinct characteristics: straight access paths extending from secondary roads built deep into primary forest, and deforestation of rectangular/square plots.

These patterns are significant because they are very different than the usual patterns observed with small-scale agriculture in the Peruvian Amazon: scattered plots with no major linear features.

Here, we show satellite images of 3 areas in the central Peruvian Amazon (see Base Map) that have recently experienced these alarming patterns, and deserve urgent attention due to the threat of rapid deforestation of large swaths of primary forest.*


North of Imiria Regional Conservation Area (Ucayali)

Image 69a. Data: Planet

Just north of Imiria Regional Conservation Area (Ucayali region), we documented the construction of a new access road and deforestation of 445 acres (180 hectares) of primary forest between June and September 2017 (Image 69a). In the September image (right panel), the linear features of the access path and agriculture plots are clearly seen. It also appears that there is much potential for continued deforestation into the surrounding primary forest. Sources indicate that this deforestation is linked to a farming association, however it is not yet known for what type of crop. The deforestation is only 2 km away from the Imiría Regional Conservation Area.

Nueva Requena (Ucayali)

Image 69b. Data: Planet

In the remaining primary forests of the Nueva Requena district (Ucayali region), we documented the clearing of three linear paths, totaling 9 km, and the subsequent deforestation of 188 acres (76 hectares) (Image 69b). These paths are located within national forestry lands (known as Permanent Production Forest), indicating that the new deforestation is part of an illegal invasion. It is important to note that this area was recently in the news regarding the killing of six farmers over land rights dispute and is close to controversial large-scale oil palm projects (MAAP #41).

Orellana (Loreto)

Image 69c. Data: Planet

Further north, near the town of Orellana (Loreto region), we documented the rapid clearing of a series of linear paths, totaling 19 km, followed by the deforestation of 255 acres (104 hectares) of primary forest (Image 69c). Note the deforestation in the form of numerous rectangular plots. As in the above examples, there is much potential for continued deforestation into the surrounding primary forest.

Notes

*According to the Supreme Decree (No. 018-2015-MINAGRI) approving the Regulations for Forest Management under the framework of the new 2011 Forestry Act (No. 29763), the official definition of primary forest in Peru is: “Forest with original vegetation characterized by an abundance of mature trees with species of superior or dominant canopy, which has evolved naturally.” Using methods of remote sensing, our interpretation of that definition are areas that from the earliest available image are characterized by dense closed-canopy coverage and experienced no major clearing events.

Reference

Planet Team (2017). Planet Application Program Interface: In Space for Life on Earth. San Francisco, CA. https://api.planet.com

Special Thanks

We would like to express our gratitude to Michael Valqui for his contributions during the preparation of this article.

Citation

Finer M, Novoa S (2017) New Alarming Deforestation Patterns in the Central Peruvian Amazon. MAAP: 69.

MAAP #68: 2017 DEFORESTATION HOTSPOTS IN THE PERUVIAN AMAZON (Part 2)

Image 68. Base map. Data: PNCB/MINAM, UMD/GLAD, SERNANP.

In a previous report, MAAP #65, we presented information about deforestation hotspots in 2017 in the Peruvian Amazon, based on early warning alert data from January until mid-July.

Between July and August, the amount of alerts greatly increased, likely due to arrival of the dry season. Thus, this report includes new updated data until mid-August.*

We find new deforestation hotspots in the regions of Madre de Dios and Ucayali (see base map).** At the national level, we now estimate the forest loss of 111,200 acres (45,000 hectares) thus far in 2017 (thru August 17).***

Below, we present satellite imagery of the following hotspots:

– La Pampa, Madre de Dios (Inset A)
– Guacamayo, Madre de Dios (Inset F)
– Iberia, Madre de Dios (Inset G)
– South of Sierra del Divisor, Ucayali (Inset H)
– Nueva Requena, Ucayali (Inset I)

**The data were generated by the National Program of Forest Conservation for Climate Change Mitigation, Peruvian Ministry of Environment (PNCB/MINAM).

**See Hotspots A-E in MAAP #65

***We emphasize that our calculations are just estimates. Official forest loss data are produced annually by the Peruvian Ministry of Environment.


La Pampa, Madre de Dios (Inset A)

Illegal gold mining deforestation continues to expand in the buffer zone of Tambopata National Reserve in the southern Peruvian Amazon. The Peruvian Government has conducted several interventions this year, most notably in July. However, between July and August we documented the additional loss of 67 acres (27 hectares), increasing the 2017 total deforestation in this zone to 1,280 acres (517 hectares). Image 68a is a GIF illustrating the gold mining deforestation from January to September 2017.

Image 68a. Data: Planet

Guacamayo, Madre de Dios (Inset F)

North of La Pampa, in another gold mining zone, known as Guacamayo, we have documented the rapid deforestation of 182 acres (74 hectares). This newly deforested area is located next to the mining zone (within a forestry concession), and appears to be caused by agricultural activity.

Image 68f. Data: Planet

Iberia, Madre de Dios (Inset G)

Around the  town of Iberia, located along the Interoceanica highway near the border with Brazil, has recently become a major deforestation hotspot (see MAAP #28 and MAAP #47). Between June and August 2017, we detected the deforestation of 1,075 acres (435 hectares). Much of this deforestation is within forestry concessions, indicating that the concessions have been invaded. The deforestation appears  to be caused by agriculture (according to local sources, the clearing is for corn plantations).

Image 68g. Data: Planet.

South of Sierra del Divisor, Ucayali (Inset H)

In the central Peruvian Amazon, just south of Sierra del Divisor National Park, we detected the new construction of 25 km of logging roads in the forestry concessions surrounding the park. We also detected the deforestation of 138 acres (56 hectares), close to the National Park’s limit for what appears to be agricultural activity.

Image 68h. Data: Planet, SERNANP

Nueva Requena, Ucayali (Inset I)

Also in the central Peruvian Amazon, in the Nueva Requena district near two controversial oil palm plantations (MAAP #41), we detected the deforestation of 1,130 acres (457 hectares) in state forestry lands (known as Permanent Production Forest). This includes 26 km of new logging and agricultural roads. It is important to note that this area was recently in the news regarding the killing of six farmers over land rights dispute.

Image 68i. Data: Planet

References

Planet Team (2017). Planet Application Program Interface: In Space for Life on Earth. San Francisco, CA. https://api.planet.com.

Citation

Finer M, Novoa S, Olexy T (2017) 2017 Deforestation Hotspots in the Peruvian Amazon (Part 2). MAAP: 68.

MAAP 59: Power of “Small Satellites” from Planet

Image 59a. Source: Planet

The company Planet is pioneering the use of high-resolution “small satellites” (Image 59a). They are a fraction of the size and cost of traditional satellites, making it possible to produce and launch many as a large fleet. Indeed, Planet now operates 149 small satellites, known as Doves, the largest fleet in history. The Doves capture color imagery at 3-5 meter resolution, and will line up (like a string of pearls) to cover everywhere on Earth’s land area every day.

Over the past year, MAAP* has demonstrated the power of Planet imagery to monitor deforestation and degradation in near real-time in the Amazon. A consistent flow of new, high-resolution imagery is needed for this type of work, making Planet’s fleet model ideal. Below, we provide a recap of key MAAP findings based on Planet imagery, for a diverse set of cases including gold mining, agriculture deforestation, logging roads, wildfire, blowdowns, landslides, and floods.**

*MAAP has been fortunate to have access to Planet imagery via the Ambassador program.
**Note: In the images below, the red dot () indicates the same location across time between panels.

Illegal Gold Mining

Image 59b. Data: Planet, SERNANP

We used Planet imagery to closely track the recent illegal gold mining invasion of Tambopata National Reserve, a mega-diverse protected area in the southern Peruvian Amazon. Image 59b is a GIF showing the full invasion: from the initial invasion in January 2016, to subsequent deforestation advances in July and November 2016, and the most recent image in March 2017. The total deforestation from the invasion is over 1,235 acres. These images were an important resource for authorities, civil society, and the media responding to the situation.

Illegal Agriculture Deforestation

Image 59c. Data: Planet, SERNANP

We used Planet imagery to document numerous cases of small-scale deforestation for illegal agricultural practices. These examples are important because, cumulatively, small-scale deforestation represents the vast majority (80%) of forest loss events in the Peruvian Amazon (see MAAP Synthesis #2). Image 59c shows the rapid appearance of several new agricultural plots between May (left panel) and June (right panel) 2016 within an important natural protected area in the central Peruvian Amazon, El Sira Communal Reserve.

Logging Roads

Image 59d. Data: Planet

We used Planet imagery to show the rapid construction of logging roads. For example, Image 59d shows the construction of a logging road in the buffer zone of an important national park in the central Peruvian Amazon (Cordillera Azul) between November 2015 (left panel) and July 2016 (right panel).

Wildfire

Image 59e. Data: Planet

Planet imagery was also an important resource to monitor the intense wildfires in Peru last year. Image 59e shows forest loss from an escaped agricultural fire in the northern Peruvian Amazon between May (left panel) and October (right panel) 2016. Note the imagery even caught the smoke from the fires in September (middle panel).

Blowdowns

Image 59f. Data: Planet

We used Planet to help document a little-known, but important, type of natural forest loss in the Peruvian Amazon: blowdown due to strong winds from localized storms known as “hurricane winds.” Image 59f shows a high-resolution view of a recent major blowdown event between January (left panel) and August (right panel) 2016 in the northern Peruvian Amazon.

Landslides

Image 59g. Data: Planet

Planet imagery recently revealed an interesting natural phenomenon: a major landslide within a remote, rugged section of Peru’s newest national park, Sierra del Divisor. Image 59g shows the area between October 2016 (left panel) and March 2017 (right panel).

Floods

Image 59h. Data: Planet

Finally, Planet imagery played a key role in monitoring the impacts of the recent deadly floods that hit the northern Peruvian coast. Image 59h shows the rapid flooding of agricultural plots along a river in northern Peru between February (left panel) and March (right panel) 2017.

References

Planet Team (2017). Planet Application Program Interface: In Space for Life on Earth. San Francisco, CA. https://api.planet.com

Citation

Finer M, Novoa S, Mascaro J (2017) Power of “Small Satellites” from Planet. MAAP: 59.