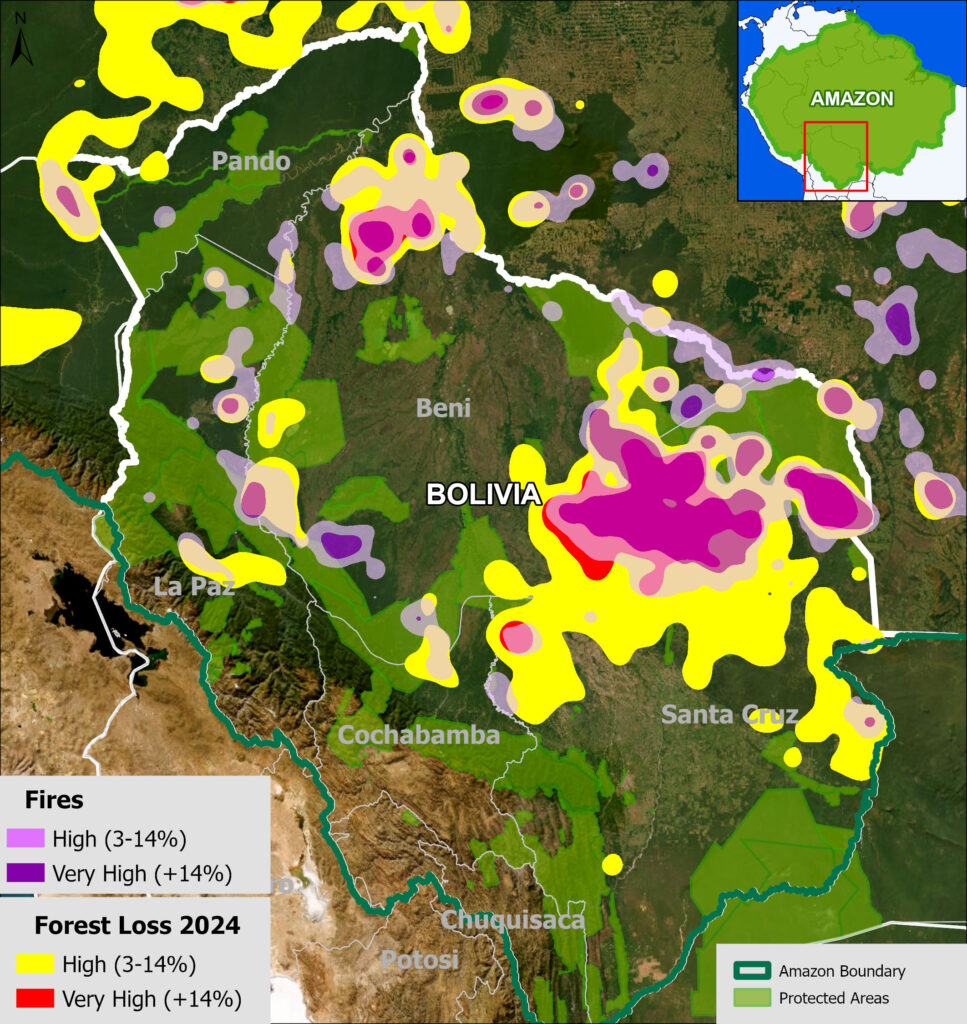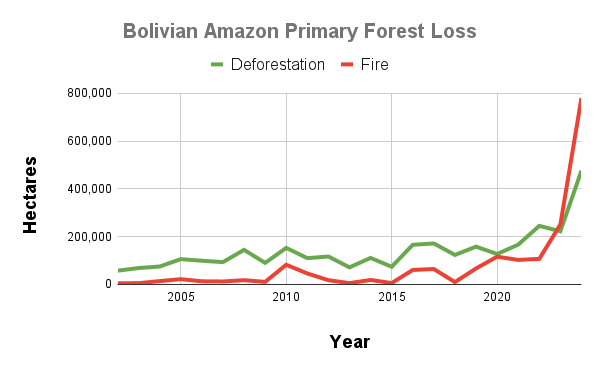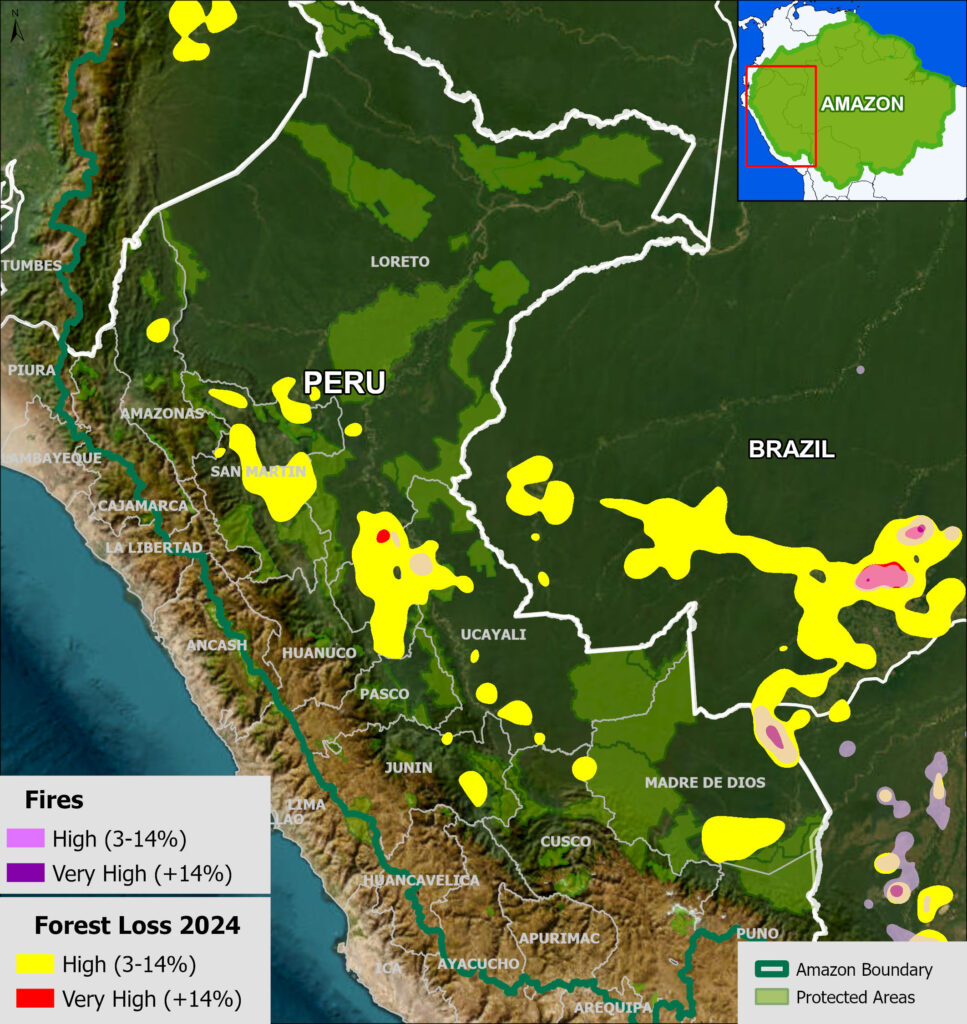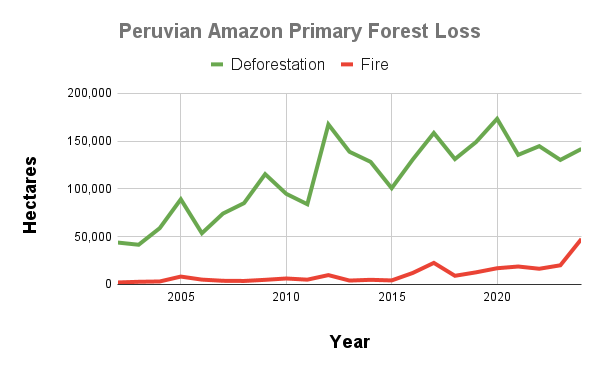
It is often reported that the largest rainforest in the world, the Amazon, is rapidly approaching a tipping point.
Generally defined, this tipping point is where parts of the rainforest will convert into drier ecosystems due to disrupted precipitation patterns caused by increasing deforestation.
The Amazon uniquely generates much of its own rainfall by recycling water from its source in the east (Atlantic Ocean) all the way west to the Andes Mountains and beyond, in a phenomenon known as flying rivers (see MAAP #232 and the follow-up white paper). Thus, high deforestation in the eastern Amazon may lead to downwind impacts (reduced precipitation) in the western Amazon. Importantly, these flying rivers follow different pathways during the wet season (northern route) vs. the dry season (southern route), implying that the tipping point is not a uniform event across the Amazon biome, as some areas are more vulnerable to atmospheric moisture (flying rivers) disruptions than others.
The scientific literature indicates this tipping point could be triggered at around 25% Amazon forest loss, in conjunction with climate change impacts (see References).
In a previous report published in 2022 (MAAP #164), we reconstructed the likely extent of the original Amazon biome forest prior to European colonization, and then estimated accumulated total Amazon forest loss (through 2021). Based on this analysis, we estimated that 13.2% of the original Amazon biome primary forests were lost to deforestation and fires.
Here, for our 250th report, we update this estimate by incorporating forest loss data through 2025. From 2022 to 2025 we found an additional forest loss of 13 million hectares, including the record-breaking year of 2024 for fires. Our updated estimate is that 15% of the original Amazon biome primary forest has been lost, mostly due to deforestation and fires (Figure 1).
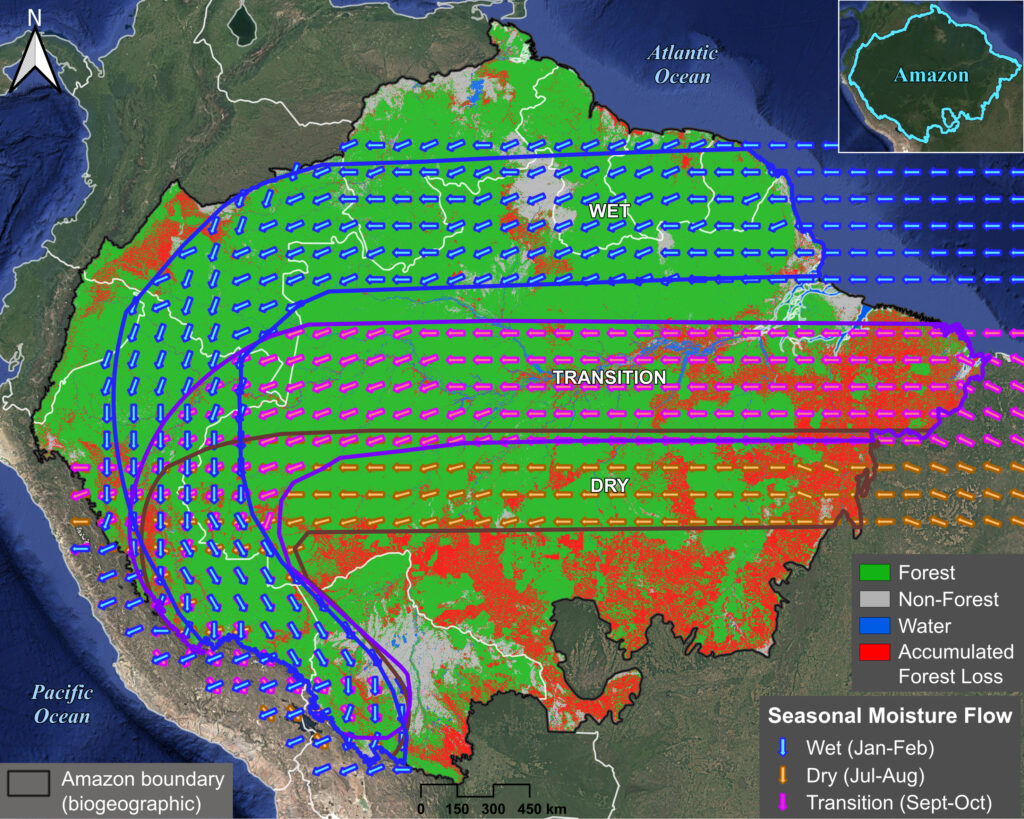
In addition, breaking the results by seasonal moisture flow routes (see Figure 3 below), we find that moisture flows during the dry and transition seasons are most affected and disrupted (9.1% and 8.6% forest loss, respectively). This finding is critical because during the critical dry and transition seasons, the role of forest-driven moisture recycling is especially important to maintain rainforests in the southwest Amazon. In contrast, we find that the wet season moisture flow is more intact, with just 3.2% total forest loss.
Original Amazon Forest
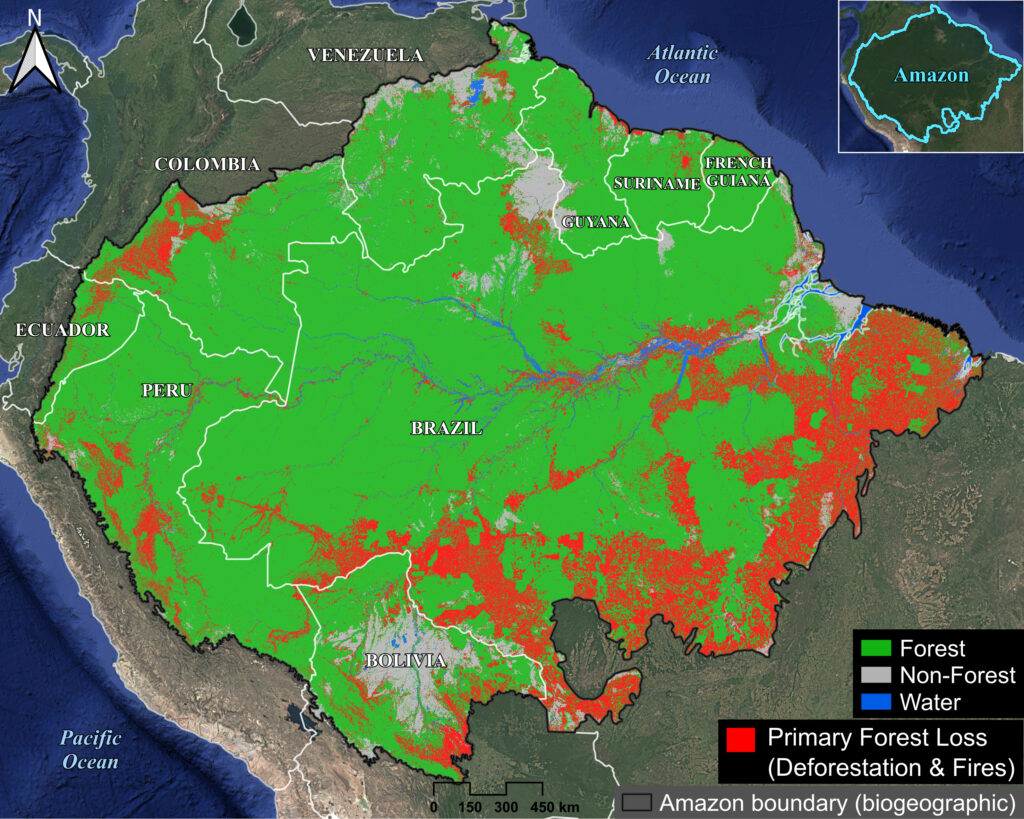
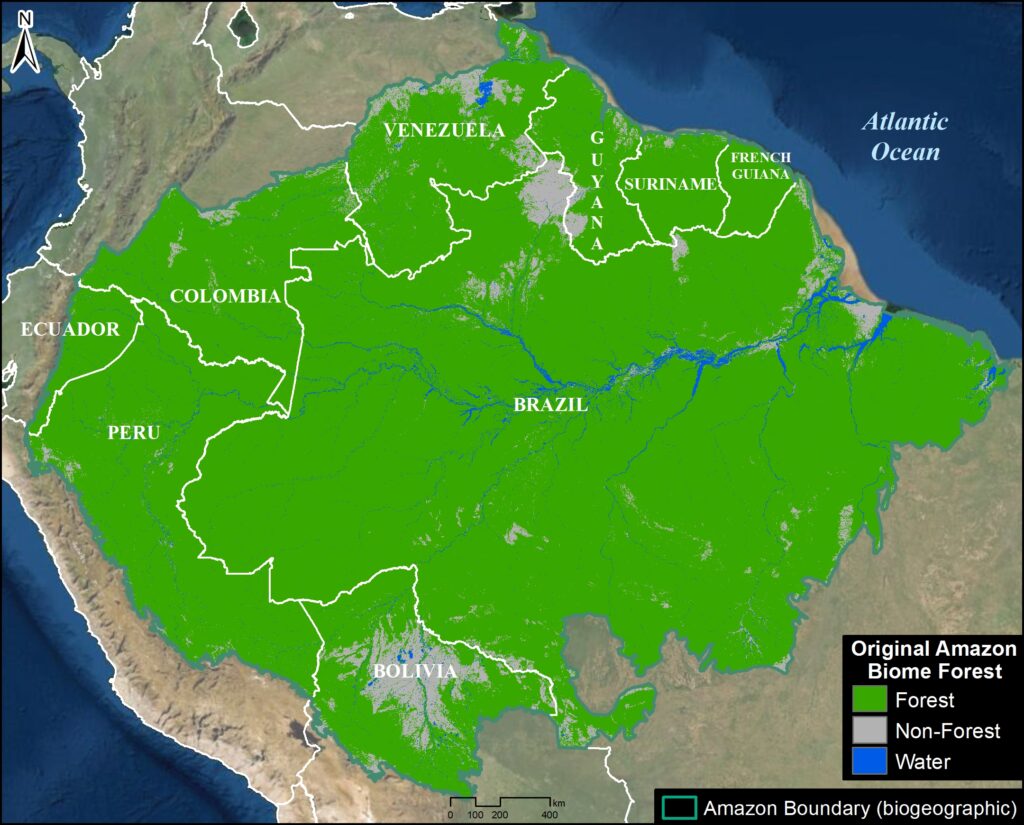
As first presented in MAAP #164, we merged several datasets to estimate the extent of the original Amazon forest (Figure 2). We define this original forest as the extent of the Amazon forest before European colonization (and thus may include changes from pre-European indigenous populations). Note that we use a broader biogeographical definition of the Amazon that covers nine countries (Amazon biome) rather than the strict Amazon watershed (see Methodology).
The map has just three classes: Original Amazon forest, Original non-forest (such as natural savannah), and Water.
We found that the original Amazon primary forest covered 647.6 million hectares (equivalent to 1.6 billion acres).
Of this total, 61.4% occurred within the current border of Brazil, followed by Peru (12%), Colombia (7%), Venezuela (6%), and Bolivia (5%). The remaining four countries (Ecuador, Guyana, Suriname, and French Guiana) make up the final 8%.
Amazon Forest Loss
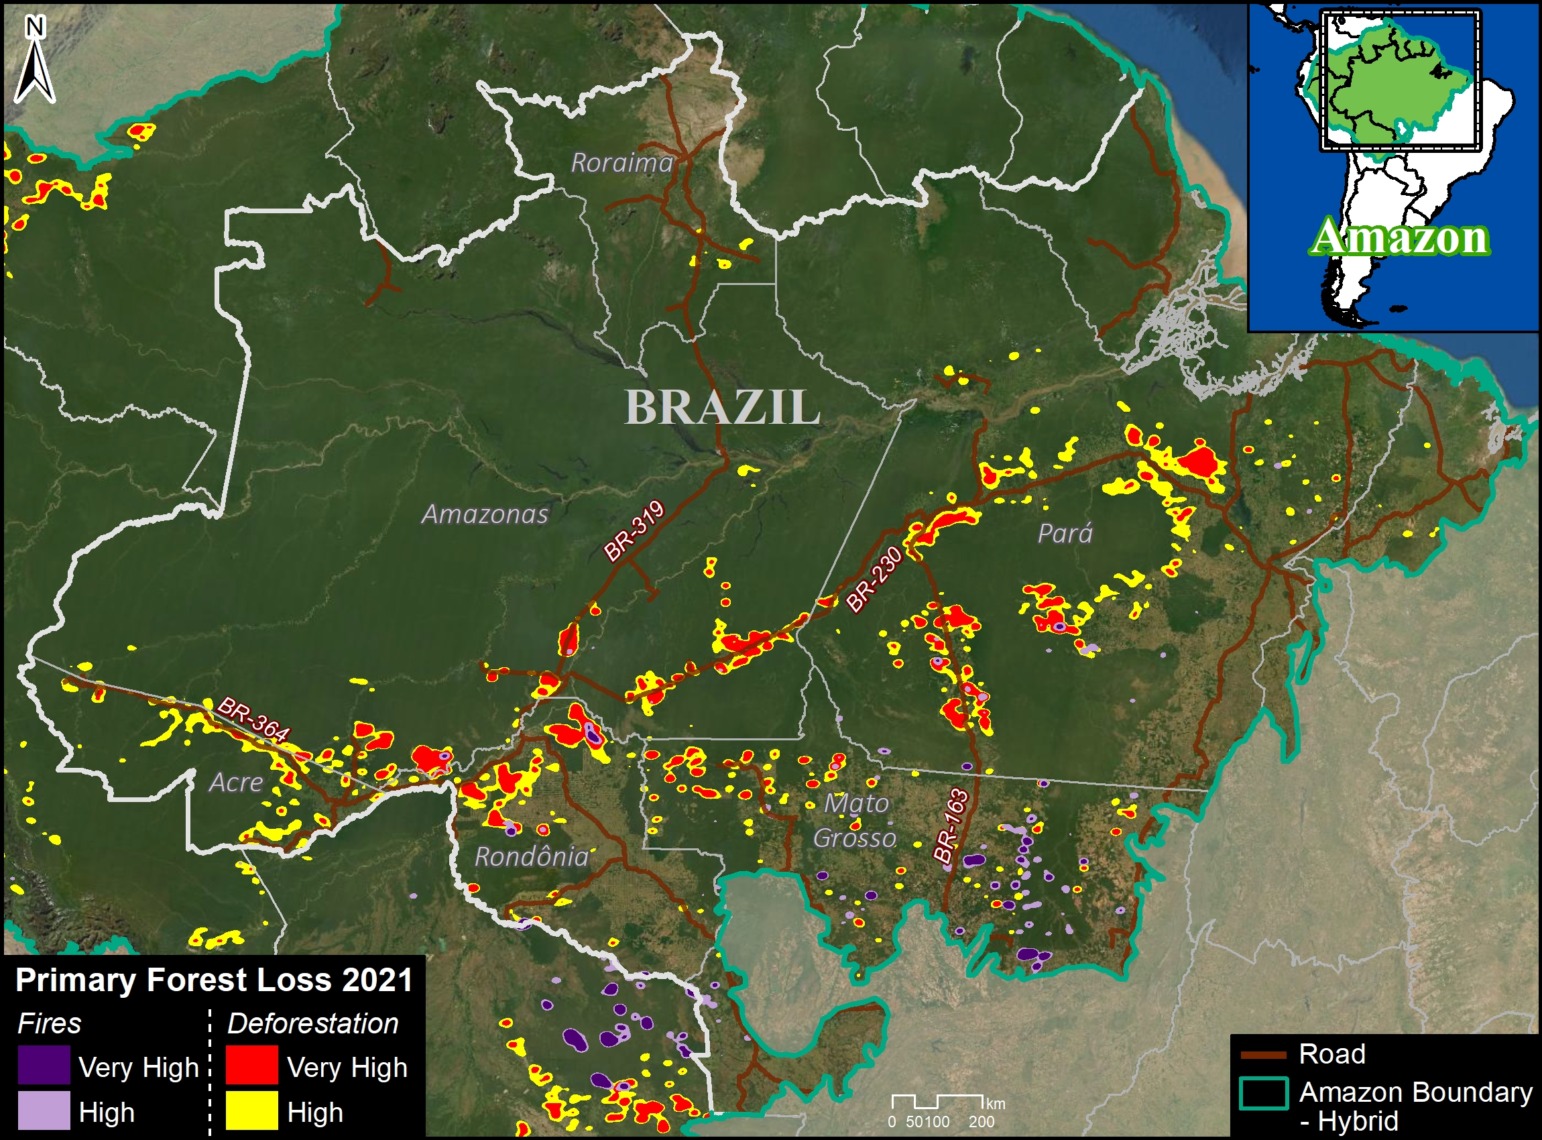
In MAAP #164, we reported the historical accumulated Amazon primary forest loss, as of the end of 2021. We documented the total loss of 85.5 million hectares, or 13.2% of the original Amazon.
For this report, we updated the data as of the end of 2025. This data is broken down into three time periods:
By 2000, we estimate that the original Amazon forest had lost 36 million hectares (MAAP #164).
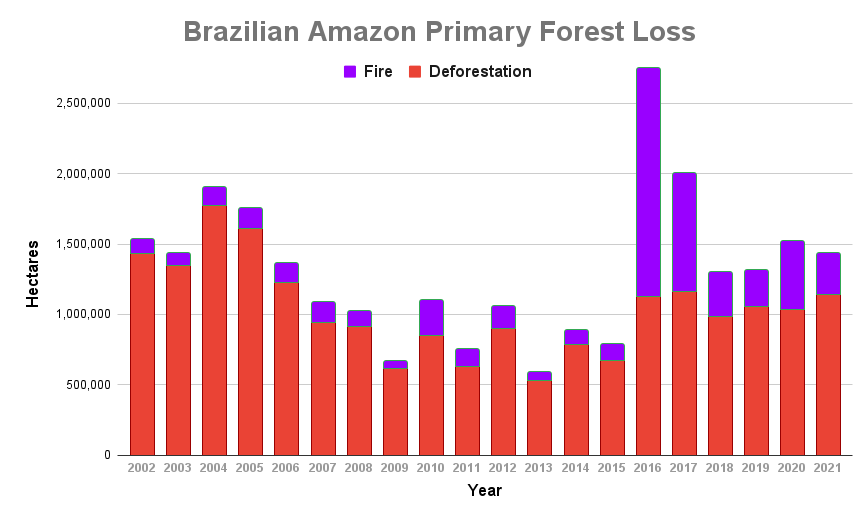
The 2001-2021 estimate of primary forest cover loss was reduced from 49.5 million to 48 million hectares due to adjustments in the forest loss methodology used by the University of Maryland (UMD). It is important to highlight that this finding includes forest loss from both fire (7.3M ha) and non-fire (40.7M ha) causes, and does not include forest gain/regeneration.
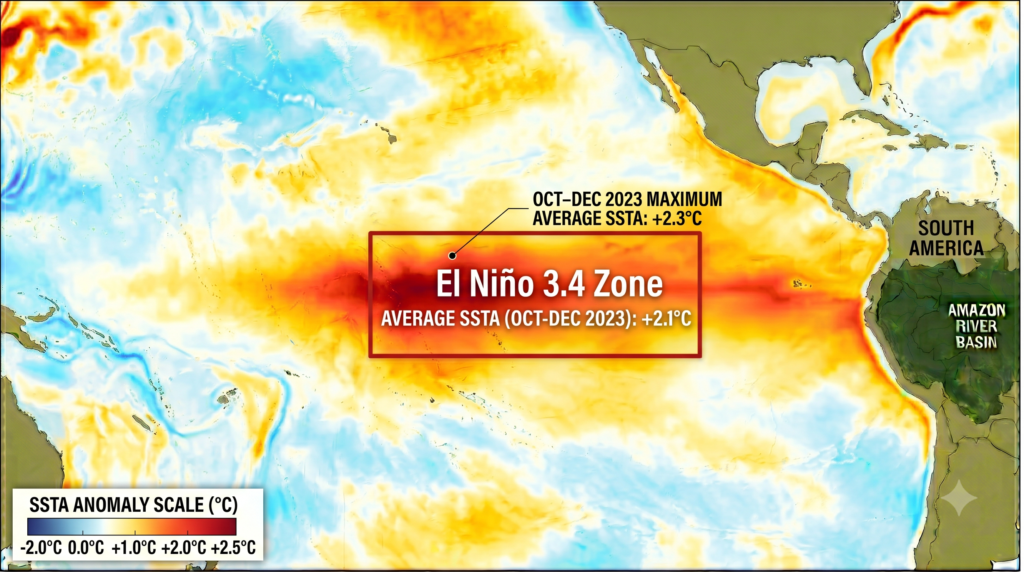
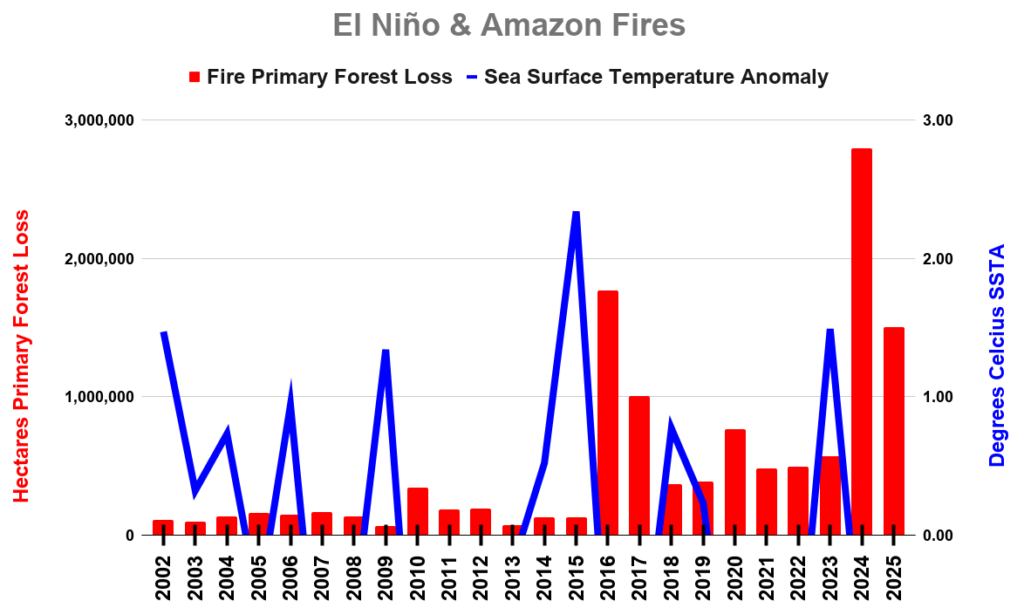
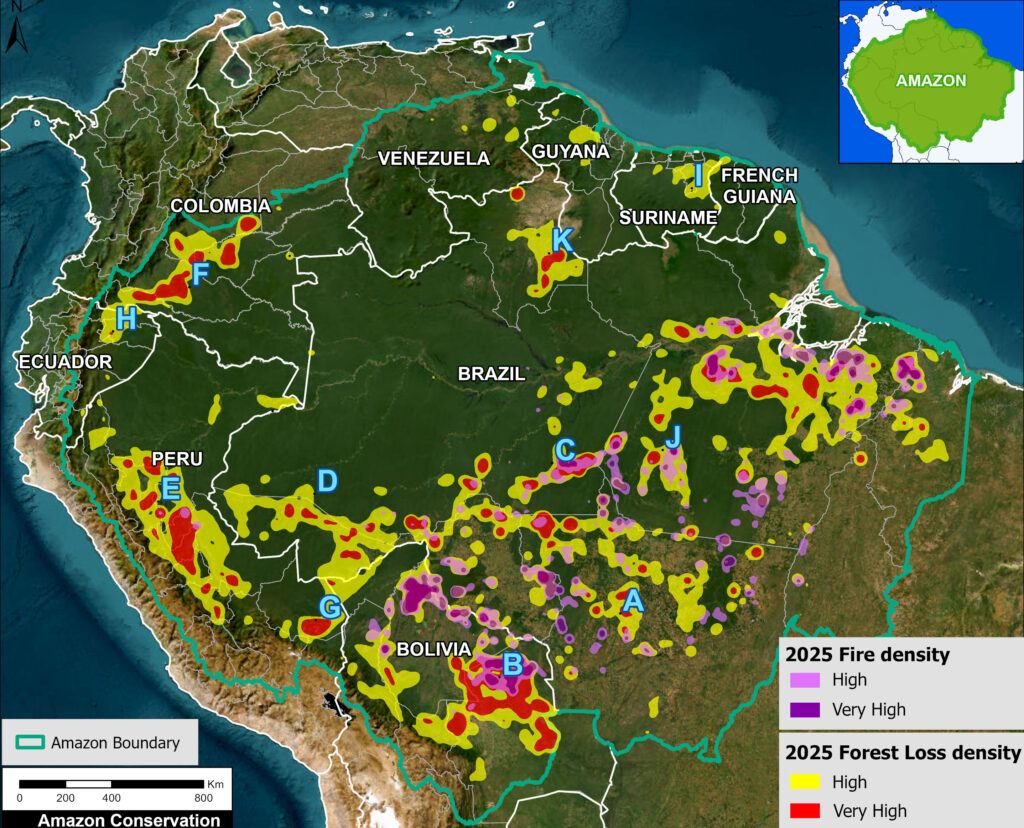
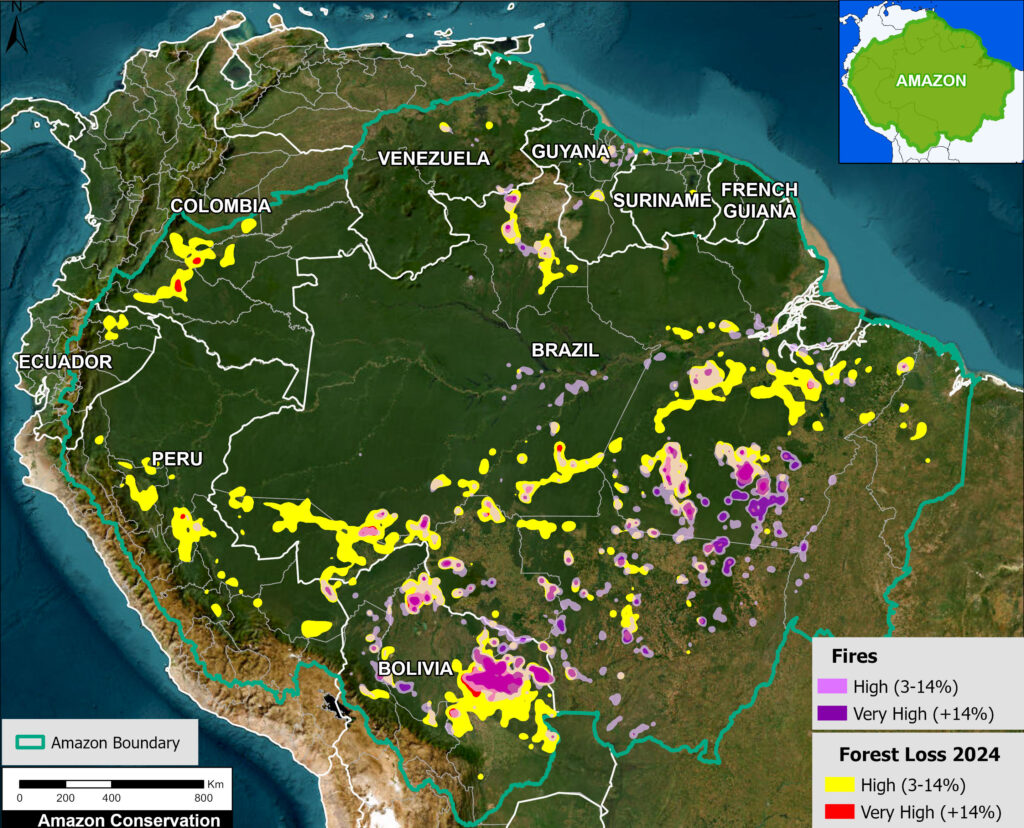
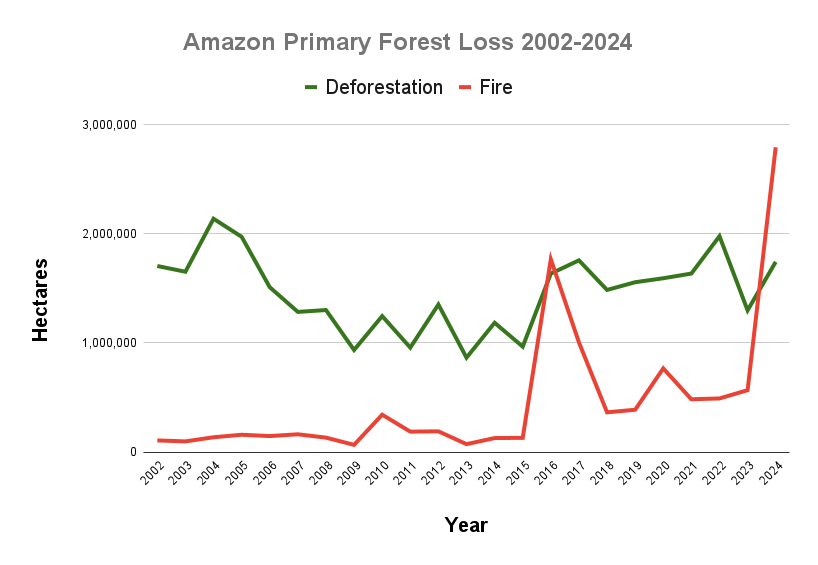
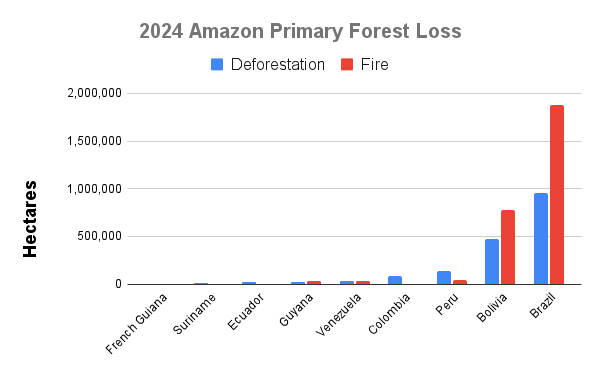
A novel 2022-2025 estimate was generated based on the most recent UMD data, adding 13.04 million hectares, including the record-breaking year of 2024 that was mainly driven by forest fires following the strong El Niño event of 2023 (see MAAP #229 and #248). Similarly, this includes forest loss from both fire (5.43M ha) and non-fire (7.61M ha) causes. This total loss over just four years is the equivalent size of the US state of Louisiana.
Combining these three periods gives an updated total of 97.06 million hectares lost (equivalent to 240 million acres). This includes forest loss from both fire (12.78 M ha) and deforestation (84.28 M ha) causes.
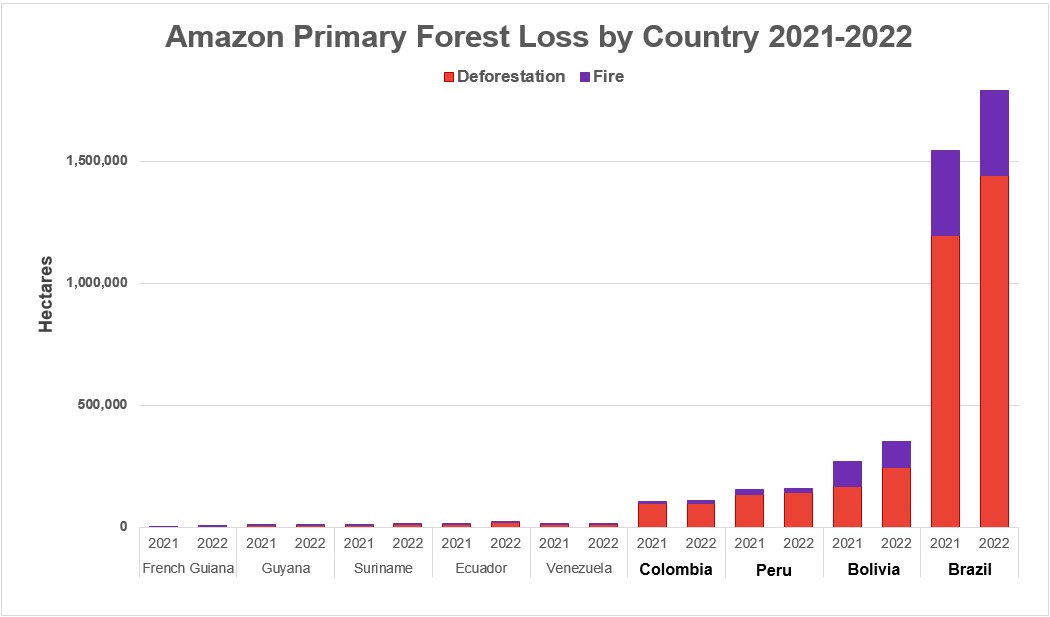
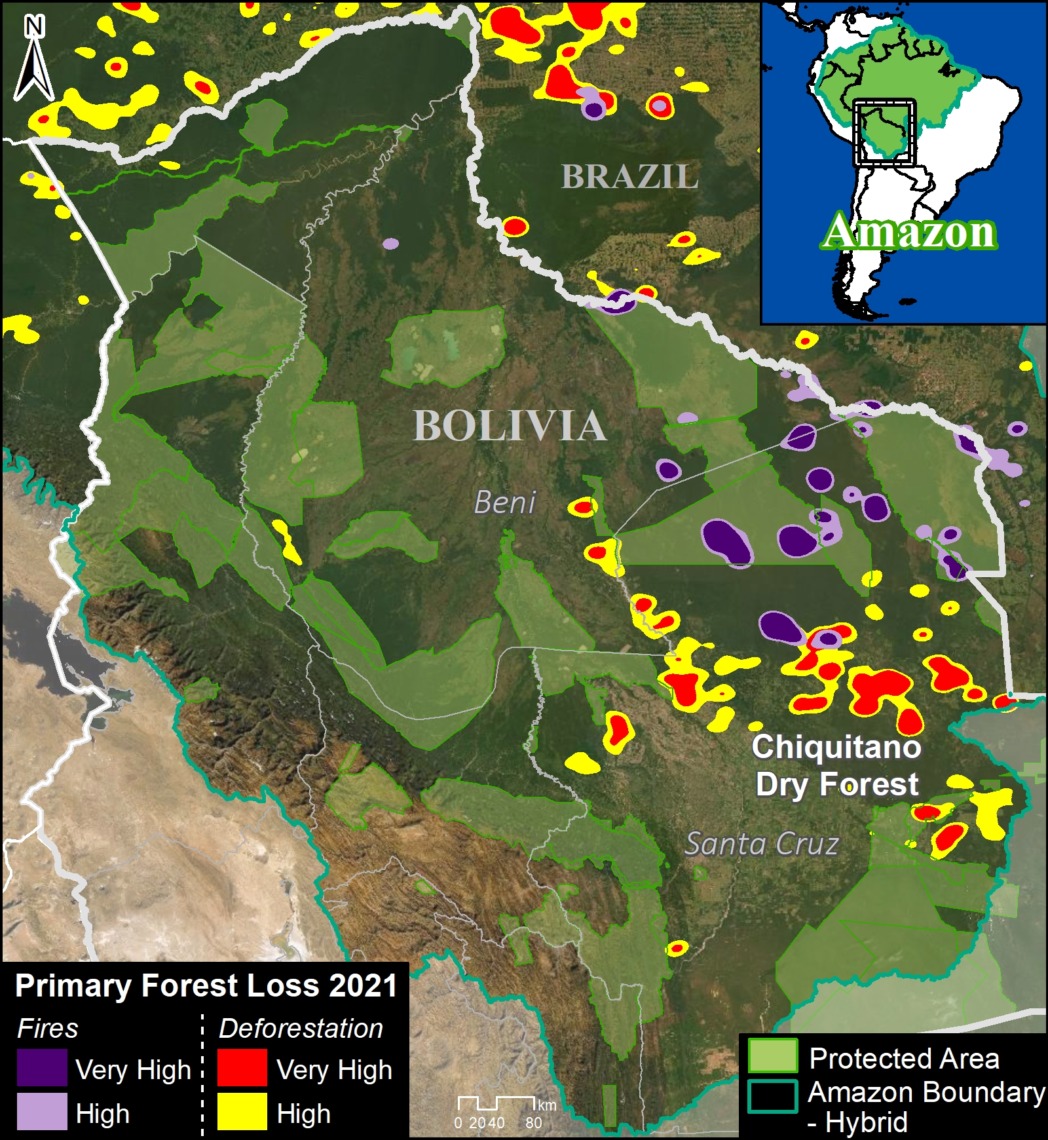
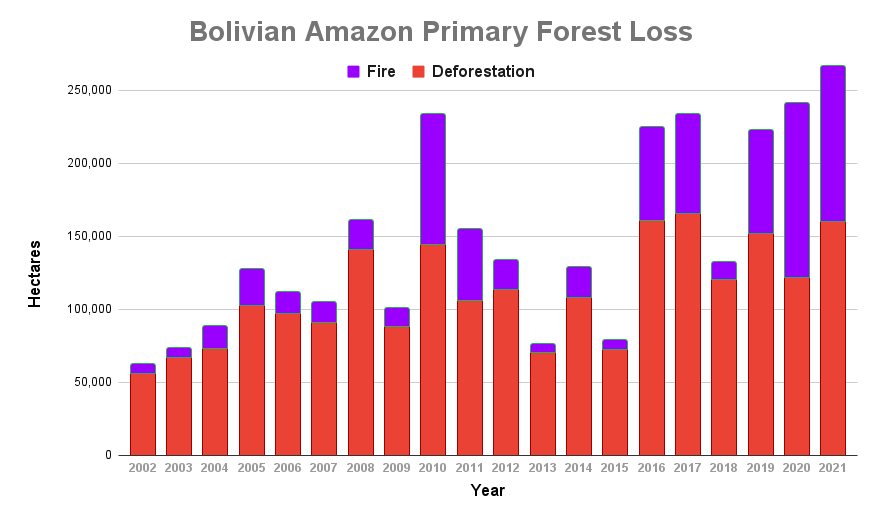
The largest loss occurred in Brazil (79.4%), followed by Bolivia (6.2%), Peru (5.8%), Colombia (4.5%), Venezuela (1.7%), Guyana (0.8%), Ecuador (0.7%), Suriname (0.6%), and French Guiana (0.2%).
Taking this updated forest loss total of 97.06 million hectares in relation to the original 647.6 million hectares gives our key finding of 15% of the original Amazon forest lost, mostly due to deforestation and fire (Figure 1). This estimate also includes natural causes such as landslides and windstorms.
Figure 3 further illustrates the results broken down by seasonal moisture flow routes (as presented in MAAP #232). We found the transition season moisture flow is most threatened and impacted (9.1% total forest loss), followed by the dry season moisture flow (8.6%).
This finding is important because during the critical dry and transition seasons, the role of flying rivers to carry moisture to water-stressed forest in the southwest Amazon is especially important. In other words, extensive deforestation in the eastern and central parts of these pathways could negatively impact the downwind western part, which means that the tipping point event is not a single and homogenous one across the Amazon biome and there will be geographical areas that will be impacted sooner and harder.
In contrast, we find that the wet season moisture flow is more intact, with just 3.2% total forest loss.
Methodology
At the core of this work, we generated two major estimates: original Amazon forest and total historical Amazon forest loss.
For both of these estimates, we used the biogeographical boundary of the Amazon (as determined by RAISG 2020), which encompasses nine countries. Thus, we used a broader definition of the Amazon (Amazon biome) rather than the strict Amazon watershed, which omits part of the northeastern Amazon biome.
As presented in MAAP #164, for original Amazon forest, we defined three major classes: Forest, Non-Forest, and Water. This analysis was based on data from MapBiomas Brazil (collection 2 from 1990) with some additional modifications. As noted above, we define this original forest as the extent of the Amazon forest before European colonization (and thus may include changes from pre-European indigenous populations).
Original Forest was made up of these MapBiomas categories: Forest Formation, Mangrove, Flooded Forest, Mosaic of Agriculture and Pasture. Non-Forest was made up of these MapBiomas categories: Savanna Formation, Natural Non-Forest Flood Formation, Grassland, and Other non-Forest Formations. Water was made up of these MapBiomas categories: River, Lake, Ocean and Glacier.
We then made a number of modifications with manual edits based on data from the University of Maryland, INPE (Terrabrasilis), ArcGis satellite images, Planet mosaics, Google Earth Engine Landsat images from 1984-1990, and official government data for several countries (Ministry of the Environment of Ecuador (MAE) and Peru (GeoBosques/MINAM), Forest and Carbon Monitoring System/IDEAM of Colombia, National Institute for Space Research of Brazil (INPE/Terrabrasilis), General Directorate of Forest Management and Development of Bolivia (DGGDF), and the National Service of Protected Areas of Bolivia (SERNAP). As an example of a major modification, deforested areas and historic dam reservoirs were changed to Original Forest based on an analysis of the oldest available satellite image for the area (1984-1990). We also corrected some misclassifications, such as forest patches in clearly non-forest areas were changed to Non-Forest (and vice versa) and mountain forest areas found as water were changed to Forest. Also, agriculture and urban areas in likely savannah areas were changed to Non-Forest. Additional Water data from MapBiomas based on 1985 was incorporated. Overall, our focus was defining Original Forest as best as possible; data confusions between Non-Forest and Water categories were not worked on as thoroughly.
For original Amazon forest,For total historical Amazon forest loss, we used data from the University of Maryland. Specifically, we first used their data layer ‘Tree Cover 2000″ (>30% canopy density) to estimate historical (pre-2000) forest loss.
We then used the Global Forest Change (GFC) and Global forest loss due to fire datasets developed by the University of Maryland (UMD) for the period 2001–2025. We then derived annual forest loss from the loss year layer of GFC. Subsequently, we separated fire-related from non-fire-related forest loss using the annual Global forest loss due to fire dataset. Areas classified with medium to high certainty of fire attribution (codes 3 and 4) were considered fire-related forest loss, whereas codes 1 and 2 were used to identify non-fire-related forest loss, representing areas of forest loss attributed to other drivers. This classification was applied to minimize potential overestimation of fire-related forest loss. All data processing and analyses were conducted using Google Colaboratory.
It is important to note that for the more modern post-2000 era (2001-25), data is available for forest loss due to both fire and non-fire causes. This data represents our best estimate or proxy for primary forest loss. Non-fire loss can be considered more permanent, such as deforestation, while fire loss may be considered more as degradation. The results above combine both types of data to be consistent with the original results presented in MAAP #164.
It is also important to note that our estimates do not include forest gain/regeneration.
Finally, we estimate the amount of primary forest loss in the major seasonal moisture flow pathways (wet, dry, and transition seasons), as presented in MAAP #232.
References
Sampaio, G., Nobre, C., Costa, M. H., Satyamurty, P., Soares‐Filho, B. S., & Cardoso, M. (2007). Regional climate change over eastern Amazonia caused by pasture and soybean cropland expansion. Geophysical Research Letters, 34(17).
Hansen, M. C. et. al. (2013) High-Resolution Global Maps of 21st-Century Forest Cover Change. Science 342.
Nobre et al. (2016) Land-use and climate change risks in the Amazon and the need of a novel sustainable development paradigm. PNAS, 113 (39).
Turubanova S., Potapov P., Tyukavina, A., and Hansen M. (2018) Ongoing primary forest loss in Brazil, Democratic Republic of the Congo, and Indonesia. Environmental Research Letters.
Lovejoy, T. E., & Nobre, C. (2018). Amazon Tipping Point. Science Advances, 4(2).
Lovejoy, T. E., & Nobre, C. (2019). Amazon tipping point: Last chance for action. Science Advances, 5 (12).
Bullock et. al. (2019) Satellite-based estimates reveal widespread forest degradation in the Amazon. Glob Change Biol., 26.
Amigo, I. (2020) The Amazon’s fragile future. Nature, 578.
Killeen (2021) A Perfect Storm in the Amazon Wilderness
Berenguer E. et. al. (2021) Ch 19. Drivers and ecological impacts of deforestation and forest degradation. In: Nobre C, Encalada et al. (Eds). Amazon Assessment Report 2021. United Nations Sustainable Development Solutions Network, New York, USA. Available from https://www.theamazonwewant.org/spa-reports
Hirota M et. al (2021) Science Panel for the Amazon, Ch 24. Resilience of the Amazon Forest to Global Changes: Assessing the Risk of Tipping Points. In: Nobre C, Encalada et al. (Eds). Amazon Assessment Report 2021. United Nations Sustainable Development Solutions Network, New York, USA. Available from https://www.theamazonwewant.org/spa-reports/
Wunderling et al (2022) Recurrent droughts increase risk of cascading tipping events by outpacing adaptive capacities in the Amazon rainforest. PNAS 119 (32) e2120777119.
Acknowlegments
This work was supported by NORAD (Norwegian Agency for Development Cooperation).

Citation
Finer M, Mamani N, Ariñez A, Castillo H (2026) Amazon Tipping Point – Where Are We? (2026 Update).